Cosmic-ray flux predictions and observations for and with Metis on board Solar Orbiter
←
→
Page content transcription
If your browser does not render page correctly, please read the page content below
Astronomy & Astrophysics manuscript no. output                                                                                          ©ESO 2021
June 18, 2021

Cosmic-ray flux predictions and observations for and with Metis on
                        board Solar Orbiter
    C. Grimani1, 2 , V. Andretta3 , P. Chioetto4, 5 , V. Da Deppo4 , M. Fabi1, 2 , S. Gissot6 , G. Naletto4, 7 , A. Persici1 , C.
Plainaki8 , M. Romoli9, 10 , F. Sabbatini11 , D. Spadaro12 , M. Stangalini8 , D. Telloni13 , M. Uslenghi14 , E. Antonucci13 , A.
 Bemporad13 , G. Capobianco13 , G. Capuano15 , M. Casti16 , Y. De Leo15, 17 , S. Fineschi13 , F. Frassati13 , F. Frassetto4 , P.
    Heinzel18 , G. Jerse19 , F. Landini13 , A. Liberatore13 , E. Magli20 , M. Messerotti19 , D. Moses21 , G. Nicolini13 , M.
Pancrazzi13 , M. G. Pelizzo22 , P. Romano12 , C. Sasso3 , U. Schühle17 , A. Slemer4 , T. Straus3 , R. Susino13 , L. Teriaca17 ,
                              C. A. Volpicelli13 , J. L. Freiherr von Forstner23 , and P. Zuppella4
                                                   (Affiliations can be found after the references)

                                                                     ABSTRACT

Context. The Metis coronagraph is one of the remote sensing instruments hosted on board the ESA/NASA Solar Orbiter mission. Metis is devoted
to carry out the first simultaneous imaging of the solar corona in both visible light (VL) and ultraviolet (UV). High-energy particles can penetrate
spacecraft materials and may limit the performance of the on-board instruments. A study of the galactic cosmic-ray (GCR) tracks observed in the
first VL images gathered by Metis during the commissioning phase is presented here. A similar analysis is planned for the UV channel.
Aims. We aim to formulate a prediction of the GCR flux up to hundreds of GeV for the first part of the Solar Orbiter mission to study the
performance of the Metis coronagraph.
Methods. The GCR model predictions are compared to observations gathered on board Solar Orbiter by the High-Energy Telescope in the range
between 10 MeV-100 MeV in the summer of 2020 as well as with the previous measurements. Estimated cosmic-ray fluxes above 70 MeV n−1 have
been also parameterized and used for Monte Carlo simulations aimed at reproducing the cosmic-ray track observations in the Metis coronagraph
VL images. The same parameterizations can also be used to study the performance of other detectors.
Results. By comparing observations of cosmic-ray tracks in the Metis VL images with FLUKA Monte Carlo simulations of cosmic-ray interactions
in the VL detector, we find that cosmic rays fire only a fraction, on the order of 10−4 , of the whole image pixel sample. We also find that the overall
efficiency for cosmic-ray identification in the Metis VL images is approximately equal to the contribution of Z>2 GCR particles. A similar study
will be carried out during the whole of the Solar Orbiter’s mission duration for the purposes of instrument diagnostics and to verify whether the
Metis data and Monte Carlo simulations would allow for a long-term monitoring of the GCR proton flux.
Key words. cosmic rays – solar-terrestrial relations – Instrumentation: detectors

1. Introduction                                                              10 MeV n−1 . We present an analysis of cosmic-ray signatures in
                                                                             the VL images in this work. Cosmic-ray observations gathered
The ESA/NASA Solar Orbiter mission (Müller et al. 2020; Gar-                 on board Solar Orbiter between 10 MeV and 100 MeV with the
cía Marirrodriga et al. 2021) was launched on February 10, 2020,             High-Energy Telescope (HET) of the Energetic Particle Detector
at 5:03 AM CET from Cape Canaveral (Florida, USA) during                     (EPD) instrument (Rodríguez-Pacheco et al. 2020; von Forstner
the solar minimum period between the solar cycle 24 and so-                  et al. 2021; Mason et al. 2021; Wimmer-Schweingruber et al.
lar cycle 25, characterized by a positive polarity period of the             2021) and model predictions of GCR energy spectra above 70
global solar magnetic field (GSMF). Four in situ and six remote              MeV n−1 are also considered in the following for Monte Carlo
sensing instruments were placed on board the spacecraft (S/C)                simulations (Battistoni et al. 2014; Böhlen et al. 2014; Vla-
to study how the Sun generates and controls the heliosphere                  choudis 2009) aimed at reproducing and validating the tracks of
(Müller et al. 2020). The S/C will reach a minimum distance                  cosmic rays observed in the Metis VL images. A similar analysis
from the Sun of 0.28 AU and a maximum inclination about the                  will be carried out for the UV channel in the future.
solar equator of 33 degrees during the mission lifetime. Galac-                  The GCRs consist approximately of 98% of protons and he-
tic cosmic-ray (GCR) and solar energetic particle (SEP) interac-             lium nuclei, 1% electrons, and 1% nuclei with Z≥3, where per-
tions in the material surrounding the sensitive part of the instru-          centages are in particle numbers to the total number (Papini et al.
ments generate secondary particles that limit the performance of             1996). This work is focused on protons and 4 He nuclei since
the detectors on board space missions (see for instance Telloni              these particles constitute the majority of the cosmic-ray bulk and
et al. 2016; Armano et al. 2018a, 2019; Grimani et al. 2020).                the measurements carried out on board Solar Orbiter allow us to
In particular, GCRs and SEPs affect the quality of visible light             optimize the Monte Carlo simulations by selecting proper in-
(VL, in the range 580-640 nm) and ultraviolet (UV, in a ' 10                 put fluxes within the range of predictions. Rare particles such as
nm band around the 121.6 nm Hi Lyman-α line) images of the                   heavy nuclei and electrons will be considered in the future when
Metis coronagraph (Antonucci et al. 2020; Andretta et al. 2014).             data from magnetic spectrometer experiments becomes available
Metis, mounted on an external panel of the Solar Orbiter S/C,                (Aguilar et al. 2018) up to high energies for the period under
is shielded by a minimum of 1.2 g cm−2 of material and con-                  study. At the present time, uncertainties on the predictions of
sequently is traversed by protons and nucleons with energies >               the energy spectra of rare particles would be higher than their
                                                                                                                           Article number, page 1 of 9

  Article published by EDP Sciences, to be cited as https://doi.org/10.1051/0004-6361/202140930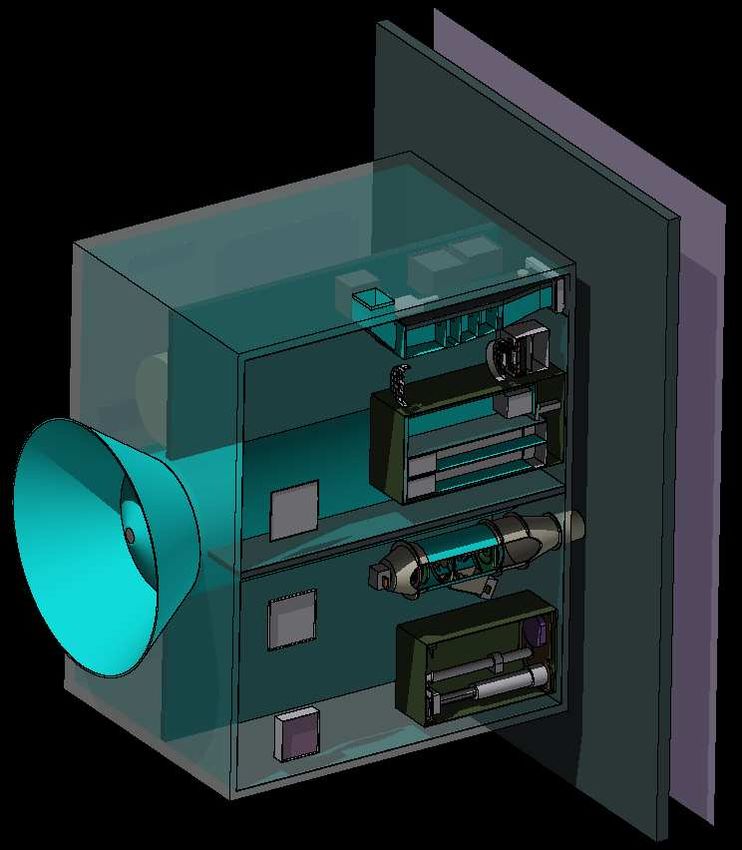
A&A proofs: manuscript no. output

contribution to the observations carried out with the Metis coro-      2. Galactic cosmic-ray flux radial and latitudinal
nagraph. The overall GCR flux shows time, energy, charge. and             gradients in the inner heliosphere
space modulation in the inner heliosphere (Grimani et al. 2020),
an aspect of particular importance also in the context of plane-       The GCR proton flux gradients with radial distance from the Sun
tary Space Weather and Solar System exploration (Plainaki et al.       and heliolatitude were studied with simultaneous observations
2016, 2020). In particular, the GCR flux shows modulations as-         gathered by S/C moving along different orbits in order to dis-
sociated with the 11-year solar cycle and the 22-year polarity         entangle the role of space and time variations. The majority of
reversal of the GSMF. These long-term modulations are ascrib-          space instruments are flown near Earth. In particular, those mis-
able to the particle propagation against the outward motion of         sions sent to space during the first part of the solar cycle 23 and
the solar wind and embedded magnetic field (Balogh 1998). Par-         the second part of the solar cycle 24 experienced the same polar-
ticles that at the interstellar medium have energies below tens        ity of the GSMF as Solar Orbiter. Ulysses, launched on October
of MeV are convected outward before reaching the inner helio-          6, 1990, was placed in an elliptical orbit around the Sun inclined
sphere, while interplanetary and interstellar GCR energy spec-         at 80.2 degrees to the solar equator (Wenzel et al. 1992). The
tra do not show any significant difference above tens of GeV           mission was switched off in June 2009. The Kiel Electron Tele-
(Florinski & Pogorelov 2009).                                          scope (Wibberenz et al. 1992) on board Ulysses measured elec-
                                                                       trons, protons, and helium nuclei from MeV to GeV energies.
     Adiabatic cooling represents the dominant energy loss of
                                                                       On June 15, 2006, the Pamela (Payload for Antimatter Matter
cosmic rays observed in the inner heliosphere in the energy
                                                                       Exploration and Light-nuclei Astrophysics; Picozza et al. 2007)
range 10-100 MeV. At these energies cosmic rays can be con-
                                                                       satellite was launched to collect proton, nucleus and electron
sidered an expanding adiabatically isolated gas of particles that
                                                                       data near Earth above 70 MeV n−1 during a period characterized
does work on the surrounding medium thus reducing its inter-
                                                                       by negative polarity of the GSMF and a minimum solar modula-
nal energy. Above tens of MeV cosmic rays diffuse, scatter and
                                                                       tion. In that same time, Ulysses covered a distance from the Sun
drift through the solar wind and across inhomogeneities of the
                                                                       that was between 2.3 and 5.3 AU.
interplanetary magnetic field (Jokipii et al. 1977). The total resi-
                                                                           The comparison between Ulysses and Pamela overlapping
dence time of cosmic rays in the heliosphere is strongly energy-
                                                                       measurements revealed that the proton flux in the rigidity inter-
dependent and varies from hundreds of days at 100 MeV n−1 to
                                                                       val 1.6-1.8 GV (0.92-1.09 GeV, corresponding approximately to
tens of days above 1 GeV (Florinski & Pogorelov 2009). Pos-
                                                                       the median energy of the GCR spectrum at solar minimum) has a
itively charged GCRs undergo a drift process (see for instance
                                                                       radial intensity variation of 2.7±0.2%/AU, and a latitudinal gra-
Grimani et al. 2004; 2008) during negative polarity periods of
                                                                       dient of −0.024±0.005%/degree (De Simone et al. 2011). Posi-
the GSMF (when the Sun magnetic field lines exit from the
                                                                       tive (negative) latitudinal gradients are observed during positive
Sun South Pole) propagating mainly sunward from the equator
                                                                       (negative) polarity periods. In addition, Experiment 6 (E6) on
along the heliospheric current sheet. Negatively charged parti-
                                                                       board Helios-A and Helios-B provided ion data from four to sev-
cles would suffer the same drift process during positive polarity
                                                                       eral hundreds of MeV n−1 (Winkler 1976; Marquardt & Heber
periods (epochs during which the Sun magnetic field lines exit
                                                                       2019). The Helios-A and Helios-B S/C were launched on De-
from the Sun North Pole). As a result, during negative (posi-
                                                                       cember 10, 1974 and January 15, 1976 during a positive polarity
tive) polarity periods, the positively (negatively) charged cosmic
                                                                       epoch and were sent into ecliptic orbits of 190-day and 185-day
rays are more modulated than during positive (negative) polarity
                                                                       periods around the Sun. The orbits perihelia were 0.3095 AU
epochs.
                                                                       and 0.290 AU, respectively. The aphelia were approximately 1
     The spatial dependence of the GCR proton flux was studied         AU. As a result, the Helios data are representative of the cosmic-
with different S/C gathering data simultaneously between tens          ray bulk variations that are to be experienced by Solar Orbiter,
of MeV and GeV energies. The intensity of these particles was          which will also reach maximum distances from the Sun of about
observed to decrease by a few percent with decreasing radial dis-      1 AU. In the recent paper by Marquardt & Heber (2019), the He-
tance from the Sun and to vary  1% with increasing heliolati-         lios proton data radial gradients of the GCR flux were found to
tude with gradients depending on the GSMF polarity epoch (De           be 6.6±4% above 50 MeV and 2±2.5% between 250 and 700
Simone et al. 2011).                                                   MeV between 0.4 and 1 AU. These results are in agreement with
     Solar Orbiter was launched during a positive polarity period      those from Pamela/Ulysses (within the statistical and systematic
of the Sun, therefore, the drift process played no role in modulat-    errors). In conclusion, variations in the GCR proton-dominated
ing the overall GCR flux in 2020. The same condition will apply        flux along the Solar Orbiter orbit are expected to be of a few
until the next polarity change expected at the maximum of solar        % at most; consequently, it is plausible to assume that models
cycle 25 between 2024 and 2025 (Singh & Bhargawa 2019).                for cosmic-ray modulation developed on the basis of observa-
     This manuscript is arranged as follows. In Sect. 2, the radial    tions gathered near Earth will also apply to Solar Orbiter. On the
and latitudinal gradients of the cosmic-ray flux in the inner he-      other hand, the Metis data will allow us to verify this assump-
liosphere along the Solar Orbiter orbit are discussed. In Sect. 3,     tion in the unexplored region of tens of degrees above the solar
the GCR flux predictions and observations are presented for the        equator. Analogously, even though no SEP data were gathered
summer of 2020. In Sect. 4, the Metis coronagraph is briefly de-       up to present time, it is likely that a study of the evolution of
scribed. In Sect. 5, the S/C on-board algorithm for cosmic-ray         SEP events near the Sun above the solar equator will be possi-
track selection in the Metis VL images is illustrated. In Sect.        ble for the first time also with Metis, in addition to the dedicated
6, we present a viewer developed for the Metis cosmic-ray ma-          instruments flown on board Solar Orbiter.
trices. In Sect. 7, we report the GCR observations with Metis.
Finally, in Sect. 8, simulations of the Metis VL detector car-         3. Galactic cosmic-ray energy spectra in the
ried out with the FLUKA Monte Carlo program are discussed                 summer 2020 for Solar Orbiter
and compared to the observations, along with an evaluation of
the capability of the Metis VL detector to serve as a cosmic-ray       Solar activity was observed to modulate the near-Earth cosmic-
monitor.                                                               ray integral flux during the last three solar cycles from solar min-
Article number, page 2 of 9
C. Grimani et al.: Cosmic-ray flux predictions and observations for and with Metis on board Solar Orbiter
imum (e.g. years 2009 and 2019) through solar maximum (years
1989-1991) above 70 MeV n−1 by approximately a factor of four. 250
Sunspot Number
We consider this particular period of time since solar modula- 225
tion has been studied in the majority of cases with data gathered 200
in space1 . The above estimate was carried out with the Gleeson 175
Solar Orbiter launch
and Axford model (G&A; Gleeson & Axford 1968). The same 150
model is also adopted here to estimate the GCR flux modulation 125
by considering the observed average monthly sunspot number 100
as a proxy of the solar activity2 (Clette et al. 2014). This model 75
allows us to estimate the cosmic-ray intensity in the inner he- 50
liosphere by assuming an interstellar energy spectrum and a so- 25
lar modulation parameter (φ) that basically represents the energy 0
1995 2000 2005 2010 2015 2020
loss of cosmic rays propagating from the interstellar medium to Time (Years)
the point of observations.
During GSMF positive polarity epochs, the G&A model is
found to reproduce the GCR measurements well at 1 AU in the Fig. 1. Average monthly sunspot number observed since 1994 (Clette
energy range from tens of MeV to hundreds of GeV (Grimani et al. 2014).
et al. 2008). It has been pointed out that different values of the so-
lar modulation parameter are estimated if different GCR energy Table 1. Average monthly sunspot number observed after the Solar
spectra at the interstellar medium are considered in the model. Orbiter launch.
Voyager 1 measured the interstellar spectra of ions and electrons
below 1 GeV (Stone et al. 2013). However, the solar modula- Monthly sunspot number
tion parameter3 adopted in this work (Usoskin et al. 2011, 2017) February 2020 0.2
was estimated according to the Burger et al. (2000) interstellar March 2020 1.5
proton spectrum. Since the solar modulation parameter and the April 2020 5.2
interstellar particle spectra must be adequately associated with May 2020 0.2
one another, the interstellar proton spectrum by Burger et al. June 2020 5.8
(2000) is also considered here. Unfortunately, no 4 He interstel- July 2020 6.1
lar spectrum is reported in this last paper and, consequently, here August 2020 7.5
we adopt the estimate by Shikaze et al. (2007) that was inferred September 2020 0.6
from the balloon-borne BESS experiment data (Abe et al. 2014), October 2020 14.4
which were gathered during different solar modulation and solar November 2020 34.0
polarity periods. This choice is not expected to affect the overall December 2020 21.8
simulation outcomes by more than a few % since the cosmic- January 2021 10.4
ray bulk is dominated by protons. A similar approach was con-
sidered for the LISA Pathfinder mission orbiting around the first
Lagrange point during the years 2016-2017 (Armano et al. 2016, Solar activity has been very low since 2019, when the annual
2018b). It was shown in Villani et al. (2020) that the integral pro- sunspot number of 3.6 was observed and it slightly increased in
ton flux predictions carried out with the G&A model for LISA 2020. The average monthly sunspot number observed after the
Pathfinder differ by less than 10% from the Alpha Magnetic Solar Orbiter launch is also reported in Table 1. It is focused
Spectrometer (AMS-02) experiment data (AMS Collaboration in particular on the period June-July 2020, when the EPD/HET
et al. 2002; Aguilar et al. 2018) gathered on the Space Station data were released for the first time and the average sunspot
during the Bartels Rotation 2491 (Grimani et al. 2019). For the number was 6.0. The solar modulation parameter for this pe-
present work, it is also possible to benefit of the proton and he- riod is reasonably assumed to range between 300 MV c−1 and
lium differential flux measurements of the EPD/HET instrument 340 MV c−1 . In particular, a solar modulation of 340 MV c−1
flying on board Solar Orbiter and gathering data in the energy corresponds to the average solar modulation parameter observed
range below 100 MeV in order to further reduce the uncertainty during periods of a similar solar activity observed in the past
on the GCR flux predictions, while we await the publication of years, while 300 MV c−1 is considered a lower limit for φ corre-
the AMS-02 data for the years after 2017, up to TeV energies. sponding to the GCR flux modulation that seems to better agree
In Fig. 1, we show the average monthly sunspot number ob- with the EPD/HET data below 100 MeV reported as black stars
served during the solar cycles 23 and 24. Minimum, average, and in Fig. 2 after rebinning. The uncertainty on the integral flux
maximum predictions of the sunspot number are inferred from predictions is 16%, only because of the small solar modulation
the Marshall Space Flight Center website4 and appear as dotted variation between June and July 2020. The EPD/HET data are
and dashed lines in the same figure. The launch of the Solar Or- compared below 100 MeV with measurements carried out by
biter S/C is also indicated. For the first two to three years of the other experiments during similar conditions of solar modulation
Solar Orbiter mission, it is reasonable to expect a minimum to and GSMF polarity (see Table 2). The estimated proton and 4 He
low solar modulation, analogously to the years 1996-1997 at the energy spectra also appear in Fig. 2, with continuous lines for
beginning of the solar cycle 23 during a positive polarity epoch. protons and with dashed lines for 4 He.
We are aware that the in-flight calibration of the EPD/HET
1
http://cosmicrays.oulu.fi/phi/Phi_mon.txt instrument is still ongoing and, in particular, the proton fluxes
2
Data used here are publicly available at http://www.sidc.be/ above 10 MeV are overestimated by a factor of up to two, as dis-
silso/datafiles cussed by Wimmer-Schweingruber et al. (2021). However, in the
3
see http://cosmicrays.oulu.fi/phi/Phi_mon.txt following, we consider φ = 300 MV c−1 because this parameter
4
https://solarscience.msfc.nasa.gov/predict.shtml modulation value allows us to reconcile our galactic cosmic-ray
Article number, page 3 of 9A&A proofs: manuscript no. output
flux predictions with HET measurements within the normaliza- aim of obtaining the major scientific return with VL and UV ob-
tion uncertainty and because it appears reasonable with respect servations of the corona while suffering large thermal variations
to 320 MV c−1 observed at the time of the LISA Pathfinder mis- (up to about 400 ◦ C in the region of the inverted external occul-
sion in mid-2017 when the solar modulation was higher than in ter) along the Solar Orbiter orbit. Total mass (< 24.55 kg) and
2020 (Armano et al. 2018a). power consumption (< 28 W) were also limited as imposed to
The particle energy spectra above 70 MeV have been param- interplanetary missions. Moreover, the Metis design was opti-
eterized as follows (see for details Grimani et al. 2020): mized to achieve a sensitivity to observe the weak corona from
1.7 R through 9 R by maintaining a contrast ratio lower than
10−9 and pointing the Sun center within one arcmin. With an in-
F(E) = A (E + b)−α E β particles/(m2 sr s GeV/n), (1) novative occultation design and a unique combination of mirrors
and filters, Metis images the VL corona in the range 580-640 nm
where E is the particle kinetic energy per nucleon in GeV/n. The (corresponding to yellow-orange light) and the UV Hi Lyman-α
parameters A, b, α, and β for minimum (m) and maximum (M) line at 121.6 nm. The VL channel includes a polarimeter that
predictions are shown in Table 3, along with the lower limit (ll) allows us to observe the linearly polarized component of the K
for the estimated proton flux in 2020 set by the Pamela experi- corona. The minimum spatial resolution at perihelion is 2000
ment observations carried out in 2008 during a period of low so- km for VL images and the temporal resolution is up to 1 second.
lar modulation and negative GSMF polarity (Adriani et al. 2011). The VL detector consists of a VL camera with an active CMOS
(CMOSIS ISPHI Rev. B developed by CMOSIS Imaging Sen-
sors, now AMS, Belgium) sensor segmented into 4.1943 × 10⁶
pixels. Each pixel has dimensions of 10µm×10µm×4.5µm (An-
Particle Flux (m2 sr s GeV)-1
tonucci et al. 2020), accounting for a pixel and detector geomet-
rical factors of 401 µm2 sr and 17 cm2 sr, respectively (Sullivan
1971).
3
10
5. Metis algorithm for cosmic-ray detection
When the VL and UV detectors work in analog mode, several
10
2
frames are co-added to obtain a single image to improve the
signal-to-noise (S/N) ratio (Andretta et al. 2014). The detection
and removal of GCRs, as well as (eventually) solar energetic par-
ticles, is carried out on board by the Metis processing unit. The
10
primary goal of the particle track removal process is to improve
the quality of the images. As a byproduct, the algorithm also
provides the location and number of particle tracks in each im-
1
age which, in principle, can be correlated with the GCR integral
flux over the image integration time. No particle identification
is allowed. Other instruments such as the extreme UV imager
SOHO-EIT (Delaboudinière et al. 1995) and the coronagraph
10
-1
-2 -1 2
STEREO-SECCHI (Wuelser et al. 2004) reported a number of
10 10 1 10 10
Energy (GeV/n) pixels fired by GCRs per second per square centimeter differing
by almost two orders of magnitude (Andretta et al. 2014). As re-
called above, this evidence cannot be ascribabed to variations in
solar activity. The above-mentioned results must have resulted
Fig. 2. Predictions of proton and 4 He nucleus fluxes during the sum-
mer 2020 for the Solar Orbiter mission. The top and bottom continuous from particle interactions in the S/C material surrounding the
(protons) and dashed (4 He nuclei) curves are obtained with the G&A instruments. Therefore, Monte Carlo simulations are needed to
model above 70 MeV(/n) for a solar modulation parameter of 300 and correlate the particle tracks observed in the Metis coronagraph
340 MV/c, respectively. The dotted curve represents the lower limit to images to the incident flux of GCRs.
the predictions of the proton spectrum for the same period, representing The temporal noise observed in the CMOS pixel signals in-
the Pamela experiment data gathered in 2008 during a period of solar cludes both the readout noise and the statistical noise associated
activity similar to that of Solar Orbiter but during a negative GSMF with photons and dark current fluctuations. In principle, this tem-
epoch. Data are reported in Stone (1964, solid dots), Logachev et al. poral noise can be expressed as follows:
(2003, open triangles), and Marquardt & Heber (2019, solid triangles).
The solid stars and the open squares indicate the EPD/HET measure-
ments gathered in the summer 2020 on board Solar Orbiter for protons σ2 = A + B × p, (2)
and helium nuclei, respectively.
where p is the pixel value and A and B are coefficients that can be
fine-tuned on the basis of the characterization of the VL detector.
For each series of N images with exposure times of T seconds
4. Metis coronagraph and visible light image each, for each image i of the sequence, starting from i=2, and
characteristics for each pixel value p, the difference
Metis is a solar coronagraph that has been performing the first
δp = abs(pi − pi−1 ) (3)
simultaneous imaging of the off-limb solar corona in both visi-
ble light and ultraviolet (Antonucci et al. 2020). The main design is calculated. By defining pm =min(pi , pi−1 ), the related noise is
constraints for the Metis coronagraph were associated with the then estimated, as indicated in Eq. 2, with p=pm .
Article number, page 4 of 9C. Grimani et al.: Cosmic-ray flux predictions and observations for and with Metis on board Solar Orbiter
Table 2. Solar modulation and GSMF polarity for the datasets reported in Fig. 2a .
Experiment Time Solar activity (φ) Solar polarity
MV/c
HET/EPD June-July 2020 low (φ=300-340) >0
Helios/E6 1974-1978 low (φ=424-544) >0
IMP-8 14-16 May 1976 low (φ=434) >0
Near-Earth satellite 13 December 1961 average (φ=698) >0
Notes. (a) Data are reported in Stone (1964); Logachev et al. (2003); Marquardt & Heber (2019).
Table 3. Parameterizations of proton and helium energy spectra in June-July 2020 above 70 MeV n−1b .
Am bm αm βm AM bM αM βM All bll αll βll
p 18000 0.95 3.66 0.87 18000 0.875 3.66 0.87 18000 1.05 3.66 0.87
He 850 0.58 3.68 0.85 850 0.53 3.68 0.85
Notes. (b) Maximum (M; top continuous and dashed lines in Fig. 2), minimum (m; bottom continuous and dashed lines in Fig. 2) and lower limit
proton predictions (ll; dotted line in Fig. 2). The units of the parameters A and b are particles/(m2 sr s GeV/n−α+β+1 ) and GeV/n, respectively, while
the spectral indices α and β are pure numbers.
In the case δp2 > kth σ2 , both pixel values are replaced with 6. APViewer for cosmic-ray track analysis in the
pm . This process is repeated for each pixel of each image for Metis VL images
i=2,..., N. The parameter kth is also user defined and determines
the detection threshold. Figure 4 displays a Metis VL image of the solar corona. Af-
ter removing the cosmic-ray tracks, the on-board algorithm de-
As an example, the STEREO-B COR1 data are shown in scribed in the previous section allows us to report the fired pix-
Fig. 3 (see Andretta et al. 2014, and references therein). Fig- els in 2048×2048 matrices called cosmic-ray matrices. The al-
ure 3 displays the approximate Gaussian distributions of pixel gorithm cannot discriminate between intense signals generated
signals generated by photons and noise represented by the dark by cosmic rays from noisy pixels and bright sources that lie in
area, while the cosmic-ray signals are associated with the white the detector’s field of view. However, external bright sources and
area. The threshold is set at 5 σ from median. noisy pixels would be possibly found in the same matrix cells in
more than one image of each set of images, while cosmic rays
During the commissioning phase of the Solar Orbiter mis- would hit different pixels in each image. As a result, the superpo-
sion, the parameters A and B for Metis were set to 40000 and sition of several images allows to increase the statistics for GCR
0, respectively. Despite the possibility of further improvements analysis and to improve the S/N ratio. In the cosmic-ray matrices
to the algorithm performance for cosmic-ray searches in the fu- the pixel contents correspond to the number of times that, from
ture, very encouraging results have already been obtained in the the pixel-to-pixel comparison among each image of each set of
analysis presented here. images, the pixel content was changed to pm . For instance, in
this work, where a case study of four sets of four images (N=4)
is presented, the pixel contents are 0, 1, 2, or 3. The format of
the images is FITS. A dedicated viewer, APviewer, was devel-
oped for Metis in Python programming language for the visual
analysis of the particle tracks in the cosmic-ray matrices (Persici
2021). The APViewer allows for a more simplified visualization
and search of the cosmic-ray tracks. Furthermore, it provides an
efficient solution to a series of problems that other tools present.
In particular, the widely used viewer FV5 for images in FITS
format does not visually differentiate among pixels with distinct
values and does not provide a zoomed-in view of the region sur-
rounding an identified pattern of fired pixels. To this purpose, the
APViewer performs a coloring of the pixels according to their
values (> 0) and allows the user to choose the window size when
looking for a specific cosmic-ray track in order to guarantee an
accurate view of the surrounding context.
In the specific case of VL images, the main window of the
APViewer presents a 256x256 matrix that constitutes the central
inner portion of the original 2048x2048 matrix. This reduced
Fig. 3. STEREO-B COR 1 data gathered in 2007 and reported in An- matrix provides an overview of the location of the pixels tra-
dretta et al. (2014). The dark area is associated with VL photon signals versed by cosmic rays. The contents of the border cells of the
and dark current, while the white area is ascribable to the passage of reduced matrix are displayed as: a#b, where a corresponds to the
high-energy particles in the VL detector.
5
https://heasarc.gsfc.nasa.gov/docs/software/ftools/
fv/
Article number, page 5 of 9A&A proofs: manuscript no. output
sum of all the fired pixels (i.e., those with values greater than 0) considered here as a case study. These images were taken on
in the row or column portion of the corresponding side of the ma- May 29, 2020. The presence of noisy isolated pixels in the four
trix, whereas b represents the sum of the pixels with value equal images was studied by searching for fired pixels appearing in
to 1, thus returning the number of pixels traversed by cosmic rays more than one image – and none were found. Conversely, noisy
in the same undisclosed part of the matrix. In order to guarantee columns were found in two cosmic-ray matrices. These pixels
a straightforward search of cosmic-ray tracks, the main window were not considered for the analysis as they turned out to be just
includes two text boxes where the users can type the row and a fraction of approximately 3×10⁻⁵ and 5×10⁻⁵ , respectively, of
column number of the pixel they wish to see in greater detail. It the total number of pixels. The efficiency for single pixels be-
is worthwhile pointing out that fired pixels can also be analyzed ing fired was set with a study of a sample of 23 slant tracks:
through sub-windows that can be opened starting from the re- only 6 pixels out of 106 counted along the particle tracks were
duced matrix by means of a left or right click on the border cells. not fired and, consequently, the efficiency was set to 0.94±0.02.
These windows vary in size, according to the specific side of the This estimate represents a lower limit to the actual efficiency
matrix, and in number, depending on whether it is a corner cell applying to the total bulk of incident particles. The pixel inef-
or a border one. As an example, in Fig. 5, it is shown how it is ficiency depends on particle energy losses in the sensitive part
possible to open one of the hidden parts of a cosmic-ray matrix of the detector and, consequently, on the particle species and
starting from the corner of the central inner matrix. path length. Straight tracks impacting the central part of the pix-
els are certainly characterized by a higher efficiency than slant
tracks. Unfortunately, a dedicated beam test to estimate the effi-
ciency of the detector with different particle species and incident
directions was not carried out before the mission launch. Sin-
gle pixel and Metis on-board algorithm efficiencies for cosmic-
ray selection must properly be taken into account to reconcile
cosmic-ray observations carried out with Metis and the integral
flux of GCRs. Single-pixel, slant, and multiple tracks have been
counted in each studied VL image. The results are reported in
Table 4 where the tracks have been listed in categories accord-
ing to their topology. The average number of GCR tracks per set
of images corresponding to a total of 60 second exposure time
was 271±22.
The visual analysis of the Metis VL images did not allow
us to distinguish between primary and secondary particles gen-
erated by incident cosmic rays interacting in the material sur-
rounding the coronagraph. Monte Carlo simulations of the VL
detector were carried out to this end.
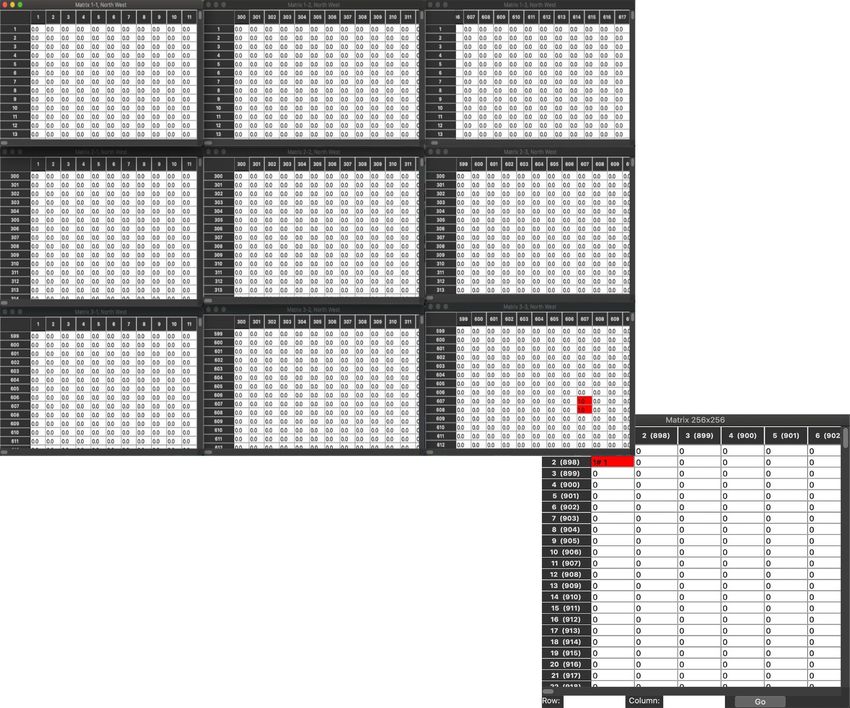
8. Comparison of simulations and cosmic-ray
Fig. 4. Polarized brightness image of the solar corona in VL (June 21, observations in the Metis visible light images
2020). The vertical orientation is north-south, according to the Solar
axis. The image was obtained with an exposure time of 30 s at a distance While single pixels and slant tracks observed in the Metis VL
of 0.5 AU from the Sun. images are certainly associated with single particles, the mul-
tiple tracks could have been generated by incident particle in-
teractions. A toy Monte Carlo allowed us to study the random
7. Analysis of cosmic-ray tracks in the Metis visible incidence of 300 particles (roughly equivalent to the number of
light images tracks observed in each set of VL images) on the active part of
the detector. Ten different runs were carried out and the aver-
A sample of cosmic-ray tracks observed in the Metis VL im- age minimum distance observed between different particle tracks
ages is shown in Fig. 6. GCR tracks are classified as single hits was of 5 pixels (' 50 µm), which is consistent with multiple-
(top left panel), slant tracks (top right panel), and multiple tracks track observations.
(bottom left panel). Slant tracks are associated with single parti- In Fig. 7, the geometry of the Solar Orbiter S/C and instru-
cles firing more than one pixel. We recall here that GCRs show ments adopted for the Metis VL detector simulations carried out
a spatial isotropic distribution and that each single fired pixel with the FLUKA Monte Carlo program (version 4.0.1) is shown.
has a geometrical factor and geometrical field of view of 401 The geometry includes the S/C structure, thrusters fuel tanks
µm2 sr and 132 degrees, respectively. Multiple tracks are asso- and the SPICE, EUI, PHI, and STIX instruments (García Marir-
ciated with patterns of fired pixels characterized by a distance rodriga et al. 2021, and references therein). Interplanetary and
from track centroid smaller than 12 pixels. The image shown in galactic particles traverse from about 1 g cm−2 to more than 10
the bottom right panel of Fig. 6 is not ascribable to the passage g cm−2 of material depending on the particle incidence direction
of cosmic rays and, rather, it represents the effects of a bright ex- before reaching the Metis VL detector. Proton and helium fluxes,
ternal source such as a star. The number of pixels with contents reported in Fig. 2 as the upper continuous and dashed lines, were
associated with external sources moving through the instrument considered as input GCR energy differential fluxes for the sum-
field of view during the acquisition of images was on the order mer 2020 above 70 MeV in the simulations. Particles with en-
of 10−5 of the total pixel sample. ergies below 70 MeV n−1 were found not to give any relevant
As recalled above, four sets of four co-added cosmic-ray ma- contribution to cosmic-ray tracks in the VL images. The number
trices characterized by 15 seconds (T) of exposure each, for a of incident particles was set in order to reproduce the 60 seconds
total of a 60 second exposure time for each set of images, were exposure time of the VL detector images. Longer simulations
Article number, page 6 of 9C. Grimani et al.: Cosmic-ray flux predictions and observations for and with Metis on board Solar Orbiter
Fig. 5. Example of cosmic-ray matrix corner window opening with the APViewer.
Table 4. Cosmic-ray tracks in the studied sets of Metis VL images. The square corresponds to track patterns of four fired pixels forming a square.
The other definitions are intuitive.
Image Set Single pixel Horizontal Vertical Slant Square Number of tracks
1 183 20 22 27 3 255
2 200 28 35 33 7 303
3 186 27 22 27 0 262
4 183 33 21 24 4 265
would have been unfeasible because of limited available compu- carried out with a separate set of Monte Carlo simulations with
tational power. The simulations returned 276±17 charged parti- which the relative role of protons, helium and heavy nuclei was
cles crossing the VL detector for incident proton flux only. This set at solar minimum according to Grimani et al. (2005), since no
number of tracks is similar to the observations within statistical heavy nucleus measurements were available for the summer of
uncertainties. It is worthwhile pointing out that the statistical er- 2020. The total number of cosmic-ray tracks in the Metis images
ror is smaller than the combination of the uncertainties on input is dominated by primary and secondary particles associated with
fluxes on the order of 10% on the basis of our previous experi- incident protons. It is also noted that the algorithm and detector
ence with LISA Pathfinder (Grimani et al. 2019) and the intrinsic efficiencies remove 35% of the tracks from the images, which is
Monte Carlo resolution also on the order of 10% (Lechner et al. the same percentage of pixels fired by helium and other nuclei.
2019). While the detector does not allow us to distinguish differ- Finally, the minimum distance between secondary particles gen-
ent particle species, the simulations indicate that for primary pro- erated by the same incident primary on the S/C ranged between 2
tons the particles traversing the sensitive part of the detector in cm and 500 µm. As a result, the FLUKA simulations confirmed
particle numbers to the total number down to 1% in composition the toy Monte Carlo results indicating that multiple tracks in the
are: 80% protons, 17% electrons and positrons, and 3% pions. VL images are produced by different incident particles. Accord-
For the helium run, particles crossing the sensitive part of the ing to these results – if confirmed during the rest of the mis-
VL detector were ascribable to 30% of the total bulk of tracks to sion when the solar modulation is expected to increase and after
He4 nuclei, 34% to electrons and positrons, 25% to protons, 10% the next polarity change in 2024-2025 – by assuming that no
to pions, and 1% to deuterium. It is also found that the number significant variation of the VL instrument sensitivity for GCR
of tracks generated by He4 amounts to 30% of the total sample detection is observed, the Metis proton-dominated data joined
generated by primary protons. The contribution of nuclei with with the Monte Carlo simulations may allow for the monitor-
Z>2 was estimated to be 5% of the total. This last estimate was ing of long-term variations of GCRs above 70 MeV. When the
Article number, page 7 of 9A&A proofs: manuscript no. output
Fig. 6. Examples of cosmic-ray tracks observations in the Metis VL images (top panels and bottom-left panel). A spurious pattern of hit pixels
ascribable to a bright external source, such as a star, appears in the bottom right panel.
magnetic spectrometer experiment AMS-02 eventually provides
absolute GCR flux measurements in 2020 for model prediction
normalization (along with the implementation of the full Solar
Orbiter S/C geometry), it should be possible to reduce the uncer-
tainties on the simulations and, consequently, on analyses of the
Metis cosmic-ray matrices. Finally, a comparison of the Metis
observations with those of other instruments flown on board So-
lar Orbiter, such as EUI-FSI (Rochus et al. 2020), will allow us
to further test the results of this work.
9. Conclusions
High-energy particles traverse and interact in the S/C materials
of space missions, thus limiting the efficiency of on-board in-
struments. A dedicated Python viewer was developed to study
the cosmic-ray tracks observed in the Metis VL images of the
solar corona. It was found that in 60 seconds of exposure time, Fig. 7. Solar Orbiter geometrical model. Remote sensing instruments
the number of pixels traversed by cosmic rays is a minor frac- and electronic boxes are visible.
tion (about 10−4 ) of the total number of pixels and, therefore,
the quality of the images is not significantly affected by cosmic
ray tracks. Monte Carlo simulations of the VL detector are con- measurements of other instruments such as EUI-FSI will allow
sistent with the number of observed tracks when only primary us to further test the results of this work.
protons are considered. The signatures of the passage of parti-
cles with charge >1 approximately account for the single-pixel Acknowledgements. Solar Orbiter is a space mission of international collabora-
and on-board algorithm overall efficiencies. Consequently, Metis tion between ESA and NASA, operated by ESA. The Metis programme is sup-
ported by the Italian Space Agency (ASI) under the contracts to the co-financing
data and Monte Carlo simulations may allow for the monitor- National Institute of Astrophysics (INAF): Accordi ASI-INAF N. I-043-10-0 and
ing of long-term variations of the proton flux. Future analyses Addendum N. I-013-12-0/1, Accordo ASI-INAF N.2018-30-HH.0 and under the
of Metis VL and UV cosmic-ray matrices and comparisons with contracts to the industrial partners OHB Italia SpA, Thales Alenia Space Italia
Article number, page 8 of 9C. Grimani et al.: Cosmic-ray flux predictions and observations for and with Metis on board Solar Orbiter
SpA and ALTEC: ASI-TASI N. I-037-11-0 and ASI-ATI N. 2013-057-I.0. Metis Stone, E. C. 1964, J. Geophys. Res., 69, 3939
was built with hardware contributions from Germany (Bundesministerium für Stone, E. C., Cummings, A. C., McDonald, F. B., et al. 2013, Science, 341, 150
Wirtschaft und Energie (BMWi) through the Deutsches Zentrum für Luft- und Sullivan, J. 1971, Nuclear Instruments and Methods, 95, 5
Raumfahrt e.V. (DLR)), from the Academy of Science of the Czech Republic Telloni, D., Fabi, M., Grimani, C., & Antonucci, E. 2016, AIP Conference Pro-
(PRODEX) and from ESA. ceedings, 1720
We thank J. Pacheco and J. Von Forstner of the EPD/HET collaboration for useful Usoskin, I. G., Bazilevskaya, G. A., & Kovaltsov, G. A. 2011, Journal of Geo-
discussions about cosmic-ray data observations gathered on board Solar Orbiter. physical Research (Space Physics), 116, A02104
We thank also the PHI and EUI Collaborations for providing useful details about Usoskin, I. G., Gil, A., Kovaltsov, G. A., Mishev, A. L., & Mikhailov, V. V. 2017,
instrument geometries for S/C simulations. Journal of Geophysical Research (Space Physics), 122, 3875
Villani, M., Benella, S., Fabi, M., & Grimani, C. 2020, Applied Surface Science,
512, 145734
Vlachoudis, V. 2009, in International Conference on Mathematics, Computa-
References tional Methods & Reactor Physics (M&C 2009), Saratoga Springs, New York,
790–800
Abe, K., Fuke, H., Haino, S., et al. 2014, Advances in Space Research, 53, 1426 von Forstner, J. L. F., Dumbović, M., Möstl, C., et al. 2021, Radial Evolu-
Adriani, O., Barbarino, G. C., Bazilevskaya, G. A., et al. 2011, Science, 332, 69 tion of the April 2020 Stealth Coronal Mass Ejection between 0.8 and
Aguilar, M., Ali Cavasonza, L., Alpat, B., et al. 2018, Phys. Rev. Lett., 121, 1 AU – A Comparison of Forbush Decreases at Solar Orbiter and Earth,
051101 https://www.aanda.org/component/article?access=doi&doi=10.1051/0004-
AMS Collaboration, Aguilar, M., Alcaraz, J., et al. 2002, Phys. Rep., 366, 331 6361/202039848, A&A forthcoming article
Andretta, V., Bemporad, A., Focardi, M., et al. 2014, in Society of Photo-Optical Wenzel, K. P., Marsden, R. G., Page, D. E., & Smith, E. J. 1992, A&AS, 92, 207
Instrumentation Engineers (SPIE) Conference Series, Vol. 9152, Software Wibberenz, G., Kunow, H., Müller-Mellin, R., et al. 1992, Geophysical Research
and Cyberinfrastructure for Astronomy III, 91522Q Letters, 19, 1279
Antonucci, E., Romoli, M., Andretta, V., et al. 2020, A&A, 642, A10 Wimmer-Schweingruber, R. F., Pacheco, D., Janitzek, N., et al. 2021, submitted
Armano, M., Audley, H., Auger, G., et al. 2016, Phys. Rev. Lett., 116, 231101 to A&A
Armano, M., Audley, H., Baird, J., et al. 2018a, Astrophys. J., 854, 113 Winkler, W. 1976, Acta Astronautica, 3, 435
Armano, M., Audley, H., Baird, J., et al. 2019, Astrophys. J., 874, 167 Wuelser, J.-P., Lemen, J. R., Tarbell, T. D., et al. 2004, in Telescopes and In-
Armano, M., Audley, H., Baird, J., et al. 2018b, Physical Review Letters, 120, strumentation for Solar Astrophysics, ed. S. Fineschi & M. A. Gummin, Vol.
061101 5171, International Society for Optics and Photonics (SPIE), 111 – 122
Balogh, A. 1998, Space Sci. Rev., 83, 93
Battistoni, G., Boehlen, T., Cerutti, F., et al. 2014, in Joint International Confer-
ence on Supercomputing in Nuclear Applications + Monte Carlo, 06005 1
Böhlen, T. T., Cerutti, F., Chin, M. P. W., et al. 2014, Nuclear Data Sheets, 120, DiSPeA, University of Urbino Carlo Bo, Urbino (PU), Italy
211 e-mail: catia.grimani@uniurb.it
2
Burger, R. A., Potgieter, M. S., & Heber, B. 2000, Journal of Geophysical Re- INFN, Florence, Italy
search: Space Physics, 105, 27447 3
INAF – Astronomical Observatory of Capodimonte, Naples, Italy
Clette, F., Svalgaard, L., Vaquero, J. M., & Cliver, E. W. 2014, Space Sci. Rev., 4
CNR – IFN, Via Trasea 7, 35131, Padova, Italy
186, 35 5
CISAS, Centro di Ateneo di Studi e Attività Spaziali "Giuseppe
De Simone, N., Di Felice, V., Gieseler, J., et al. 2011, Astrophysics and Space
Sciences Transactions, 7, 425
Colombo", via Venezia 15, 35131 Padova, Italy
6
Delaboudinière, J. P., Artzner, G. E., Brunaud, J., et al. 1995, Sol. Phys., 162, Solar-Terrestrial Centre of Excellence – SIDC, Royal Observatory
291 of Belgium, Ringlaan -3- Av. Circulaire, 1180 Brussels, Belgium
7
Florinski, V. & Pogorelov, N. V. 2009, ApJ, 701, 642 Dip. di Fisica e Astronomia “Galileo Galilei”, Università di Padova,
García Marirrodriga, C., Pacros, A., Strandmoe, S., et al. 2021, A&A, 646, A121 Via G. Marzolo, 8, 35131, Padova Italy
Gleeson, L. J. & Axford, W. I. 1968, Ap. J., 154, 1011 8
ASI – Italian Space Agency, Via del Politecnico snc, 00133 Rome,
Grimani, C., Cesarini, A., Fabi, M., et al. 2020, The Astrophysical Journal, 904, Italy
64 9
University of Florence, Physics and Astronomy Department, Largo
Grimani, C., Fabi, M., Finetti, N., & Tombolato, D. 2008, International Cosmic
E. Fermi 2, 50125 Florence, Italy
Ray Conference, 1, 485 10
Grimani, C., Telloni, D., Benella, S., et al. 2019, Atmosphere, 10, 749 INAF Associated Scientist, Italy
11
Grimani, C., Vocca, H., Bagni, G., et al. 2005, Classical and Quantum Gravity, Alma Mater University, Bologna, Italy
12
22, S327 INAF – Astrophysical Observatory of Catania, Italy
13
Grimani, C., Vocca, H., Barone, M., et al. 2004, Classical and Quantum Gravity, INAF – Astrophysical Observatory of Torino, Italy
21, S629 14
INAF – Institute for Space Astrophysics and Cosmic Physics, Milan,
Jokipii, J. R., Levy, E. H., & Hubbard, W. B. 1977, ApJ, 213, 861 Italy
Lechner, A., Auchmann, B., Baer, T., et al. 2019, Phys. Rev. Accel. Beams, 22, 15
University of Catania, Physics and Astronomy Department "Ettore
071003
Majorana", via S. Sofia 78, 95123 Catania, Italy
Logachev, Y. I., Zeldovich, M. A., Surova, G. M., & Kecskemety, K. 2003, Cos- 16
mic Research, 41, 13 Catholic University @ NASA – GSFC, Maryland, USA
17
Marquardt, J. & Heber, B. 2019, A&A, 625, A153 MPS, Göttingen, Germany
18
Mason, G. M., Ho, G. C., Allen, R. C., et al. 2021, Quiet-time low en- Academy of Science of the Czech Republic
19
ergy ion spectra observed on Solar Orbiter during solar minimum, INAF - Astrophysical Observatory of Trieste, Italy
https://www.aanda.org/component/article?access=doi&doi=10.1051/0004- 20
Politecnico di Torino, Italy
6361/202140540, A&A forthcoming article 21
NASA HQ, Washington, DC, USA
Müller, D., St. Cyr, O. C., Zouganelis, I., et al. 2020, A&A, 642, A1 22
National Research Council of Italy and Institute for Electronics,
Papini, P., Grimani, C., & Stephens, S. 1996, Nuovo Cim., C19, 367
Information Engineering and Telecommunications, University of
Persici, A. 2021, "Analisi di immagini in dark dal coronografo Metis a bordo
della missione spaziale ESA/NASA Solar Orbiter per la rivelazione di tracce Padova, Department of Information Engineering via Gradenigo, 6B,
di raggi cosmici", University of Urbino Carlo Bo Thesis, available upon re- 35131 Padova
23
quest. Institute of Experimental and Applied Physics, Kiel Univer-
Picozza, P., Galper, A., Castellini, G., et al. 2007, Astroparticle Physics, 27, 296 sity,24118 Kiel, Germany
Plainaki, C., Antonucci, M., Bemporad, A., et al. 2020, J. Space Weather Space
Clim., 10, 6
Plainaki, C., Lilensten, J., Radioti, A., et al. 2016, J. Space Weather Space Clim.,
6, A31
Rochus, P., Auchère, F., Berghmans, D., et al. 2020, A&A, 642, A8
Rodríguez-Pacheco, J., Wimmer-Schweingruber, R. F., Mason, G. M., et al.
2020, A&A, 642, A7
Shikaze, Y., Haino, S., Abe, K., et al. 2007, Astroparticle Physics, 28, 154
Singh, A. K. & Bhargawa, A. 2019, Ap&SS, 364, 12
Article number, page 9 of 9You can also read