Social network analysis of COVID-19 transmission in Karnataka, India
←
→
Page content transcription
If your browser does not render page correctly, please read the page content below
Epidemiology and Infection                            Social network analysis of COVID-19
        cambridge.org/hyg
                                                              transmission in Karnataka, India
                                                              S. Saraswathi1, A. Mukhopadhyay2, *                       , H. Shah2, † and T. S. Ranganath1
                                                              1
                                                                Department of Community Medicine, Bangalore Medical College and Research Institute, Bangalore, Karnataka,
        Original Paper                                        India and 2Independent researcher
        *Formerly with Department of Community
        Medicine, Bangalore Medical College and                 Abstract
        Research Institute, Bangalore, Karnataka,
        India.                                                  We used social network analysis (SNA) to study the novel coronavirus (COVID-19) outbreak in
                                                                Karnataka, India, and to assess the potential of SNA as a tool for outbreak monitoring and con-
        †
          Formerly with Henry Ford Health System,               trol. We analysed contact tracing data of 1147 COVID-19 positive cases (mean age 34.91 years,
        Detroit, Michigan, USA.                                 61.99% aged 11–40, 742 males), anonymised and made public by the Karnataka government.
        Cite this article: Saraswathi S, Mukhopadhyay           Software tools, Cytoscape and Gephi, were used to create SNA graphics and determine network
        A, Shah H, Ranganath TS (2020). Social                  attributes of nodes (cases) and edges (directed links from source to target patients). Outdegree
        network analysis of COVID-19 transmission in            was 1–47 for 199 (17.35%) nodes, and betweenness, 0.5–87 for 89 (7.76%) nodes. Men had
        Karnataka, India. Epidemiology and Infection            higher mean outdegree and women, higher mean betweenness. Delhi was the exogenous source
        148, e230, 1–10. https://doi.org/10.1017/
        S095026882000223X
                                                                of 17.44% cases. Bangalore city had the highest caseload in the state (229, 20%), but compara-
                                                                tively low cluster formation. Thirty-four (2.96%) ‘super-spreaders’ (outdegree ⩾ 5) caused 60%
        Received: 8 June 2020                                   of the transmissions. Real-time social network visualisation can allow healthcare administrators
        Revised: 5 September 2020                               to flag evolving hotspots and pinpoint key actors in transmission. Prioritising these areas and
        Accepted: 18 September 2020
                                                                individuals for rigorous containment could help minimise resource outlay and potentially
        Key words:                                              achieve a significant reduction in COVID-19 transmission.
        Analysis of data; contact tracing; COVID-19;
        infectious disease epidemiology; social
        network analysis                                      Introduction
        Author for correspondence:                            The novel coronavirus (COVID-19) outbreak has attained the proportions of a global calamity. Not
        A. Mukhopadhyay,                                      only has the virus sickened millions, it has also affected economic growth worldwide. Researchers
        E-mail: dr.amukho@gmail.com                           have pointed to overpopulation, globalisation, and hyper-connectivity as factors responsible for
                                                              intensifying the spread of infection, turning the outbreak into a pandemic [1]. The first case of cor-
                                                              onavirus disease caused by the severe acute respiratory syndrome coronavirus 2 (SARS-CoV-2) in
                                                              India was reported on 30 January 2020, and the first case in Karnataka, a southern state of India, was
                                                              reported on 9 March 2020 [2]. In the initial phases of the infection’s spread through the country,
                                                              Karnataka reported fewer cases than other Indian states. It was among the earliest states to deploy
                                                              modern technology tools as part of its logistics and containment measures [3, 4]. As of 17 May 2020,
                                                              Karnataka had declared 1147 diagnosed cases and 18 648 individuals under observation [5]. Among
                                                              the 1147, there were 600 active cases, 509 who had recovered and 37 who died due to COVID (a
                                                              fatality rate of 3.2%); one person died by suicide after being diagnosed.
                                                                  Researchers from several countries have used mathematical modelling to predict the trans-
                                                              mission of COVID-19 [6–8] and to identify predictors of mortality [9, 10]. However, social
                                                              network analysis (SNA) has not, thus far, been optimally utilised in the endeavour to under-
                                                              stand the characteristics of this disease.
                                                                  SNA is a technique to study the configurations of social relations between individuals or
                                                              other social units. Social network models can be used to measure variables that shape relation-
                                                              ships between social actors and the extent to which they affect health-related outcomes
                                                              [11, 12]. Researchers are exploring the use of SNA to study various facets of the COVID-19
                                                              pandemic, such as the role of public figures in communication [13], and clustering patterns
        © The Author(s), 2020. Published by                   within the broader patient network [14].
        Cambridge University Press. This is an Open               Since the pandemic is imposing a considerable burden on healthcare delivery systems, any
        Access article, distributed under the terms of        solution that can potentially aid in controlling its spread deserves serious exploration. One
        the Creative Commons Attribution-
                                                              such approach was the Karnataka healthcare task force’s extensive use of contact tracing.
        NonCommercial-NoDerivatives licence (http://
        creativecommons.org/licenses/by-nc-nd/4.0/),          We expanded on this approach by applying SNA to the corpus of contact tracing data gener-
        which permits non-commercial re-use,                  ated by the task force’s efforts. We had two main research questions in mind. First, can SNA
        distribution, and reproduction in any medium,         improve our understanding of the transmission patterns of SARS-CoV-2? Second, can SNA
        provided the original work is unaltered and is        produce actionable findings that can help in timely control of the spread of this disease?
        properly cited. The written permission of
        Cambridge University Press must be obtained
        for commercial re-use or in order to create a         Methods
        derivative work.
                                                              Study area
                                                              Karnataka is a southern state of India, consisting of 30 administrative districts with a population
                                                              of over 60 million, accounting for approximately 5% of the total Indian population. Bangalore, a
                                                              densely populated metropolis, is the capital city of Karnataka [15].

Downloaded from https://www.cambridge.org/core. IP address: 46.4.80.155, on 02 Jun 2021 at 15:50:57, subject to the Cambridge Core terms of use, available at https://www.cambridge.org/core/terms.
https://doi.org/10.1017/S095026882000223X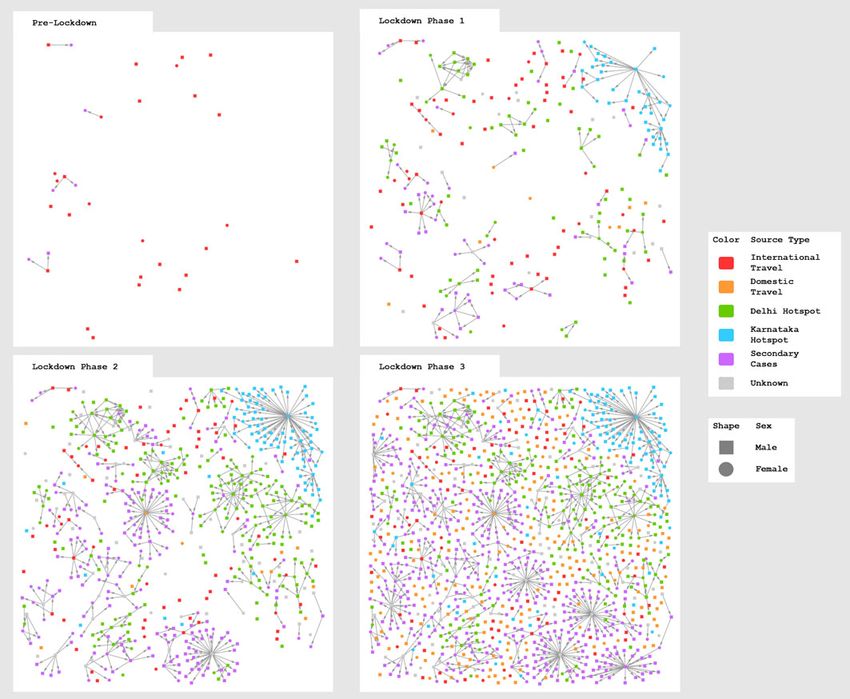
2                                                                                                                                                       S. Saraswathi et al.

       Data source                                                                                state government, the copyright policy of which indicates that
                                                                                                  material featured on the site may be reproduced free of charge
       The government of Karnataka initiated measures to control the
                                                                                                  in any format or media without requiring specific permission,
       spread of COVID-19 in early February 2020 [16]. A government
                                                                                                  subject to acknowledgement of the source [5]. The authors assert
       appointed task force formulated guidelines for quarantine and con-
                                                                                                  that all procedures contributing to this work comply with the eth-
       tact tracing. Field workers, trained to elicit travel and contact his-
                                                                                                  ical standards of the relevant national and institutional commit-
       tory, carried out telephonic and house-to-house surveys to
                                                                                                  tees, and with the Helsinki Declaration of 1975, as revised in 2008.
       identify primary and secondary contacts of positive cases. On aver-
       age, 47.4 contacts were tested for each confirmed case [17]. Data
       collected at the community level was collated by the State War                             Important definitions
       Room. Daily consolidated bulletins, containing anonymised patient
       and contact data, were uploaded by the government to the portal it                         (Also displayed in Supplementary Table S1):
       created to share information on COVID-19 [5].
           As a part of its effort to contain the outbreak, the Karnataka gov-                    Degree centrality is a measure of the number of social connec-
       ernment implemented a phased lockdown, closing shops and offices,                            tions or links that a node has. It is expressed as an integer or
       and shutting down interdistrict and interstate travel. Phase 1 of the                        count [21].
       lockdown, with the most stringent curbs on travel and socialisation,                       The indegree of a node is the number of incoming links to it from
       was from 24 March to 14 April. The second phase was from                                     source nodes and refers to the number of infectious patients
       15 April to 3 May, and the third phase was from 4 May to 17 May.                             who had confirmed contact with a given target patient.
                                                                                                  Outdegree is the number of links to target nodes from a source
                                                                                                    node and is a measure of the number of secondary cases
       Study design                                                                                 infected by a given patient. The direction of the links is denoted
       For our analysis, we downloaded the daily bulletins containing infor-                        by arrowheads at the target ends, in our visual representations.
       mation for all cases reported positive for COVID-19 from 9 March                           Betweenness centrality is a measure of the number of times a node
       to 17 May 2020, spanning the period from detection of the first case                         appears on the shortest path between other nodes [22]. It
       in the state to the end of phase-3 of the preventive lockdown. We                            reflects the role a patient plays in creating a bridge of infectious
       extracted relevant demographic and contact data from the bulletins                           transmission between patients who would not have had direct
       and created a dataset consisting of anonymised data of 1147                                  contact with each other.
       COVID-19 patients. We tabulated and summarised demographic                                 Closeness centrality is the average of the shortest path lengths from
       details such as age, district of residence and history of travel, using                      a node to every other node in the network. It is calculated as
       Microsoft Excel. We created a nodes and edges datasheet in Excel,                            the inverted sum of the distances from the node to all other
       with each node representing a patient and each edge, a confirmed                             nodes [23].
       link or contact between a source and a target patient. We imported                         We used harmonic closeness to measure closeness centrality, due to
       this dataset into Gephi version 0.9.2 and applied the following sequence                     the presence of unconnected nodes in our network. It is calculated
       of layout algorithms: Yifan Hu Proportional, Fruchterman Reingold                            as the sum of the inverted distances from a node to all other
       and No Overlap, to achieve a visual representation in which the                              nodes, instead of the reciprocal of the sum of all distances [23].
       more connected nodes are placed centrally, and ones with lower con-                        Edge betweenness is the number of the shortest paths that go
       nectivity are placed towards the periphery of the network [18].                              through an edge in a graph or network, with a high score indi-
           We wanted to combine the capabilities of two of the leading SNA                          cative of a bridge-like connection between two parts of a net-
       software tools [19], Gephi and Cytoscape, and utilise the features                           work, crucial to transmission between many pairs of nodes [24].
       missing in one but available in the other. The use of Gephi’s network                      Clustering coefficient measures the degree to which nodes in a
       analysis tools results in the nodes and edges datasheet being popu-                          graph tend to cluster together [25].
       lated with additional attribute variables. These values, such as node                      Network density is the number of existing ties between nodes,
       betweenness and edge betweenness, can then be displayed as visual                            divided by the number of possible ties [26].
       features of the network elements in other software tools such as                           Network diameter is the shortest path between the two most dis-
       Cytoscape [20]. We reformatted the data exported from Gephi to                               tant nodes in a network [25].
       make it compatible with the data model acceptable to Cytoscape ver-                        Mean path length is the average of the shortest path lengths
       sion 3.8.0, which we used to create network graphics highlighting                            between all possible node pairs [25].
       pertinent demographic characteristics of the nodes. Layout algo-                           Network component is an island of interlinked nodes that are dis-
       rithms provided in Cytoscape were applied in the following sequence:                         connected from other nodes of the network. Many networks
       Compound Spring Embedder (CoSE) and yFiles Remove Overlap,                                   consist of one large component, sometimes together with sev-
       followed by a few manual adjustments to improve clarity.                                     eral smaller ones and singleton actors [12].
           We analysed the network attributes generated by Gephi using                            Super-spreader (operational definition): Any node with an outde-
       MS Excel to explain relevant aspects of the network and its com-                             gree ⩾5 was considered a super-spreader. Individuals repre-
       ponents. We discussed the characteristics and evolution of the                               sented by these nodes would have infected five or more contacts.
       graphs and attempted to explain them in the context of facts
       and events on the ground.                                                                  Results
                                                                                                  Demography
       Ethical considerations
                                                                                                  We analysed 1147 patients of whom 742 (64.69%) were males, aged
       We have used anonymised, secondary data in the public domain,                              34.91 years on average (standard deviation 17.34 years) (Fig. 1).
       available at the COVID-19 information portal of the Karnataka                              Most of these individuals (711/1147; 61.99%) belonged to the

Downloaded from https://www.cambridge.org/core. IP address: 46.4.80.155, on 02 Jun 2021 at 15:50:57, subject to the Cambridge Core terms of use, available at https://www.cambridge.org/core/terms.
https://doi.org/10.1017/S095026882000223X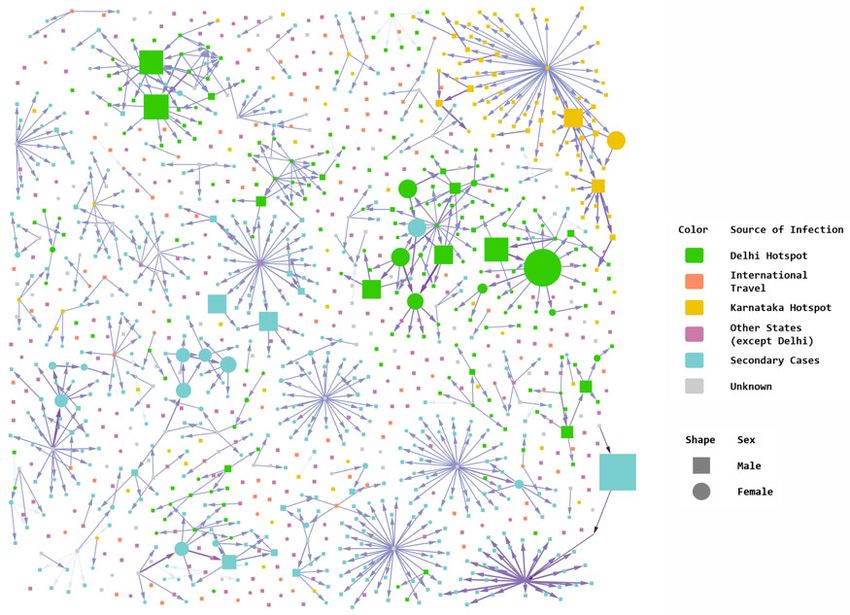
Epidemiology and Infection 3
Fig. 1. Age–sex distribution of cases and deaths. Case counts are inclusive of deaths. Death counts are also shown separately.
11–40 years age range. Most deaths, however, occurred among Of the 59 nodes with betweenness ⩾2, more than half (33, 55.93%)
older patients. We observed maximum mortality in patients aged were men, though women had a higher mean betweenness overall.
over 70 years. There were 34 patients in this age-group, of whom We noted 34 super-spreaders with outdegree ⩾5, with a cumu-
10 (29.41%) had died. Further socio-demographical details of lative outdegree of 410, and after deducting 17 duplicate edges for
these patients are available in the public domain [27]. target nodes with indegree >1, they accounted for 393 (59.81%) of
the 657 target cases.
The aggregate network graphic (Fig. 2), created using Gephi,
Network parameters
shows nodes representing patients, and components representing
We found 948 nodes with zero outdegree. The remaining 199 case clusters. The nodes are coloured according to district and
(17.35%) nodes had an outdegree range of 1–47 and were the source sized by outdegree, making the larger nodes represent individuals
of infection to 657 targets through 706 links (edges). Among the tar- who infected a greater number of targets. The largest node, located
get nodes, 36 had indegree >1 (range 2–5), implying more than one at the centre of a major component, denotes a patient from Mysuru
source. We noted equal means, but widely differing standard devia- district who infected 47 target nodes. Transmission between districts
tions for outdegree and indegree centralities. This difference is due was limited, occurring chiefly from Mysuru to Mandya, a geograph-
to the wider range of outdegree compared to indegree (Table 1). ically adjacent district. The network figure also has two large-sized
There were 490 nodes with zero indegree, of which 383 had grey nodes that represent two patients with outdegree 29 and 25,
zero outdegree. The latter were isolated nodes, with degree cen- from districts Vijayapura and Uttara Kannada, respectively.
trality value of zero. Bangalore had the highest number of cases, followed by Belagavi,
The range of betweenness centrality was 0.5–87 for 89 (7.76%) Kalaburagi and Mysuru districts (Supplementary Table S2).
nodes. The network had 143 nodes with a harmonic closeness The aggregate network contained 93 clusters of connected
centrality (HCC) of one, and 56 nodes with HCC between zero nodes (components), of which 37 components, made up of five
and one. Our network density was 0.001, network diameter was or more nodes each, had more than half of all the nodes (613,
4 and the clustering coefficient was 0.004. 53.44%) and four-fifths of the edges (611, 86.54%) concentrated
Table 2 shows that men had a higher mean outdegree (0.628, within them (Fig. 3). The distribution of these clusters by district
M vs. 0.593, F) and women, higher mean betweenness (0.573, F and type of origin is shown in Supplementary Table S3.
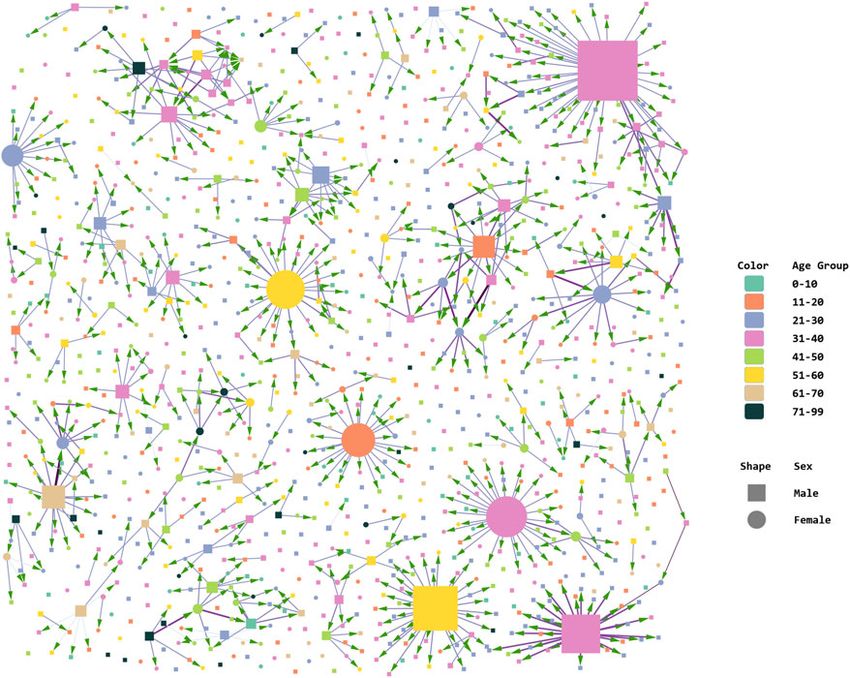
vs. 0.412, M). Figure 4 shows nodes coloured by age group and sized by out-
The 95th percentile cut-off values for outdegree and between- degree. Figure 5 shows nodes coloured by source of infection and
ness were 3 and 2, respectively. There were 77 (6.71% of 1147) sized by betweenness centrality. We have considered patients with
nodes with outdegree ⩾3, and combined, they accounted for 556 a history of travel from Delhi in a separate category as their count
(78.75% of 706) edges. More than two-thirds of these 77 nodes was comparable to the combined number of travellers from all
were men (54, 70.13%). The average HCC for the 77 nodes with other states of India. It is noteworthy that travellers from abroad
outdegree ⩾3 was 0.887, compared to 0.161 for the entire network. did not contribute to the formation of any major cluster.
Downloaded from https://www.cambridge.org/core. IP address: 46.4.80.155, on 02 Jun 2021 at 15:50:57, subject to the Cambridge Core terms of use, available at https://www.cambridge.org/core/terms.
https://doi.org/10.1017/S095026882000223X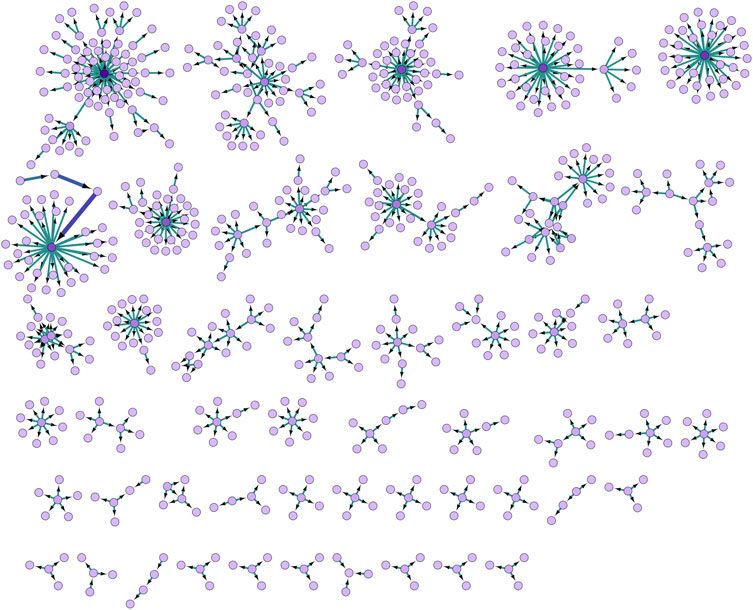
4                                                                                                                                                       S. Saraswathi et al.

       Table 1. Network parameters

                                                                                    Network                                                 C1                               C2

           Nodes                                                                     1147                                                   75                                45
           Edges                                                                      706                                                   76                                50
           Node attributes                                           Range                             Mean (S.D.)                                    Range (mean)
           Outdegree                                                    0–47                           0.616 (2.78)                   0–47 (1.013)                      0–15 (1.111)
           Indegree                                                      0–5                           0.616 (0.60)                     0–2 (1.013)                      0–3 (1.111)
           Degree                                                       0–47                           1.231 (2.79)                   1–47 (2.027)                      1–15 (2.222)
           Betweenness                                                  0–87                           0.469 (3.69)                     0–9 (0.426)                     0–12 (1.133)
           Harmonic closeness                                    1 (n = 143)
                                                         0 < HC < 1 (n = 56)                           0.161 (0.35)                     0–1 (0.231)                      0–1 (0.263)
                                                                 0 (n = 949)
           Eccentricity                                                  0–4                           0.242 (0.61)                     0–3 (0.307)                      0–3 (0.4)
           Network attributes                                                                                         Value
           Diameter                                                         4                                                                3                                 3
           Radius                                                           1                                                                1                                 1
           Mean path length                                                 1.623                                                            1.321                             1.314
           Mean no. of neighbours                                           1.231                                                            2.027                             2.222
           Density                                                          0.001                                                            0.025                             0.014
           Clustering coefficient                                           0.004                                                            0.011                             0.000
       C1, largest component; C2, second-largest component; S.D., standard deviation; HC, harmonic closeness.

       Table 2. Mean outdegree and betweenness by sex and age group

                                                               Mean outdegree                                                               Mean betweenness

           Age groups                   Women                       Men                       Combined                   Women                       Men                  Combined

           0–10                           0.000                     0.140                      0.079                      0.000                   0.233                      0.132
           11–20                          0.463                     0.368                      0.407                      0.179                   0.242                      0.216
           21–30                          0.655                     0.289                      0.396                      1.561                   0.095                      0.527
           31–40                          0.500                     0.994                      0.822                      0.114                   1.159                      0.795
           41–50                          0.870                     0.480                      0.601                      0.783                   0.216                      0.392
           51–60                          1.158                     1.145                      1.150                      0.474                   0.210                      0.310
           61–70                          0.467                     1.083                      0.846                      0.033                   0.406                      0.263
           71–99                          0.667                     1.263                      1.000                      1.572                   0.000                      0.694
           Combined                       0.593                     0.628                      0.616                      0.573                   0.412                      0.469

           Comparing Figures 4 (nodes sized by outdegree) and 5 (nodes                              high outdegree who spread the infection to many contacts.
       sized by betweenness), we find that in clusters with nodes that had                          However, secondary transmission from those contacts was lim-
       multiple interconnections, relatively low outdegree and high                                 ited. This cluster is star shaped. The second-largest component
       betweenness, the key nodes were females. This indicates that                                 resembles a spiderweb with multiple interconnected nodes and
       women played a significant bridging role in these clusters. This                             many female actors. This cluster was in Belagavi, and its network
       differs from clusters with edges radiating from a central node                               density was nearly twice that of the largest cluster (0.025 vs.
       with high outdegree and low betweenness, where typically, a                                  0.014), with a shorter average path length (1.314 vs. 1.321).
       young male was the nidus. The largest and second-largest compo-
       nents illustrate this difference in transmission (Fig. 6). The largest
       component had 75 nodes and 76 edges, and the second-largest                                  Dynamic evolution of the network
       component had 45 nodes and 50 edges. The largest cluster origi-                              Figure 7 shows how the network began with the first detected
       nated in the district of Mysuru; its source node was a male with                             cases and how it expanded in each phase of the lockdown. We

Downloaded from https://www.cambridge.org/core. IP address: 46.4.80.155, on 02 Jun 2021 at 15:50:57, subject to the Cambridge Core terms of use, available at https://www.cambridge.org/core/terms.
https://doi.org/10.1017/S095026882000223X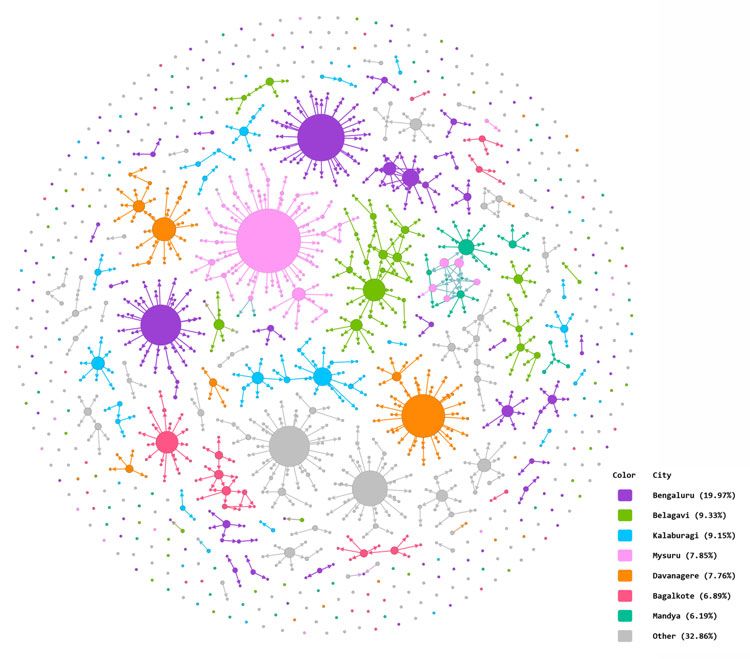
Epidemiology and Infection                                                                                                                                                     5

        Fig. 2. Aggregate network graphic created in Gephi. Arrowheads indicate direction of transmission from source node to target node. Node size determined by
        outdegree. Edges inherit colour from parent nodes.

        Fig. 3. Major network components organised by size, created in Cytoscape. Arrowheads indicate direction of transmission from source node to target node. Edge
        betweenness determines the thickness and colour intensity of the edges.

Downloaded from https://www.cambridge.org/core. IP address: 46.4.80.155, on 02 Jun 2021 at 15:50:57, subject to the Cambridge Core terms of use, available at https://www.cambridge.org/core/terms.
https://doi.org/10.1017/S095026882000223X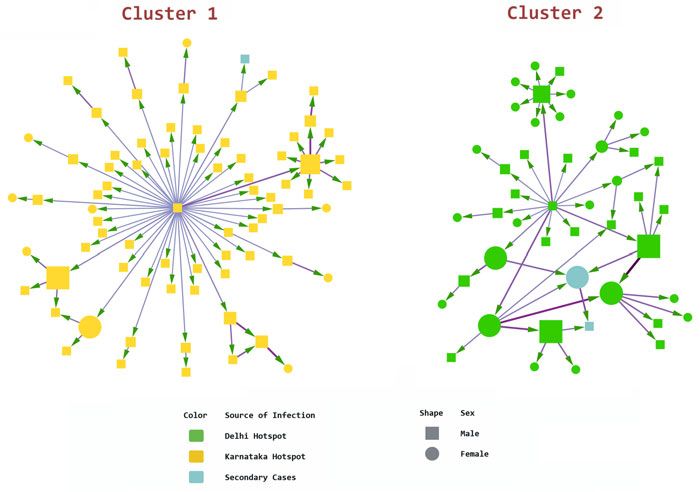
6                                                                                                                                                       S. Saraswathi et al.

       Fig. 4. Age–sex attributes of nodes and clusters, created in Cytoscape. Node size determined by outdegree. Arrowheads indicate direction of transmission from
       source node to target node. Edge betweenness determines the thickness and colour intensity of the edges.

       see that in the initial, pre-lockdown phase, the cases were mostly                         from the empirical contact tracing data, and derive insights into
       isolated nodes with minimal occurrence of secondary cases. They                            disease transmission therefrom.
       are all travellers returning from abroad (red nodes, source type                               Our study reveals that most cases of COVID-19 in Karnataka
       ‘International Travel’). By the time the first and strictest phase                         were young and middle-aged men. Deaths, however, occurred
       of the lockdown (24 March to 14 April) was declared, however,                              overwhelmingly among elderly patients. The age and sex profile
       cluster formation had already begun and most of the new cases                              of our study set matches nationwide surveillance data from
       had a history of travel to Delhi or contact with returnees from                            India, with median age and age-distribution close to our sample,
       Delhi (green nodes, source type ‘Delhi Hotspot’). The origin of                            and a similar high attack rate in males [17].
       the largest cluster, which was labelled as a Karnataka (in-state)                              Bangalore, the capital of Karnataka, is a densely populated
       hotspot (blue nodes), could not be traced either to travel or                              metropolis, housing one-sixth of Karnataka’s population in 1%
       to contact with any known positive case. Clusters continued to                             of its area [15, 28]. The city airport is a major transit point for
       form and grow during the second phase of the lockdown (15                                  domestic and international travellers. These factors may explain
       April to 3 May). However, due to continuing curbs on travel                                Bangalore’s relatively heavy burden of COVID-19 cases (229/
       and transportation, the fresh cases were mostly found among con-                           1147). Despite accounting for nearly a fifth of the state’s caseload,
       tacts of existing cases. In the beginning of May 2020, the govern-                         however, Bangalore did not have notably large or numerous clus-
       ment arranged special transportation facilities by road and rail, so                       ters compared to other districts (Fig. 2 and Supplementary Tables
       that migrant labourers in distress could return to their home                              S2 and S3). Most of the cases detected here were isolated nodes.
       states. This resulted in many new cases with source traced to tra-                         Bangalore’s low transmission may have been due to the disci-
       vel from out of state (orange nodes) in phase 3 of the lockdown (4                         plined observance of lockdown measures, and rigorous con-
       May to 17 May). We have shown the weekly increase in cases in                              tact tracing and quarantine activities by its healthcare workforce
       the form of a line graph in Supplementary Figure S1.                                       [29, 30].
                                                                                                      The presence of two large nodes (where size denotes outde-
                                                                                                  gree) in districts that had a minor contribution to the total case-
       Discussion
                                                                                                  load (Fig. 2) points to the risk of cluster formation even in
       While we have performed a basic conventional analysis of the                               relatively unaffected areas if, for example, physical distancing
       data, our chief objectives were to create social network graphics                          measures are not followed scrupulously.

Downloaded from https://www.cambridge.org/core. IP address: 46.4.80.155, on 02 Jun 2021 at 15:50:57, subject to the Cambridge Core terms of use, available at https://www.cambridge.org/core/terms.
https://doi.org/10.1017/S095026882000223X
Epidemiology and Infection                                                                                                                                                     7

        Fig. 5. Network analysis by sources of infection (Cytoscape). Node size determined by betweenness. Arrowheads indicate direction of transmission from source
        node to target node. Edge betweenness determines the thickness and colour intensity of the edges.

                                                                                                                                Fig. 6. Comparing the two largest components
                                                                                                                                (Cytoscape). Node size determined by betweenness.
                                                                                                                                Arrowheads indicate direction of transmission from
                                                                                                                                source node to target node. Edge betweenness deter-
                                                                                                                                mines the thickness and colour intensity of the edges.

            Shortly after the World Health Organization confirmed the                              travellers. Conversely, we noted several clusters formed by people
        novel coronavirus as the cause of the outbreak in China [31], pub-                         with a history of travel to the national capital, Delhi (Fig. 5 and
        lic health authorities started precautionary screening and quaran-                         Supplementary Tables S2 and S3). By 19 April 2020, the entire
        tine of passengers arriving from areas of concern at Bangalore                             city of Delhi had been declared a COVID-19 hotspot [33] in
        International Airport [32]. These early steps may explain why                              the wake of a mass religious gathering that was found to be linked
        we found no major clusters originating from international                                  to nearly a third of the country’s caseload earlier in the month

Downloaded from https://www.cambridge.org/core. IP address: 46.4.80.155, on 02 Jun 2021 at 15:50:57, subject to the Cambridge Core terms of use, available at https://www.cambridge.org/core/terms.
https://doi.org/10.1017/S095026882000223X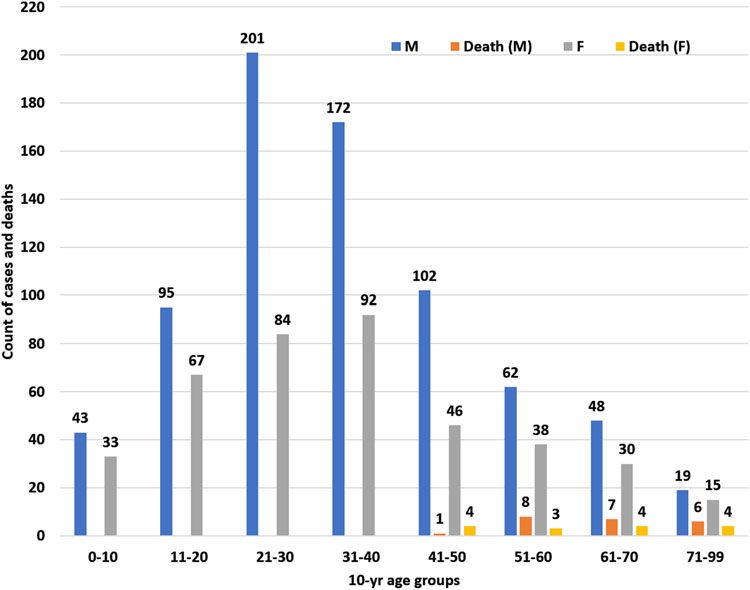
8                                                                                                                                                       S. Saraswathi et al.

       Fig. 7. Evolution of the network at each phase of lockdown. Node colour denotes infection source type. Arrowheads indicate direction of transmission from source
       node to target node.

       [34]. Clusters of cases that originated from Delhi tended to be                            analysis of detailed contact tracing data from Hunan, China,
       closely interconnected, with women playing an active transmis-                             traced 80% of secondary cases back to 14% of infections [36].
       sion role. This could reflect close community ties between these                           Network analysis of COVID-19 patients in Henan, China, [14]
       individuals, or residence in underprivileged areas where strict                            revealed a non-uniform pattern of clustering (208/1105 patients
       physical distancing may not have been observed.                                            in clusters) with a skewed distribution of patients in different cit-
           Most of the clusters in our network had a man with high out-                           ies. The Henan study also indicated a strong correlation of con-
       degree as the nidus. Women, however, played an important role in                           firmed cases with travel to Wuhan (the epicentre of the
       transmission by bridging multiple nodes within clusters even                               pandemic), which corresponds to our observation that a fair pro-
       though men outnumbered women in the 95th percentile region                                 portion (17.44%) of the Karnataka patients had travelled to Delhi.
       of betweenness. Further study is warranted into the social and                             These similarities indicate that our findings may be generalisable
       behavioural characteristics of men and women that drive these                              across populations.
       differences.                                                                                   Researchers have analysed network properties from different
           The low density of our network, the presence of 948 nodes                              perspectives, depending on the type and complexity of networks.
       with zero outdegree, and the fact that only 34 source cases had                            Entropy-based analysis has been used to identify influential nodes
       infected close to two-thirds of all target cases, indicate that com-                       using local information dimensionality [37]. Fractal dimensions
       munity transmission was negligible. A similar transmission pat-                            are being explored to determine the vulnerability of complex net-
       tern was reported from Shenzhen, China, where 8.9% of the                                  works [38]. Mathematical modelling has been used to simulate
       cases had caused 80% of all infections [35]. Another recent                                and predict transmission dynamics in various types of networks

Downloaded from https://www.cambridge.org/core. IP address: 46.4.80.155, on 02 Jun 2021 at 15:50:57, subject to the Cambridge Core terms of use, available at https://www.cambridge.org/core/terms.
https://doi.org/10.1017/S095026882000223X
Epidemiology and Infection 9
[39]. These models are informed, and their predictions are influ- Supplementary material. The supplementary material for this article can
enced, by the types of data processing decisions that are made be found at https://doi.org/10.1017/S095026882000223X.
prior to collecting and analysing the contact data [40]. A dynamic
Acknowledgements. We thank the Government of Karnataka for their
simulation of this nature, such as was done by the Hunan punctual and detailed bulletins summarising data of COVID-19 cases in the
researchers [36], would require data at a granular level, including state. We are deeply grateful to the grassroots health workers who selflessly
educational, occupational and socioeconomic status of patients, carried out the contact tracing surveys that made our analysis possible. We
their mobility patterns, severity of infection, and the duration extend our sincere thanks to the reviewers and the editor for their valuable
and intensity of contact events. This information was unavailable suggestions and support.
in the anonymised secondary data that we used. The data avail-
Author contributions.
able to us allowed only a limited dynamic analysis to be done.
S. Saraswathi: conceptualisation, study design, data retrieval from government bulletins;
A. Mukhopadhyay and H. Shah: data analysis; all authors: writing, editing, review and
final approval of manuscript.
Limitations
Financial support. We received no financial support for this study.
Our SNA findings may not universally reflect field realities. Some
findings such as eccentricity and mean path length are theoretical Conflict of interest. We have no conflict of interest to declare.
constructs computed by software algorithms, but in practice, these
Data availability statement. Our datasets were constructed using contact
metrics remain indeterminate as our network had very few inter- tracing details available in the daily bulletins released online by the
district connections and many isolated nodes and components. Government of Karnataka. The complete archives of these bulletins can be
Our dataset included many patients with contact history still accessed at the COVID-19 portal at the address https://covid19.karnataka.
under investigation at the time of analysis. We were not able to gov.in/govt_bulletin/en under the heading ‘Health Department Bulletins’.
analyse the role of type and duration of contact, as these data
were unavailable for many patients. Although we have attempted
to faithfully reproduce all the information that we could extract References
from the daily bulletins, the quality of our data is necessarily lim- 1. Cheong KH and Jones MC (2020) Introducing the 21st century’s
ited by the constraints of secondary data sources. New four horsemen of the coronapocalypse. BioEssays 42, 2000063.
doi:10.1002/bies.202000063.
2. India Today. Coronavirus in India: Tracking country’s first 50 COVID-19
Conclusion cases; what numbers tell. https://www.indiatoday.in/india/story/corona-
virus-in-india-tracking-country-s-first-50-covid-19-cases-what-numbers-
Our conventional analysis indicates that mortality due to tell-1654468-2020-03-12 (Accessed 26 August 2020).
COVID-19 is highest among senior citizens. We recommend 3. The New Indian Express. Karnataka fares well in war against COVID-19.
that the elderly should be advised strict physical distancing, and https://www.newindianexpress.com/states/karnataka/2020/apr/14/karnataka-
older patients from rural or underserved areas should be pre- fares-well-in-war-against-covid-19-2129751.html (Accessed 17 May 2020).
emptively transferred to tertiary centres with intensive care 4. The Times of India. New tech solutions aiding Karnataka’s battle against
facilities. This may help in early detection and treatment of com- COVID-19. https://timesofindia.indiatimes.com/city/bengaluru/new-tech-
plications, mitigating their mortality risk. solutions-aiding-karnatakas-battle-against-covid-19/articleshow/75782619.
cms (Accessed 17 May 2020).
The findings from our network analysis suggest that geograph-
5. Health department bulletin – COVID-19 information portal. https://
ical, demographical and community characteristics could covid19.karnataka.gov.in/new-page/Health%20Department%20Bulletin/en
influence the spread of COVID-19. Gender influences the morph- (Accessed 18 May 2020).
ology of clusters, with men seeding the clusters and women 6. Ndaïrou F et al. (2020) Mathematical modeling of COVID-19 transmis-
propagating them. sion dynamics with a case study of Wuhan. Chaos, Solitons & Fractals 135,
Our results also highlight the need for recording, on an 109846.
ongoing basis, high granularity contact tracing data in a uniform 7. Yang HM et al. (2020) Mathematical model describing CoViD-19 in São
format. We believe that outbreak control task forces should be Paulo, Brazil – evaluating isolation as control mechanism and forecasting
provided with requisite software and training in SNA techniques, epidemiological scenarios of release. Epidemiology and Infection 148, e155.
8. Singh A, Dey J and Bhardwaj S (2020) Is this the beginning or the end of
and should directly receive contact tracing information from
COVID-19 outbreak in India? A data driven mathematical model-based
workers in the field. This would enable SNA in real time with
analysis. medRxiv. https://doi.org/10.1101/2020.04.27.20081422.
the ability to visualise and flag evolving networks with alacrity. 9. Ma X et al. (2020) Development and validation of prognosis model of mor-
It would also help pinpoint nodes with high outdegree, between- tality risk in patients with COVID-19. Epidemiology and Infection 148, e168.
ness and closeness scores, which imply an active role in the trans- 10. Sousa GJB et al. (2020) Mortality and survival of COVID-19.
mission and bridging of infection. Real-time SNA could thus help Epidemiology and Infection 148, e123.
identify the super-spreaders responsible for a large proportion of 11. Newman MEJ (2003) The structure and function of complex networks.
transmission. In particular, close tracking of betweenness scores SIAM Review 45, 167–256.
would allow detection of individuals who might be missed by 12. O’Malley AJ and Marsden PV (2008) The analysis of social networks.
conventional tracing methods. These actors may not themselves Health Services & Outcomes Research Methodology 8, 222–269.
spread the infection to many contacts, but their bridging charac- 13. Yum S (2020) Social network analysis for coronavirus (COVID-19) in the
United States. Social Science Quarterly 101, 1642–1647. doi: 10.1111/
teristic accelerates transmission in the community. Public health
ssqu.12808.
authorities could prioritise these individuals and clusters for 14. Wang P et al. (2020) Statistical and network analysis of 1212 COVID-19
immediate and rigorous containment, and formulate control mea- patients in Henan, China. International Journal of Infectious Diseases 95,
sures tailored to the network characteristics of each locality. These 391–398.
measures could help minimise resource outlay, and potentially 15. Karnataka Government. https://karnataka.gov.in/new-page/Karnataka%
facilitate a significant reduction in the spread of COVID-19. 20at%20a%20Glance/en (Accessed 26 August 2020).
Downloaded from https://www.cambridge.org/core. IP address: 46.4.80.155, on 02 Jun 2021 at 15:50:57, subject to the Cambridge Core terms of use, available at https://www.cambridge.org/core/terms.
https://doi.org/10.1017/S095026882000223X10 S. Saraswathi et al.
16. Government circulars – COVID-19 information portal. https://covid19. 29. The Times of India. Welcome indicator: Only 2% of COVID-19 beds
karnataka.gov.in/new-page/Government%20Circulars/en (Accessed 26 occupied in Karnataka. https://timesofindia.indiatimes.com/city/benga-
August 2020). luru/welcome-indicator-only-2-of-covid-19-beds-occupied-in-karnataka/
17. ICMR COVID Study Group et al. (2020) Laboratory surveillance for articleshow/75653647.cms (Accessed 2 June 2020).
SARS-CoV-2 in India: performance of testing & descriptive epidemiology 30. News18 (2020) Trace, test and treat: armed with 3ts, how Bengaluru is on
of detected COVID-19, January 22–April 30, 2020. Indian Journal of course to flattening the curve of COVID-19. https://www.news18.com/
Medical Research 151, 424–437. doi: 10.4103/ijmr.IJMR_1896_20. news/india/trace-test-and-treat-armed-with-3ts-how-bengaluru-is-on-course-
18. Bastian M, Heymann S and Jacomy M (2009) Gephi: an open source soft- to-flattening-the-curve-of-covid-19-2619117.html (Accessed 2 June 2020).
ware for exploring and manipulating networks. International AAAI 31. World Health Organization. WHO statement regarding cluster of pneu-
Conference on Web and Social Media; Third International AAAI Conference monia cases in Wuhan, China. https://www.who.int/china/news/detail/09-
on Weblogs and Social Media. Published online: 2009. https://www.aaai.org/ 01-2020-who-statement-regarding-cluster-of-pneumonia-cases-in-wuhan-
ocs/index.php/ICWSM/09/paper/view/154 (Accessed 31 May 2020). china (Accessed 3 June 2020).
19. Bhatia R (2018) Top 7 Network Analysis Tools For Data Visualisation. 32. The News Minute. Screening begins at Bengaluru airport over Coronavirus
Analytics India Magazine. https://analyticsindiamag.com/top-7-network- scare. https://www.thenewsminute.com/article/screening-begins-bengaluru-
analysis-tools-for-data-visualisation/ (Accessed 18 May 2020). airport-over-coronavirus-scare-116502 (Accessed 3 June 2020).
20. Shannon P et al. (2003) Cytoscape: a software environment for integrated 33. Business Insider. No lockdown relaxation in Delhi as all 11 districts
models of biomolecular interaction networks. Genome Research 13, 2498– are coronavirus hotspots. https://www.businessinsider.in/india/news/no-
2504. lockdown-relaxation-in-delhi-as-all-11-districts-are-coronavirus-hotspots/
21. Degree Centrality – an overview, ScienceDirect Topics. https://www. articleshow/75232679.cms (Accessed 2 June 2020).
sciencedirect.com/topics/computer-science/degree-centrality (Accessed 34. The Times of India. 1,445 cases linked to Tablighi Jamaat event; total
14 May 2020). cases rise to 4,281, death toll 111. https://timesofindia.indiatimes.com/
22. Betweenness Centrality – an overview, ScienceDirect Topics. https://www. india/1445-cases-linked-to-tablighi-jamaat-event-total-cases-rise-to-4067-
sciencedirect.com/topics/computer-science/betweenness-centrality (Accessed death-toll-109/articleshow/75010939.cms (Accessed 2 June 2020).
14 May 2020). 35. Bi Q et al. (2020) Epidemiology and transmission of COVID-19 in 391
23. Rochat Y. Closeness centrality extended to unconnected graphs: the har- cases and 1286 of their close contacts in Shenzhen, China: a retrospective
monic centrality index. https://core.ac.uk/download/pdf/148005918.pdf cohort study. The Lancet Infectious Diseases 20, 911–919. doi: 10.1016/
(Accessed 30 August 2020). S1473-3099(20)30287-5.
24. Girvan M and Newman MEJ (2002) Community structure in social and 36. Sun K et al. (2020) Transmission heterogeneities, kinetics, and controllability
biological networks. Proceedings of the National Academy of Sciences of the of SARS-CoV-2. medRxiv. https://doi.org/10.1101/2020.08.09.20171132.
United States of America 99, 7821–7826. 37. Wen T and Deng Y (2020) Identification of influencers in complex net-
25. Ouyang F and Reilly C. Terminology – social network analysis. https://sites. works by local information dimensionality. Information Sciences 512,
google.com/a/umn.edu/social-network-analysis/terminology (Accessed 3 549–562.
June 2020). 38. Wen T, Song M and Jiang W (2018) Evaluating topological vulnerability
26. Hanneman RA and Riddle M. Introduction to social network methods: based on fuzzy fractal dimension. International Journal of Fuzzy Systems
chapter 8: more properties of networks and actors. https://faculty.ucr. 20, 1956–1967.
edu/∼hanneman/nettext/C8_Embedding.html (Accessed 3 June 2020). 39. Wang C et al. (2017) A rumor spreading model based on information
27. Karnataka COVID+ analysis: 17 May 2020. https://covid19.karnataka.gov.in/ entropy. Scientific Reports 7, 9615.
storage/pdf-files/GOK_Scorecard_V3%20(1).pdf (Accessed 28 August 2020). 40. Dawson DE, et al. (2019) Transmission on empirical dynamic con-
28. Karnataka government. https://karnataka.gov.in/district/en (Accessed 26 tact networks is influenced by data processing decisions. Epidemics 26,
August 2020). 32–42.
Downloaded from https://www.cambridge.org/core. IP address: 46.4.80.155, on 02 Jun 2021 at 15:50:57, subject to the Cambridge Core terms of use, available at https://www.cambridge.org/core/terms.
https://doi.org/10.1017/S095026882000223XYou can also read