The air we breathe The state of Minnesota's air quality 2019
←
→
Page content transcription
If your browser does not render page correctly, please read the page content below

The air
we breathe
   The state of
   Minnesota’s
   air quality 2019
Legislative charge
The Minnesota Pollution Control Agency has a statutory requirement (Minn. Stat. §115D.15 and
§116.925) to report to the Minnesota Legislature biennially on the status of toxic air contaminants
and the MPCA’s strategies to reduce the emissions of air pollutants. The MPCA uses this report as an
occasion to discuss the most pressing outdoor air quality issues facing Minnesota and to explore the
opportunities available for emission reductions.

Authors                                     Estimated cost of preparing this report
Amanda Jarrett Smith                        (as required by Minn. Stat. § 3.197)
Ralph Pribble
Fawkes Steinwand                             Total staff time: 558 hrs.      $22,320
                                             Production/duplication            $420
                                             Total                           $22,740
Editing and graphic design                  The MPCA is reducing printing and mailing costs by
Scott Andre                                 using the Internet to distribute reports and informa-
Tanja Michels                               tion to wider audience. Visit our website for more
Risikat Adesaogun                           information.

                                            MPCA reports are printed on 100% post-consumer
                                            recycled content paper manufactured without chlo-
                                            rine or chlorine derivatives.

Contributors/acknowledgements
David Bael                     Azra Kovacevic
Hassan Bouchareb               Dorian Kvale
Angela Bourdaghs               Margaret McCourtney
Ned Brooks                     Michael Nelson
Anne Claflin                   Rebecca Place
Eric David                     Jessie Shmool (MDH)
Daniel Dix                     Rocky Sisk
Kristie Ellickson              Mark Sulzbach
Brandon Finke                  Monika Vadali
Anne Jackson

Contact
Todd Biewen
Acting Division Director,
Environmental Analysis and Outcomes
651-757-2228
todd.biewen@state.mn.us
                                                                                                lraq-1sy19

                                             The air we breathe: The state of Minnesota’s air quality | 2019
Executive Summary                                                                           i

Introduction                                                                              4

Why we care about air quality                                                             5
Clean air equals healthier people, ecosystems, and economy                                  5

Air pollution doesn’t affect everyone equally                                             8
Air pollution and environmental justice                                                     8

Understanding air quality in communities                                                   11

What is the state of Minnesota’s air quality?                                            12
Meeting the national air quality standards                                                 12

“Bad air” days                                                                             15

Long-term goals for air quality                                                          17
Collaborating to reduce pollution                                                        18
Clean Air Minnesota                                                                        18

Responding to federal regulatory rollbacks                                                 19

Working across sectors to reduce pollution                                               19
Air pollution from vehicles and heavy-duty diesel equipment                               20

Air pollution from everyday, neighborhood sources                                         23

Air pollution from industrial facilities                                                  24

Conclusions                                                                             26
Appendix A: Mercury Emissions                                                           27

                               The air we breathe: The state of Minnesota’s air quality | 2019
SUMMARY
              Report to the
              Legislature

                                                            The air we breathe:
                                                            Minnesota’s air quality 2019
                                                            Minnesota’s air quality is good overall, but it is not the same in all parts of the state
              Air pollution emissions in                    and doesn’t affect all Minnesotans equally. Statewide, our air meets all federal
              Minnesota have declined sig-
              nificantly in the past 20 years,              standards and nearly all health benchmarks. Overall pollution levels have been
              while the state’s economy has                 going down and this trend is expected to continue. But people in some areas either
              continued to grow.                            experience pollution levels that, while within federal standards, are nonetheless
                                                                                                                      high enough to worsen
                                                                                                                      serious health conditions or
                            60%
                                                                                 Real gross state product
                                                                                                                      are exposed to pollutants that
                                                                                                                      don’t have federal standards.
                                                                                                         Economic   The elderly, children, and
                            30%                                                                          activity
Percent change since 1997

                                                                                  Vehicle miles travelled           people with chronic heart
                                                                                  Population                        and lung conditions are more
                                                                                  Energy consumption                vulnerable to the effects of air
                             0%
                                                                                                                    pollution. In addition, besides
                                                                                  Greenhouse gases                  some people experiencing
                                                                                                                    higher levels of pollution
                                                                                                                    exposure than others, health
                                                                                                          Emissions
                            -30%                                                                                    inequities make some popu-
                                                                                                                    lations more susceptible to
                                                                                 Aggregate emissions                its harmful effects. People
                                                                                 (NOx, SO2, VOC, PM2.5)             of color, indigenous people,
                            -60%                                                                                    and lower-income individuals
                                   1997    2001    2005     2009    2013    2017
                                                                                                                    often do not have adequate
                                                                                                                    access to the conditions that
                                                            support healthy living, including quality schooling, healthcare, and clean surround-
                                                            ings. When equitable access to these is limited, poor air quality often contributes to,
                                                            and worsens, health disparities.
                                      Real gross state product
                                                        The MPCA monitors regional air quality to determine if Minnesota’s air complies
                                      Vehicle miles traveled
                                                        with national standards. In recent years, however, Minnesotans have become more
                                      Energy consumption
                                      Population             i                         The air we breathe: The state of Minnesota’s air quality | 2019

                                      Aggregate emissions (NOx, SO2, VOC, PM2.5)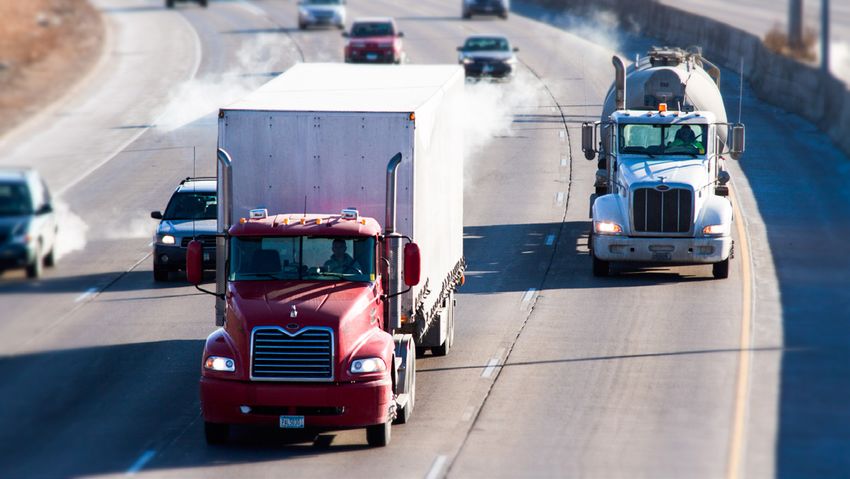
and more interested in understanding air
  Air quality risk                                                                       quality on the community scale – what’s in
 These
 These communities
        communities are are more
                            more likely
                                  likely to
                                         to be
                                            be near
                                               near                                      the air in the areas where they live, work,
 higher
 higher levels
         levels of
                of air
                   air pollution.
                       pollution.                                                        and play. Special monitoring projects at the
                                                         Communities
                                                                                         MPCA are helping us get more information
                                                         of color and
 Statewide                    Low-income                 indigenous                      about air quality at the community level.
 average                      communities                communities
                                                                                         The MPCA also forecasts air quality to help
                                                                                         Minnesotans who are vulnerable to air pol-
                                                                                         lution plan to protect their health on days
               32%                          46%                          91%
               are above                  are above                     are above        when air quality is poor. In recent years,
          risk guidelines            risk guidelines               risk guidelines
                                                                                         Minnesota has seen more “bad air” days
                                                                                         caused by smoke from wildfires outside of
                                                                                         the state. This trend is likely to continue as
                                                                                         climate change worsens heat and drought
                                                                                         in North America.

                                     Minnesota has cut emissions significantly in the past 30 years, especially from large
                                     facilities like power plants. Today, most of our air pollution comes from vehicles and
                                     smaller, neighborhood sources such as home heating, dry cleaners, and backyard
                                     fires. These sources are difficult to regulate, so voluntary actions by businesses and
                                     individuals will be key to further improving air quality.

                                             On-road vehicles 24%                                Small and
                                             Cars and trucks, etc.                               widespread sources
        20%                 24%
                                             Off-road vehicles and equipment 20%                 are the largest
                                             Construction, agriculture, and yard, etc.           portion of overall air
       21%                                   Neighborhood sources 35%                            pollution emissions
                            35%              Dry cleaners, home heating, backyard fires, etc.    in Minnesota.
                                             Industrial facilities 21%
                                             Factories, power plants, etc.                       Includes PM2.5, SO2, NOX, VOCs.
                                                                                                 Source: MPCA 2014 emissions inventory

                                     The national Volkswagen emissions settlement, which provides Minnesota $47
                                     million over 10 years to reduce diesel pollution, offers new opportunities for volun-
                                     tary actions. The Volkswagen settlement money will be used to replace older, dirty
                                     diesel vehicles and equipment with new models that are much cleaner, and will also
                                     help install electric-vehicle charging stations across the state. With about half our
                                     air pollution coming from vehicles and other mobile sources, more effort will need
                                     to be directed toward supporting smart transportation planning and adopting new,
                                     cleaner technologies.

                                     As the challenges of improving Minnesota’s air quality continue to evolve, the
Contact                              MPCA will continue to adapt our work to create and take advantage of new oppor-
                                     tunities to reduce pollution, understand its effects, and better protect the health of
Todd Biewen                          all Minnesotans.
Acting Division Director,
Environmental Analysis and Outcomes
651-757-2228
todd.biewen@state.mn.us             ii                                                    https://www.pca.state.mn.us/air-we-breathe
                                                                                          https://www.pca.state.mn.us/air-we-breathe
Introduction
Minnesota’s air quality is continuously evolving, as are the methods the Minnesota
Pollution Control Agency (MPCA) uses to understand and improve our air. Min-
nesota’s air is generally good and statewide emissions are decreasing; however, air
quality is not the same in all parts of the state. More and more, Minnesotans want to
know about the air quality where they live, work, and play, and how it impacts their
health. Many Minnesotans are adopting new clean technologies, like solar energy
for their homes and new vehicles and equipment that produce far less pollution –
protecting the health of their families and neighbors. You can learn about the state
of the air and some of our newest initiatives in this report:

•   Minnesotans are excited about clean vehicle technology and have demonstrat-
    ed enormous demand for funds to replace older, polluting diesel vehicles with
    Volkswagen settlement funds. (page 21)

•   Minnesotans are embracing electric vehicle technology that reduces pollution.
    The MPCA and its partners are building a network of charging stations to help
    Minnesotans travel around the state in electric vehicles. (page 22)

•   The MPCA is monitoring neighborhood-level air pollution and conducting anal-
    yses to understand how air pollution disproportionately impacts some people in
    our state. For example, the MPCA is working on a project to place an air quality
    monitor in each ZIP code in Minneapolis and St. Paul. (page 11)

    4                        The air we breathe: The state of Minnesota’s air quality | 2019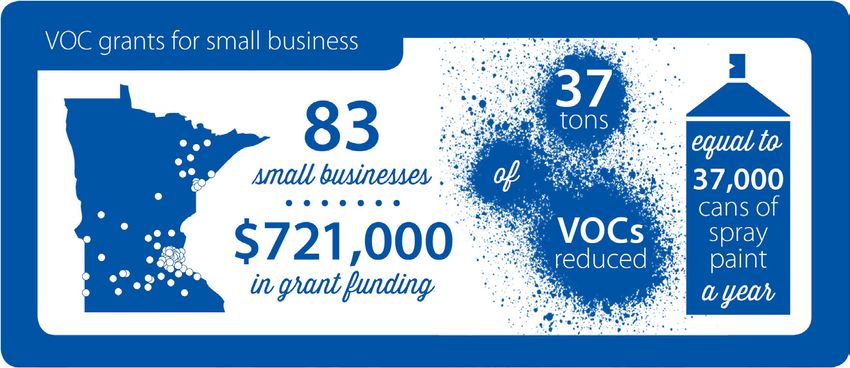
Why we care about air quality
                                Clean air means healthier people, ecosystems,
                                and economy
                                Clean air helps make everyone healthier. It supports the ecosystems that Minneso-
                                tans value, and provides the foundation for a growing economy.
Forecasting air
quality                         Air pollution can worsen many health conditions. Minnesota’s air currently meets
                                all federal health standards, but even levels of air pollution that meet the stan-
Air quality forecasts           dards can affect people’s health. Having good air quality means fewer missed work
are important to help           and school days and less money spent on air pollution-related illness. The MPCA
Minnesotans who are             estimates the overall economic impact of health effects related to air pollution in
sensitive to air pollution      Minnesota exceeds $30 billion per year.
plan ahead to protect
their health on bad air         Air pollution and your health
days. MPCA forecasts            Fine particles and ground-level ozone (often called smog) are widespread pollut-
air quality for the whole       ants linked to health effects.
state. You can check            Fine particles (PM2.5)                                  Ground-level ozone
the daily forecasts and         pollution can cause:                                    pollution can cause:
sign up for the MN Air          • Shortness of breath                                  • Difficulty breathing
app at www.pca.state.           • Wheezing, coughing                                     deeply
mn.us/AQI.                      • Chest pain                                           • Shortness of breath
                                • Fatigue                                              • Sore throat
                                                                                        • Wheezing, coughing
                                Fine particles can make
                                                                                        • Fatigue
                                these conditions worse:
                                • C ardiovascular and                                  Ozone can make these
                                  heart disease                                         conditions worse:
                                • Asthma and COPD
                                                                                        • A sthma and COPD
                                                                                        • Emphysema

     New greenhouse gas emissions report
     Minnesota’s climate is changing rapidly, and these changes – driven largely by human-caused emissions of
     greenhouse gases (GHGs) – are affecting our health, well-being, ways of life, and natural resources. Climate
     change may increase harmful pollutants in our air. While Minnesota’s GHG emissions are declining relative
     to 2005 levels, we missed the 15% emissions reduction goal set for 2015 by the Minnesota Legislature under
     the Next Generation Energy Act. To learn more about GHG emissions and Minnesota’s work to achieve our
     reduction goals, explore the MPCA’s latest report, Greenhouse Gas Emissions in Minnesota: 1990-2016.
     https://www.pca.state.mn.us/air/state-and-regional-initiatives

                                    5                        The air we breathe: The state of Minnesota’s air quality | 2019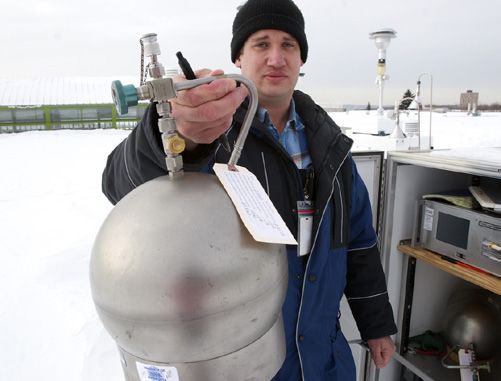
Reducing air pollution protects the wild places Minnesotans enjoy as well as the
                                          plants and animals that inhabit them. For example, airborne mercury can enter wa-
                                          terways, making fish unsafe to eat.

                                          Cleaner air and a growing economy go hand-in-hand. Since Congress passed the
                                          Clean Air Act in 1970, emissions of common air pollutants in the U.S. have dropped
                                          70%, while the U.S. gross domestic product has grown nearly 250%. Investing in
                                          cleaner technology and emission controls to improve air quality costs money, but
                                          studies show the societal benefits of meeting air quality standards far outweigh the
                                          increased costs.

                            Emissions in Minnesota have declined significantly in the past
                            20 years, while the state’s economy has continued to grow.
                            60%
                                                                                               Real gross state product

                                                                                                                           Economic
                            30%                                                                                            activity
Percent change since 1997

                                                                                               Vehicle miles travelled
                                                                                               Population
                                                                                               Energy consumption

                             0%
                                                                                               Greenhouse gases

                                                                                                                           Emissions
                            -30%

                                                                                            Aggregate emissions
                                                                                            (NOx, SO2, VOC, PM2.5)
                            -60%
                                   1997       2001     2005      2009        2013       2017

                                      Real gross state product
                                      Vehicle miles traveled
                                      Energy consumption
                                      Population
                                      Aggregate emissions (NOx, SO2, VOC, PM2.5)
                                      Greenhouse gases (tons of CO2e)
                                              6                         The air we breathe: The state of Minnesota’s air quality | 2019
Air pollutants                                    Fine particles (PM2.5)
                                                  directly emitted from combustion sources1
and where they                                                                                      Emissions from facilities
come from                                                                                           (point sources)

                                                                   60%
These pollutants
                                        Residential
contribute the                       woodburning
                                                                                  15%
most to adverse                      (woodstoves,
health effects in               boilers, campfires)                                            5%
Minnesota.                                                                                 5%                   Agriculture,
                                                                            10%       5%                        construction,
                                                                            Other                               recreational
                                                                                                                equipment
                                                          Industrial,
                                                          commercial,
                                                          institutional                                      Onroad cars,
                                                          combustion                                         trucks, buses

Nitrogen Oxides (NOx)
      Emissions from facilities (point sources)
                                                                  Volatile Organic Compounds (VOCs)
                                                                                                                        Residential
                    30%                                                                                               woodburning
                                                                                        15%
                                                                                        Other         20%             (woodstoves,
                                                                   Gas cars                                                boilers,
                                                                                                                        campfires)
                                       25%                         & trucks   20%
Agriculture,     25%
construction,                                       Gas cars
trains and                                          & trucks                                         15%
pleasure craft               10%                                                                                         Solvents
                                                                                      25%                                (i.e. gas stations,
                 5%
                       5%                                                                                                autobody shops)
                                                                                                       5%
                    Other     Diesel onroad                      Pleasure craft,
                                                                                                                    Emissions
     Residential              trucks, buses                      recreational and
                                                                                                                    from facilities
     heating                                                     lawn and garden
                                                                                                                    (point sources)
                                                                 equipment

Data is from Minnesota’s 2014 emissions inventory. Percentages indicate the approximate             1. Sources shown here emit PM2.5 directly;
amount of total emissions of pollutants of concern emitted by primary source categories in             a large amount of PM2.5 in Minnesota’s
                                                                                                       air is formed indirectly in the
Minnesota; for simplicity, sources contributing less than 5% are not listed. Results are               atmosphere from reaction of gases.
rounded to the nearest 5%. Emissions from wildfires, agricultural and prescribed burning are
not included.

                                       7                             The air we breathe: The state of Minnesota’s air quality | 2019
Air pollution doesn’t
affect everyone equally
Our health is shaped by many things. Our physical and mental state, access to quali-
ty healthcare, and our families’ health histories are all important. The air we breathe
also matters. Understanding the relationship between exposure to pollutants and
disease is difficult because people move in and out of neighborhoods; they live,
work, and play in many settings; and the amount of pollution they breathe varies
over time and place.
Despite these challenges, we do know that some people are exposed to more air
pollution than others because of of where they live or work, and that some peo-
ple are affected more by it. For example, people with pre-existing heart and lung
conditions are at greater risk, and so are the elderly and children. People of color,
indigenous people, and people with low incomes face social, economic, and health
inequities that often contribute to increased frequency of health conditions that
can be affected by air pollution. These inequities mean that communities of color,
indigenous communities, and lower-income communities tend to be more vulnera-
ble to the effects of air pollution.
Air pollution and environmental justice
The MPCA defines environmental justice as “the fair treatment and meaningful
involvement of all people regardless of race, color, national origin, or income, with
respect to the development, implementation, and enforcement of environmental
8 The air we breathe: The state of Minnesota’s air quality | 2019laws, regulations, and policies.” This will be achieved when everyone benefits from
the same degree of environmental protection and has equal access to the deci-
sion-making processes that contribute to a healthy environment.
Environmental justice has many layers. In addition to experiencing higher levels of
pollution, some communities do not have adequate access to the conditions that
support healthy living, including quality schooling, healthcare, and safe neighbor-
hoods. When equitable access to these is limited, poor air quality often contributes
to, and worsens, health disparities.
Many studies have shown that low-income communities and communities of color
are often also exposed to higher levels of outdoor air pollutants or may live in areas
with more pollution sources. In Minnesota, for instance, 32% of all communities
experience air pollution-related risks above health guidelines.1 However, the per-
centages of communities of color and lower-income communities that experience
air pollution exposure risks above health guidelines are far higher.
To address these dispropor-
Air quality risk tionate impacts, the MPCA is
These communities are more likely to be near placing special emphasis on
higher levels of air pollution. areas of concern for envi-
Communities
ronmental justice across the
of color and
Statewide Low-income indigenous state. MPCA has identified
average communities communities areas with more low-income
residents or people of color
and tribal communities state-
32% 46% 91% wide because people in these
are above are above are above
risk guidelines risk guidelines risk guidelines communities can be more
vulnerable to the effects of
air pollution. Part of the MP-
CA’s work to address these
concerns includes increased
air quality monitoring, targeting grants for air quality improvement projects and as-
sistance for small businesses and community groups, and more scrutiny of emission
sources in these areas. To learn more about environmental justice and air quality,
visit https://www.pca.state.mn.us/air/environmental-justice-and-air.
1. Notes on the modeling:
The data used in the graphics on this page are from a cumulative air pollution model called MNRISKS.
The model uses risk assessment methods to examine hypothetical individuals that spend their whole
life in one community, breathing only that air. Modeled emissions include all air pollution sources in
the state of Minnesota including vehicles, factories, construction equipment, building boilers, residen-
tial wood burning, etc.
“Risk guideline” reflects a level of air pollution exposure at or below which health effects would be un-
likely. These guidelines were developed in collaboration with the Minnesota Department of Health. A
result above a risk guideline indicates a need for further investigation and prioritization of that source
and pollutant.
9 The air we breathe: The state of Minnesota’s air quality | 2019Areas of concern for
environmental justice are
found across the state
Legend Wright
Anoka
Washington
Federally recognized tribal
areas
Ramsey
Hennepin
40% or more report income
less than 185% of federal
poverty level Carver
Dakota
50% or more people of color, Scott
including indigenous people
Legend Wrigh
Federally recognized tribal
areas
H
40% or more report income
less than 185% of federal
poverty level Carve
50% or more people of color, Sc
including indigenous people
Legend Wright
Anoka
Washington
Life and breath: How air pollution affects public health in the
Federally recognized tribal
areas
40%Twin Cities and throughout MinnesotaRamsey
Hennepin
or more report income
less than 185% of federal
In 2015,
poverty level the MPCA and the Minnesota
Carver Department of Health (MDH) conducted
50%aorstudy
moreto understand
people of color, health impacts
Scottof air pollution in the Twin Cities metro-
Dakota
politan
including area. Key
indigenous findings include:
people
• During the study period, air pollution contributed to around 2,000 deaths
per year as well as hundreds of hospital admissions and emergency depart-
ment visits annually.
• Air pollution disproportionately impacts the health of some communities.
Areas with higher concentrations of people living in poverty and people of
color tend to experience higher levels of air pollution-related health im-
pacts, largely due to social, economic, and health inequities.
In early 2019, MPCA and MDH will publish an update of the study, which will
estimate health impacts from air pollution in each of Minnesota’s counties. To
learn more, visit: https://www.pca.state.mn.us/life-and-breath-report.
10 The air we breathe: The state of Minnesota’s air quality | 2019neighborhood generation plants
SUVs, vans, and
pickups
Understanding air quality in communities Larger
institutions
such as
MPCA operates a statewide network of air monitors designed to determine ifand
schools
hospitals
Minnesota’s air quality meets federal standards, but air quality may vary significant-
Businesses that
ly in localized spots between those monitors. For example, air quality near certain
emit VOCs, such
as gas stations, facilities in neighborhoods may be poorer than what is represented by network
dry cleaners, andmonitors.
auto body shops
Diesel vehicles
Increasingly, Minnesotans are not satisfied just to know that the state’s
Cars air quality
meets state and federal standards. They want to know more about what’s in the air
where they
Residential live, work,
buildings and play. inTo learn more, the MPCA Gas-powered
Woodburning has undertaken a number
of special air monitoring projects.
stoves and back- lawn equipment
yard fires
Factors that affect air quality
Location Temperature Time of day Weather
Air pollution levels are Fine-particle levels can Fine-particle levels are Minnesota’s weather
higher the closer you increase on unseasonably often highest in the patterns usually help
are to an emissions warm and cloudy winter morning, but can be keep air pollution below
source. For most of us, days. elevated at any time unhealthy levels, but
our highest exposure of day. on days with fog, light
Most unhealthy ozone
occurs near busy winds, or temperature
days occur when day- Ozone is a summertime
roadways. inversions, weather
time high temperatures pollutant. Ozone levels
conditions can allow
exceed 85° F. are highest in the after-
pollution to build to
noon and evening.
unhealthy levels.
Air monitoring across the state
The MPCA operates monitors across Minnesota to understand
the levels of a wide variety of pollutants. You can explore the
monitoring network and pollutant levels across Minnesota at
https://www.pca.state.mn.us/air/minnesotas-air-monitoring-network.
11 The air we breathe: The state of Minnesota’s air quality | 2019Special projects to understand community air quality The MPCA received funding through the Legislative-Citizen Commission on Minne- sota Resources to conduct a special urban air quality monitoring project to under- stand ZIP code-level differences in air quality across Minneapolis and St. Paul. The project will place one air quality monitor in each ZIP code in Minneapolis and St. Paul. Installation of the monitors began in 2018 and will continue throughout 2019. The MPCA and MDH are also working together to better understand what environ- mental chemicals children are exposed to in urban and rural Minnesota. “Healthy Rural and Urban Kids” is a biomonitoring study with a focus on potential air pollu- tion exposures. The MPCA is supporting this work by collecting air samples at two sites near where MDH is collecting biological samples. Learn more about special air monitoring projects: https://www.pca.state.mn.us/air/un- derstanding-air-quality-communities. What is the state of Minnesota’s air quality? Meeting the national air quality standards The U.S. Environmental Protection Agency (EPA) sets national standards for six common air pollutants — ground-level ozone, fine particles, lead, nitrogen dioxide, carbon monoxide, and sulfur dioxide. The MPCA monitors air quality across the state and compares the results to these national standards. In 2017 (latest available data), monitoring showed all areas of Minnesota had air quality better than the fed- eral standards — but not by much in some areas. 12 The air we breathe: The state of Minnesota’s air quality | 2019
Minnesota’s air quality compared to the National Ambient Air Quality Standards (2017)
                                                                                              Good                                            Cautious                               Risk for Exceedance
       Percent of National Ambient Air Quality Standard

                                                          100%                                                                              Federal Standard

                                                          50%

                                                           0%
                                                                  8-Hour

                                                                            Annual

                                                                                          24-Hour

                                                                                                     Gopher Resources

                                                                                                                        North Minneapolis

                                                                                                                                                   Other sites

                                                                                                                                                                  Annual

                                                                                                                                                                            1-Hour

                                                                                                                                                                                         8-Hour

                                                                                                                                                                                                  1-Hour

                                                                                                                                                                                                             1-Hour
                                                                 Ozone      Fine Particles                              Lead                                     Nitrogen Dioxide      Carbon Monoxide     Sulfur
                                                                                                                                                                                                           Dioxide

This chart compares state air monitoring results to the federal standards (each represented by a column). Some pollutants
have federal standards for both long-term and short-term averaging times (annual, 1-hour, etc.) to protect against both
long-term and short-term health effects. The percentage shown describes Minnesota’s maximum pollutant concentration as
a percentage of the national standard. Values less than or equal to 100% meet the applicable standard. Note that in the case of
lead, two facility-specific monitors are included. Both of these sites experience localized lead levels significantly higher than
the rest of the state (see “facility-specific lead emissions” on next page).

                                                                           The national standards are designed to protect human health and the environment.
                                                                           However, new studies show that health effects occur even at air pollution levels
                                                                           below current standards, and that those health effects disproportionately impact
                                                                           disadvantaged communities. EPA regularly reviews the science on health effects
                                                                           of air pollution. Over the years, as scientists have found health effects at lower and
                                                                           lower levels of air pollution, EPA has regularly tightened the standards. To help pro-
                                                                           tect the health of all Minnesotans, the MPCA works to make air quality better than
                                                                           the national standards.

State air quality standards
Minnesota also has state standards for a few pollutants, including hydrogen sulfide and total suspended
particulate (TSP). These pollutants can cause irritation as well as odor and nuisance dust issues. While Min-
nesota’s air generally meets these state standards, monitoring has shown violations near some local sources.
One example is an area in North Minneapolis, which has shown concentrations over state TSP standards since
monitoring began there in 2014. These violations are due to local industrial activity. To learn more about mon-
itoring in North Minneapolis, visit https://www.pca.state.mn.us/air/north-minneapolis-air-monitoring-project.

                                                                                     13                                                      The air we breathe: The state of Minnesota’s air quality | 2019
Facility-specific lead emissions
Lead is an air pollutant that does not spread far from its source. Areas around some
specific facilities may have higher monitored levels of lead than the rest of the state.
The graph on the previous page shows the Gopher Resources and North Minneapolis
monitoring sites. Gopher Resources is a lead battery recycler in Eagan that previous-
ly violated the federal lead standard, but took action to reduce its emissions and is
now in compliance. MPCA monitoring has identified elevated levels of lead and oth-
er pollutants in an industrialized area of North Minneapolis. While neither of these
sites is violating the federal standard, the MPCA continues to monitor and take reg-
ulatory action as needed. Learn more about the North Minneapolis monitoring site
here: https://www.pca.state.mn.us/air/north-minneapolis-air-monitoring-project.
Targeting ground-level ozone and fine-particle pollution
O3 8-HR (2015) PM2.5 Annual (2012) PM2.5 24-HR (2006) Standard
Ground-level
2008 ozone
99% (often called 92%
smog) and fine 82%
particles 1are two of the pollutants
2009 96% 93% 96% 1
closest
2010
to potentially
89%
violating the88%
national standards
105%
and are
1
widespread, affecting
many Minnesotans.
2011 93% Current levels contribute to a96%
83% large number
1 of health impacts in
2012 96% 81% 79% 1
Minnesota,
2013 especially
96% in vulnerable82%areas in the Twin
68% Cities1(see “Life and breath: How
air pollution
2014 affects
96%public health in83%
the Twin Cities 63%
and throughout
1 Minnesota”, page 10).
2015 93% 78% 66% 1
2016 90% 73% 63% 1
Ozone2017and fine-particle
89% levels in 67% Minnesota have54% been improving
1 since 2003. How-
ever, progress in reducing both pollutants has been affected by year-to-year vari-
*Note: Ozone data has been updated to reflect revised ozone standard.
ability in the weather. Moreover, climate change may cause future challenges, both
from increased local temperatures causing more ozone to form, and from longer
and more frequent droughts resulting in more fine-particle pollution from wildfires.
Trends in ozone and fine-particle pollution in the Twin Cities 2003-2017
Air pollutants in the Twin Cities
120%
Percent of national ambient air quality standard
Percent of federal standard
100%
Ozone
80%
Fine
particles
(annual)
60%
Fine particles (daily)
40%
2003 2017
Ozone (8-Hr) Series9
14 The (24-Hour)
Fine ParOcles air we breathe: The state of Minnesota’s air quality | 2019
Standard“Bad air” days
On most days, air across Minnesota is healthy to breathe, but on some days each
year pollutants such as ozone and fine particles can reach unhealthy levels. The
MPCA uses the Air Quality Index (AQI) to rank daily air quality. Air quality is ranked
as good, moderate, unhealthy for sensitive groups, or unhealthy for everyone. The
MPCA issues an air quality alert when the AQI forecast levels are unhealthy for
sensitive groups.
The AQI shows air quality has trended better over time. However, the number of
days with poor air quality varies from year to year. In 2017, Minnesota experienced
no “bad air” days. However, smoke from faraway wildfires is increasingly affecting
our air quality. During the summer of 2018, we had nine bad air days; seven of these
were caused by smoke from distant wildfires that was transported into Minnesota.
For current air quality conditions and forecasts, to download the MN Air app, or to
receive alerts, visit https://ww.pca.state.mn.us/aqi.
Statewide trend in Air Quality Index
Faraway wildfires affect air quality
in Minnesota
Smoke from wildfires
300 contains a number of
pollutants, but the primary
pollutant of concern is fine
particles. These small particles have the po-
Number of AQI days
tential to do the most damage to the lungs
and the heart. Smoke is especially hard on
200 sensitive populations such as people with
respiratory diseases.
When air quality deteriorates to an un-
healthy level, the MPCA calls an air quality
alert. In recent years, most air quality alerts
100
have been caused by smoke from wildfires
in the western U.S. and Canada. Since
2016, the MPCA has issued 11 alerts due to
wildfire smoke. With destructive mega-fires
becoming the new normal in the west due
to drought and increased temperatures
2008 2017 linked to climate change, the MPCA ex-
Good Moderate Unhealthy
pects wildfire smoke to continue to impact
for sensitive
groups Minnesota’s air quality for years to come.
www.pca.state.mn.us/air/wildfire-smoke
15 The air we breathe: The state of Minnesota’s air quality | 2019Sources of air pollution
Typically, people associate air pollution with facilities that have big smokestacks, like
power plants and factories. In reality, these sources make up a relatively small part
of our air pollution emissions, about a fifth of overall emissions in the state. Vehicles
and other mobile equipment, on the other hand, account for about half of overall
emissions. The rest comes from the smaller, “neighborhood” sources such as back-
yard fires and drycleaners that are in all of our communities.
On-road vehicles 24% Small and
Cars and trucks, etc. widespread sources
20% 24%
Off-road vehicles and equipment 20% are the largest
Construction, agriculture, and yard, etc. portion of overall air
21% Neighborhood sources 35% pollution emissions
35% Dry cleaners, home heating, backyard fires, etc. in Minnesota.
Industrial facilities 21%
Factories, power plants, etc. Includes PM2.5, SO2, NOX, VOCs.
Source: MPCA 2014 emissions inventory
Emissions reductions
Since passage of the federal Clean Air Act in 1970, a combination of regulation,
technology and process improvements, as well as growing awareness of the health
impacts of air pollution, have combined to achieve dramatic air pollution reductions.
Over the last 20 years, annual emissions from all types of sources in Minnesota have
decreased by nearly 50%. Since 2008, overall emissions have gone down by about
23%. Among all sources, the greatest reductions have been achieved by power
plants, with emissions falling nearly 70% between 1990 and 2014.
1000 Trends in emissions by
source type 2008-2014
Emissions (thousands of tons)
750
Industrial facilities
Factories, power plants, etc.
500 On-road vehicles
Cars and trucks, etc.
Off-road vehicles and equipment
250 Construction, agriculture, yard, etc.
Neighborhood sources
Dry cleaners, home heating, backyard fires, etc.
0
2008 2011 2014
16 The air we breathe: The state of Minnesota’s air quality | 2019Long-term goals for
air quality
The federal Clean Air Act has led to cleaner air over the past 30 years. To continue
this progress, MPCA sets long-term air quality goals to guide our work. The MPCA’s
long-term goals for our air quality program are to:
• Ensure ambient air is better than air quality standards and health benchmarks.
• Reduce Minnesota’s contribution to global concentrations of greenhouse gases.
• Reduce Minnesota’s contribution to global mercury levels.
• Reach natural visibility conditions in Minnesota’s national parks and wilderness
areas.
MPCA’s strategic plan
For the next five years, the MPCA has four air quality goals that work toward our
long-term goals:
Improve air Offset excess emissions Reduce air Reduce Minnesota’s
Improve
Improve
Improve
Improve air
air
air
air Offset
Offset
Offset
Offset
excessive
excessive
excessive
excessive Reduce
Reduce
Reduce
Reduceair
air
air
air Reduce
Reduce
Reduce
Reduce
quality in and advance diesel permitting greenhouse gas
quality
quality
quality
quality
inininin emissions
emissions
emissions
emissions
and
andand
and permitting
permitting
permitting
permitting Minnesota’s
Minnesota’s
Minnesota’s
Minnesota’s
population reductions via the backlog. emissions from
population
population
population
population
centers. advance
advance
advance
advance settlement. backlog.
diesel
diesel
Volkswagendiesel
diesel backlog.
backlog.
backlog. greenhouse
greenhouse
greenhouse
greenhouse
transportation. gas
gas
gas
gas
centers.
centers.
centers.
centers. reductions
reductions
reductions
reductions
via
via
via
via emissions
emissions
emissions
emissions
from
from
from
from
the
the
the
the
Volkswagen
Volkswagen
Volkswagen
Volkswagen transportation.
transportation.
transportation.
transportation.
We also have agency-wide goals
Settlement.
Settlement.
Settlement.
Settlement.to improve the work of all of our programs. Some
of these will be particularly important for our air quality goals:
Incorporate Increase involvement
strategies to address of communities in
environmental decisions and actions
justice concerns in all that affect them.
programs.
17 The air we breathe: The state of Minnesota’s air quality | 2019Collaborating to reduce pollution State and federal laws and regulations have cut pollution significantly, but regula- tion isn’t always the best solution to complex air quality challenges. There’s a lot more we can all do to reduce pollution. The MPCA works with partners to help businesses and individuals act on these opportunities. Clean Air Minnesota Clean Air Minnesota is a public-private partnership working to reduce air pollution from neighborhood sources through voluntary projects. Members strive to better protect public health by going beyond the federal air quality standards. This part- nership is led through the joint efforts of the MPCA, Environmental Initiative, the Minnesota Chamber of Commerce and Minnesota Center for Environmental Advo- cacy, and includes local and tribal governments, businesses, and non-profits. These partners work to raise awareness and foster a sense of priority around Minnesota’s air quality. They also connect businesses and people with funding for voluntary air pollution reduction projects. Clean Air Minnesota’s overarching goal is to reduce emissions of certain key pollutants by 10% from 2011 levels through voluntary emission reduction efforts. Among other projects in the past two years, Clean Air Minnesota partners have helped small-business owners make equipment changes; replace an old, dirty diesel engine in a towboat with a new, cleaner version; and replace old wood stoves with cleaner-burning technology. Up to 2017, this work has reduced 247 tons of fine particles and 337 tons of VOCs. For more information, visit https:// environmental-initiative.org/work/clean-air-minnesota. Partnering with tribes The MPCA collaborates with tribal environmental experts across the state to improve air quality for everyone in Minnesota. Many of the tribes around the state operate air monitors that help inform MPCA’s air quality forecasting. The Mille Lacs Band of Ojibwe Department of Natural Resources and the MPCA were co-investigators in a project to monitor and compare air pollution con- centrations across the Phillips communities of South Minneapolis and in Mille Lacs. Many tribes also actively share their expertise through comments on MPCA permits. The MPCA and tribes are also collaborating to provide input on federal actions from a local perspective. These partnerships help the tribes and the MPCA understand air quality across the state and keep everyone informed about health effects of air pollution. 18 The air we breathe: The state of Minnesota’s air quality | 2019
Responding to federal regulatory rollbacks
                                           The Clean Air Act establishes a collaborative relationship between the EPA and
                                           state environmental agencies. Since 2016, the EPA has been rolling back numerous
                                           air quality regulations. Many of these regulations have been the backbone of Min-
                                           nesota’s clean air progress over the past 20 years and lay the foundation for future
                                           progress. The MPCA analyzes these proposed rule changes to understand how they
                                           might affect Minnesota’s environment, the health of Minnesotans, and the state’s
                                           regulatory environment. In many recent cases, the MPCA has had serious concerns
                                           about these rollbacks, and is working with other Minnesota state agencies and other
                                           states across the nation to provide input to EPA on these rule changes. Also, when
                                           warranted, the MPCA is working with the Attorney General’s office to support legal
                                           action to protect Minnesota. To learn more about these actions and read what the
                                           MPCA has been saying about them, visit https://www.pca.state.mn.us/air/respond-
                                           ing-federal-actions.

                                           Working across sectors
                                           to reduce pollution
                                           Sources of air pollution are all around us. Each type of source has its own challenges
                                           and requires different strategies for reducing emissions. As well as regulating permitted
                                                                    facilities, MPCA pursues creative ways of reducing emissions
                                                                               from the many less-regulated or unregulated sources
                                                                                       across Minnesota. The following sections
  Sources of exposure                   to                                                     describe these efforts.
  unhealthy air in your                                         Industrial facilities
                                                                and power
  neighborhood                                                  generation plants

                                                                           SUVs, vans, and
                                                                           pickups

                                                                                                              Larger
                                                                                                              institutions
                                                                                                              such as
                                                                                                              schools and
                                                                                                              hospitals
Businesses that
emit VOCs, such
as gas stations,
dry cleaners, and
auto body shops
                      Diesel vehicles                                                                 Cars

                Residential buildings       Woodburning in                                   Gas-powered
                                            stoves and back-                                 lawn equipment
                                            yard fires

                                               19                             The air we breathe: The state of Minnesota’s air quality | 2019
 Factors that affect air quality
Air pollution from vehicles and heavy-duty
diesel equipment
Vehicles and other mobile equipment (such as that used in construction or agri-
culture) may not pollute much individually, but together they account for more air
pollution in Minnesota than all of our large permitted facilities combined (see page
16). Moreover, pollution from vehicles is an important environmental justice con-
cern. A 2015 study by MPCA researchers found that while people of color and low-
er income tend to own fewer vehicles, do less driving, and use public transit more
often than other groups, they are exposed to
higher levels of traffic-related pollution. This is
because busy roadways, and their associated air
pollution, often run through communities of
color and lower income. Many of these com-
munities therefore bear a disproportionate
burden of traffic-related health effects while
contributing less to vehicle pollution.
The federal government regulates the fuel
efficiency and tailpipe emissions of new vehi-
cles, but federal regulations alone cannot ad-
dress the impacts of vehicle pollution. We can
achieve further reductions through purchas-
ing decisions and smart community planning. The MPCA serves as an advisor and
technical resource for a wide range of transportation planning and funding efforts
across the state to promote air quality improvements in this sector.
An important trend in vehicle emissions in Minnesota is the increasing use of larger
vehicles like SUVs, crossovers, and pickup trucks, which pollute more per mile
traveled than smaller, lighter cars. In 2011, the number of these larger vehicles
surpassed the number of cars on the road in Minnesota and became the majority
of the passenger fleet. Today, these heavier vehicles comprise 57% of all passenger
vehicles and emit 70% of the passenger vehicle-related pollution.
Heavier vehicles such as pickup
trucks, SUVs, and crossovers now
43% 30% make up the majority of passenger
vehicles in Minnesota and pollute
of emissions
Cars more per mile.
57% 70%
Trucks, SUVs, of emissions
vans
20 The air we breathe: The state of Minnesota’s air quality | 2019Heavy-duty diesel vehicles and equipment are an area where collaboration can
make a big difference. Older diesel engines (pre-2006) are some of the heaviest
polluters in the vehicle sector. They can last for decades, so even though recent
federal regulations have made diesel engines much cleaner, the old equipment con-
tinues to be a significant source of air pollution.
One old diesel truck can pollute more than 30 new diesel trucks
Depending on factors such as the age of
the truck, how far it travels, and how much
it idles, one old diesel truck can produce as
much particle pollution as 25-50 modern
trucks under the same operation factors.
vs.
Because the impact of older diesels is so significant, the MPCA and its partners
work to encourage owners of diesel vehicles and equipment to retrofit or upgrade
their engines and vehicles, and provide grant funding to help owners make the
switch to cleaner equipment. Since 2006, the combined efforts of the MPCA’s
Clean Diesel Program and Clean Air Minnesota’s Project Green Fleet have reduced
fine-particle pollution from diesel emissions equivalent to taking more than one
million cars off the road. Learn more about vehicle pollution: https://www.pca.state.
mn.us/air/vehicles-and-heavy-duty-equipment.
Volkswagen settlement
In 2016, the federal government sued Volkswagen for violating the Clean Air Act.
The resulting settlement gives states and tribes funding for projects to reduce
diesel pollution through upgrading or replacing old diesel vehicles and equipment
and installing electric-vehicle (EV) charging stations. Throughout 2017, MPCA staff
traveled around the state talking to Minnesotans about how best to invest Minneso-
ta’s $47 million share of the settlement over the next 10 years.
The state’s plan divides the available funding into three phases over 10 years. The
MPCA began accepting applications for phase 1 grants during the summer of 2018.
Demand for funding has been enormous. For the first grant round of $2 million for
the replacement of old school buses, the MPCA received $9 million in requests.
21 The air we breathe: The state of Minnesota’s air quality | 2019Similarly, we received a total of $567,000 in funding requests for electric-vehicle
charging stations for the $150,000 available. In 2019, MPCA will announce grant
application opportunities for other vehicle types and will be developing a plan for
the second phase of funding.
Electric vehicles
Replacing gasoline-powered cars with EVs can significantly improve local air quality
and reduce the costs of vehicle ownership. EVs charged on Minnesota’s electric
power grid produce far less emissions on average than standard gasoline-powered
cars, and EVs charged with renewable energy, such as wind or solar, are essentially
zero-emitting vehicles.
By allowing up to 15% of VW funds to be used to expand EV charging infrastructure,
the Volkswagen settlement will give a big boost to adoption of EVs in Minnesota.
The MPCA has dedicated $1.4 million of phase 1 funding to developing a system of
highway corridors with fast chargers that will support EV adoption by extending
11,000 how far EV drivers can go.
lbs
Electric vehicles are much
cleaner, even when charged on
the electric power grid.
Annual well-to-wheel car emissions by fuel type (12,000 miles compact/midsize car)
Gasoline vehicle EV charged EV charged with renewables
on grid
4,000 Mix of sources:
6.5 lbs coal, nuclear,
wind, gas, etc.
.4 lbs 2.3 lbs .4 lbs 0 lbs 0 lbs .1 lbs
CO2e NOx PM2.5 CO2e NOx PM2.5 CO2e NOx PM2.5
22 The air we breathe: The state of Minnesota’s air quality | 2019Charging on high-
way corridors will The MPCA also
allow Minnesotans partners with Drive
to travel farther Electric Minnesota
(a partnership of EV
with EVs Bemidji
Virginia
champion organiza-
Grand Rapids
tions), local governments,
Moorhead
and others to educate people
Detroit Lakes Duluth
about the benefits of EVs and plan
Aitkin
This map shows existing and for future growth in the number of EVs
Brainerd
funded EV charging corridors
in our state. As EVs become more popular
in Minnesota (blue) along Little Falls
in the coming years, it is important for the
with a vision of a system that
MPCA to work with our partners to ensure
would help more Minneso- Saint Cloud
EV adoption is good for Minnesota’s air qual-
tans to travel by EV (green).
Willmar ity, supports further adoption of renewable
The dark grey areas show the Minneapolis Saint Paul
Bloomington energy and a modern power grid, and
parts of Minnesota that will
that Minnesotans have equitable access
be reachable using the EV Marshall
to EV technology.
fast-charging highway corri-
Mankato
dor system by the end of the Rochester
Dresbach Existing and funded EV
first phase of VW settlement fast charging corridors
Albert Lea
Proposed EV charging
funding. Map courtesy of corridors
Great Plains Institute, 2018. Reachable using EV fast
charging corridors
Air pollution from everyday, neighborhood sources
Some of the most challenging sources of air pollution are “neighborhood” sources.
These are the sources in our homes and neighborhoods that are small individually,
but together can have a big impact on air quality. Sources such as lawn mowers, dry
cleaners, backyard fires, and auto-body shops are located where we live, work, and
play, which means we are frequently exposed to their emissions, sometimes for long
periods of time. Total emissions from neighborhood sources are significantly great-
er than all the large permitted facilities in the state combined (see page 16).
Partnerships and voluntary actions are central to the MPCA’s approach to reduc-
ing emissions from these sources. MPCA works with businesses, nonprofits, local
and tribal governments, and communities through Clean Air Minnesota (see page
18) and other collaborations, such as MPCA’s Green Step Cities and GreenCorps
programs, to develop voluntary emission-reduction programs and assist small busi-
nesses in reducing emissions. To learn more, visit https://www.pca.state.mn.us/air/
neighborhood-sources.
Helping small businesses reduce VOCs
Employees at facilities around the state breathe in fumes from chemicals that
contain voluntary organic compounds (VOCs) every day. Released to the outdoors,
23 The air we breathe: The state of Minnesota’s air quality | 2019VOCs also react with other pollutants to form ground-level ozone (also known
as smog) and fine particles. Using different chemicals in industrial processes and
upgrading to low-emitting equipment can
reduce VOC emissions. Because the costs of
training and new equipment can be a barrier,
MPCA and its partners offer grants, loans,
and training for small businesses. So far, the
MPCA’s grants efforts have resulted in 37
less tons of VOCs emitted by small business-
es per year, the equivalent of 37,000 cans of
spray paint a year.
Innovative pilot programs
The MPCA is continually looking for new and more cost-effective methods
for assisting small businesses to make more environmentally friendly
choices. Many businesses use VOC-emitting solvents in the equipment
they use to clean tools and parts used in their work. A recent pilot program
partnered with vendors to provide direct funding to replace these solvent-
based parts washers with ones that use water instead. This program helped
the MPCA reach more businesses with less resources invested in outreach,
and the program was easier to access for those businesses.
Reducing exposures to wood smoke
While people have always burned wood, we now know that wood smoke can impact
the health of families and their neighbors. Survey data indicates residential wood
burning, unlike other air pollution sources, is increasing as more wood is being
burned for home heating and in residential backyard fire pits. Residential wood
burning is a sizable contributor to fine-particle emissions and can aggravate health
conditions such as asthma. The MPCA is partnering with Clean Air Minnesota to
help communities and citizens reduce wood smoke.
Air pollution from industrial facilities
Large facilities with smokestacks, such as factories and power plants, must operate
under air quality permits issued by the MPCA. Permitted facilities emit about a fifth
of the total air pollution in the state, but they have cut emissions significantly in
the past 20 years (see page 16). To learn more, visit https://www.pca.state.mn.us/air/
large-industrial-facilities.
24 The air we breathe: The state of Minnesota’s air quality | 20192013 72,582 8 22,804 41,585 19,614
2014 76,189 7 23,931 43,446 19,781
2015 60,487 6 19,560 31,423 19,660
2016 57166 5 18334 27724 19240
% change 2007-2016
61 66 40 79 26
Emissions from Lead PM10 NOx SO2 VOC
permitted
facilities have
➔
➔
➔
➔
➔
56% 37% 57% 75% 21%
significantly
decreased
2007-2016 Reducing mercury in our air and water
Mercury exposure can harm the organs and nervous systems of people and wildlife.
Minnesota has led the nation in efforts to reduce mercury air emissions, but chal-
lenges remain.
Mercury released into the air settles into water and accumulates in fish, making
them unsafe for people to eat and damaging the ecosystem. In 2007, the MPCA
finalized a statewide mercury emissions reduction plan to meet water-quality
standards and protect people from consuming mercury-contaminated fish. Despite
significant reductions from some sectors, the MPCA projects that the state will
not meet the plan’s 2025 statewide reduction goal. Emissions from certain mer-
Minnesota is cury-containing products (such as fluorescent lights, certain electrical switches,
making progress thermometers, and dental fillings) are holding steady or increasing.
toward meeting the
2025 statewide 4,000
mercury emissions
reduction goal, but is not
projected to meet it.
Largely resulting from the purposeful use of mercury
3,000 Incidental to material processing (mostly mining)
Mercury Emissions (pounds)
Incidental to energy production (mostly coal)
2,000
Projected
emissions
1,000 TMDL goal of 789 lbs
by year 2025
0
2005 2008 2011 2014 2016 2025
All the waters in the state will benefit from the statewide mercury reduction plan,
1
but not all waters respond the same to reduced emissions. The primary goal is to
substantially lower mercury in fish and make them safer to eat. About 90% of our
waters will reach the goal if the plan is fully implemented. For the remaining 10%,
more work is needed to understand why these waters remain high in mercury de-
spite lower emissions.
25 The air we breathe: The state of Minnesota’s air quality | 2019Major emissions reductions from power plants
State statutes and rules, along with national standards for mercury and air toxics
emissions from coal-fired utility boilers, have resulted in significant reductions in
emissions of mercury and other pollutants in Minnesota. In 2006, Minnesota passed
the Mercury Emissions Reduction Act (MERA), which set a schedule for the larg-
est coal-fired utility boilers in the state to reduce mercury emissions by 90% from
2005 levels. As of 2015, all Minnesota utilities have achieved full compliance with
MERA. To get there, they retrofitted some coal plants with improved pollution
controls, switched some to natural gas, and shut down others. The changes these
facilities made to reduce mercury emissions also brought 75-80% reductions in
emissions of haze-forming pollutants as well as significant reductions in greenhouse
gases. Utilities continue to shut down coal plants in Minnesota as they rely more on
Reducing renewable energy and natural gas. Several of the remaining coal plants in Minnesota
will close in the 2020s.
mercury pollution
Reducing
from mercury
coal-fired power plants in pollution from coal-fired electric plants in Minnesota
Emissions reductions achieved through retrofitting and
Minnesota 92%
509
shutting down coal plants in Minnesota since the enactment
lbs/yr
of MERA. Some facilities that show reductions in earlier years
appear again in the 2020s because they were first retrofitted
to reduce emissions and will now be shut down.
82%
257
lbs/yr
88%
179
100% 100% lbs/yr
95%
121 114
lbs/yr
94 lbs/yr
100%
100% reduction 63% lbs/yr
80 62 86% 100% 100% 72
lbs/yr 100% lbs/yr 100% 100% 100% lbs/yr
11 46 35 40 1.5 7.6 1.5
lbs/yr
lbs/yr lbs/yr
lbs/yr
24 25 lbs/yr lbs/yr lbs/yr
23 lbs/yr lbs/yr
20lbs/yr
lbs/yr
High Bridge NE Station Riverside King Boswell 3 Sherco 3 Taconite Hbr Sherco 1& 2 Blackdog Taconite Laskin Boswell 4 Boswell 1& 2 Taconite Hbr Hoot Lake Sherco 1& 2
2007 2009 2009 2009 2010 2010 1&2 2013 2014 2015 Hbr 3 2015 2015 2016 2019 1&2 2020 1&2 2020 2023-26
Date of retrofit or closure
existing planned
Conclusions
Minnesota’s air quality is generally good and continues to improve. Our clean air
supports healthier Minnesotans, healthier ecosystems, and a strong economy.
However, air quality is not the same in all parts of the state and some people are
more vulnerable to the health effects of air pollution. The MPCA must continue to
learn more about these disproportionate impacts and find new and creative ways
to address this challenge. To those ends, the MPCA collaborates closely with other
state agencies, local and tribal governments, non-profits, and businesses to address
disparities and improve air quality, especially in the areas that need it the most.
We must continue to adapt our strategies as we learn more about the health effects
of air pollution and how climate change is affecting and will continue to affect our
air quality. Through these challenges, the MPCA will continue to protect and im-
prove human health and the environment for all Minnesotans.
26 The air we breathe: The state of Minnesota’s air quality | 2019Appendix A Mercury emissions associated with electricity production and consumption in Minnesota, 2014-2017 In accordance with Minnesota Statute §116.925, this appendix reports mercury emissions associated with electricity production. In 2007, the MPCA established an emissions reduction goal and is now implementing stakeholder recommendations to meet the goal. The electric utility sector has made changes to reduce mercury and is on track to meet the interim mercury emission reduction goals in 2018. More infor- mation about Minnesota’s mercury emissions and reduction strategies can be found on page 25 of this report and at https://www.pca.state.mn.us/quick-links/mercury. Mercury emissions from electricity generation Minnesota Statute §116.925 requires producers and retailers of electricity to report the amount of mercury emitted through the generation of electricity. This law also requires MPCA to summarize this information in its biennial air toxics report to the Legislature. Minnesota law exempts certain electric-generation facilities from reporting mer- cury emissions: (1) those that operate less than 240 hours per year, (2) combustion units that generate fewer than 150 British thermal units (Btu) per hour, (3) gen- eration units with a maximum output of 15 megawatts or less, and (4) combustion facilities that emit less than three pounds of mercury in a given year. Therefore, generation facilities that do not emit any mercury, such as nuclear, wind, and hydro- electric, are not reported here. Due to variation in operating conditions, some facilities may emit more than three pounds one year and less than three pounds in another. When emissions are less than three pounds, the actual emissions are either given or listed as exempt, de- pending on the wishes of the facility’s management. The following table shows mercury emissions from electric utilities in years 2014 through 2017. Note that 2017 emissions are considered draft and under quality review by the MPCA. 27 The air we breathe: The state of Minnesota’s air quality | 2019
You can also read