4.3 Air Quality - San Joaquin Council of Governments
←
→
Page content transcription
If your browser does not render page correctly, please read the page content below
Environmental Impact Analysis
Air Quality
4.3 Air Quality
This section analyzes the impacts of the 2018 RTP/SCS on local and regional air quality, through the
year 2042. Both temporary impacts relating to construction activities and long-term impacts
associated with population and employment growth and associated growth in vehicle traffic and
energy consumption are discussed. Greenhouse gas emissions are analyzed in Section 4.9,
Greenhouse Gas Emissions/Climate Change.
4.3.1 Setting
a. Local Climate and Topography
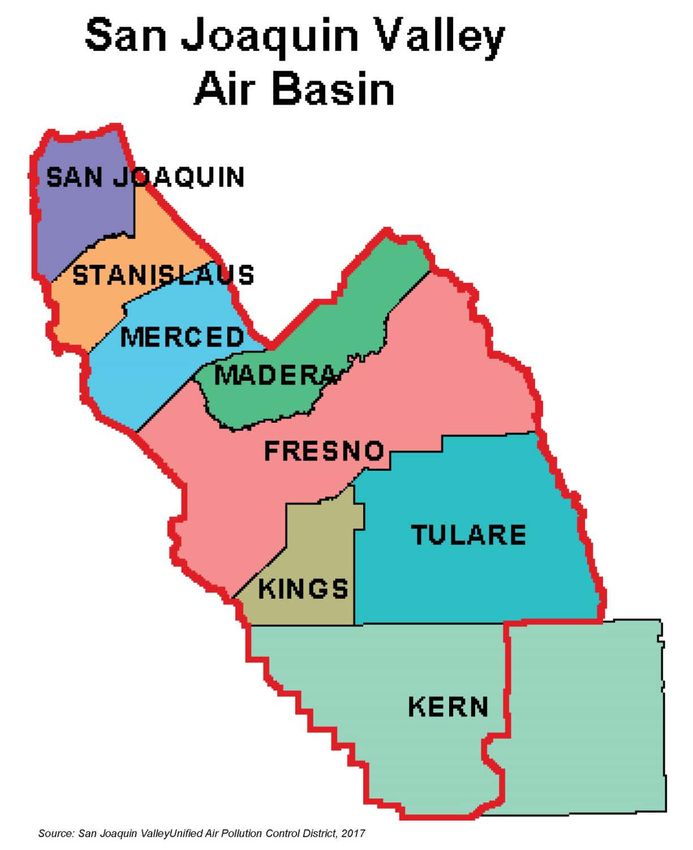
The San Joaquin Valley Air Basin (SJVAB) consists of eight counties, stretching from Kern County in
the south to San Joaquin County in the north. The SJVAB is bounded by the Sierra Nevada to the
east, the Coast Ranges to the west, and the Tehachapi mountains to the south. Figure 7 illustrates
the location of the County within the SJVAB.
The SJVAB has an inland Mediterranean climate with warm, dry summers, relatively cool nights, and
cooler winters with limited rainfall. Winters are mild with light rains and frequent heavy fog from
December to January. The average temperature in the Basin is 61.5 degrees Fahrenheit (°F)
(USA.com 2018). The average maximum daily temperature in July is approximately 93°F and the
average minimum daily temperature in January is 38°F (Sperling’s Best Places 2016). Rainfall occurs
mainly in the winter months from November to April and averages 18.6 inches per year (USA.com
2018).
Air quality is affected by the rate and location of pollutant emissions and by climatic and
topographic conditions that influence the movement and dispersion of pollutants. Atmospheric
conditions, such as wind speed, wind direction, and air temperature gradients, along with local and
regional topography, mediate the relationship between air pollutant emissions and air quality. In
the SJVAB, the surrounding mountains restrict air movement and impede the dispersion of
pollutants out of the basin. The SJVAB also experiences temperature inversions frequently
throughout the year, which restrict vertical dispersion of air pollutants; an inversion occurs when a
mass of warm dry air sits over cooler air near the ground, essentially trapping the air mass below
(SJVAPCD 2012a). In addition, the Valley’s long, hot summers, and stagnant, foggy winters, provide
ideal conditions for the formation of photochemical oxidants and reduce dispersion, respectively.
Wind speed and direction determine the dispersion of air pollutants. Marine air comes into the
basin from the Sacramento River–San Joaquin River Delta, although most air movement is restricted
by the surrounding mountains. Winds from the Bay Area flow northeasterly into the Sacramento
Valley and southward into San Joaquin County. This results in weak winds from the north and
northeast, with an average speed of seven miles per hour. During the summer, wind from the north
flows south and southeasterly through the Valley, through the Tehachapi Pass and into the
Southeast Desert Air Basin. Thus, emissions from the San Francisco Bay Area and the Broader
Sacramento air basins are transported into San Joaquin County and the SJVAB. Emissions in the San
Joaquin Valley are then transported to the Southeast Desert and Great Basin Valley Air Basins. In
late fall and winter, cold air from the mountains flows into the Valley. This results in winds from the
south that flow north and northwesterly. Some emissions from San Joaquin County are transported
to the broader Sacramento air basin during these times. However, the winds are relatively light,
limiting the dispersion of CO and other pollutants.
Draft Programmatic Environmental Impact Report 99San Joaquin Council of Governments 2018 Regional Transportation Plan/ Sustainable Communities Strategy Figure 7 San Joaquin Valley Air Basin 100
Environmental Impact Analysis
                                                                                                          Air Quality

In the late fall and winter, when there is little interchange of air between the valley and the coast,
humidity is high following winter rains, and temperature inversions at ground level persist over the
entire valley for several weeks, air movement is virtually absent and radiation fog, known as tule
fog, forms. This is typically when peak concentrations of carbon monoxide (CO), oxides of nitrogen
(NOX), and particulate matter (PM) occur.

b. Air Pollutants of Primary Concern
The federal and State Clean Air Acts (CAA) mandate the control and reduction of certain air
pollutants, referred to as “criteria pollutants.” Under these laws, the U.S. Environmental Protection
Agency (U.S. EPA) and the California Air Resources Board (CARB) have established ambient air
quality standards for criteria pollutants. Primary criteria pollutants are emitted directly from a
source (e.g., vehicle tailpipe, an exhaust stack of a factory, etc.) into the atmosphere and include
carbon monoxide, reactive organic gasses (ROG), NOX, fine particulate matter (PM10 and PM 2.5),
sulfur dioxide (SO2), and lead (Pb). Secondary criteria pollutants are created by atmospheric
chemical and photochemical reactions. ROG, together with NOX, form the building blocks for the
creation of photochemical (secondary) pollutants. Secondary pollutants include oxidants, ozone,
and sulfate and nitrate particulates (smog). The characteristics, sources, and effects of critical air
contaminants are provided in Table 5.

Table 5     Description of Criteria Pollutants
 Photochemical Oxidant (Ox)
 Characteristics. The term “photochemical oxidant” can include several different pollutants, but consists primarily of
 ozone (more than 90 percent) and a group of chemicals called organic peroxynitrates. Photochemical oxidants are
 created in the atmosphere rather than emitted directly into the air. Reactive organic gases and oxides of nitrogen are
 the emitted contaminants, which participate in the reaction. Ozone is a pungent, colorless toxic gas, which is produced
 by the photochemical process. Photochemical oxidant is a characteristic of southern California-type smog, and reaches
 highest concentrations during the summer and early fall.
 Sources. Ozone is caused by complex atmospheric reactions involving oxides of nitrogen and reactive organic gases with
 ultraviolet energy from sunlight. Motor vehicles are the major source of oxides of nitrogen and reactive organic gases in
 the basin.
 Effects. The common manifestations of ozone and other photochemical oxidants are damage to vegetation and cracking
 of untreated rubber. Ozone in high concentrations (ranging from 0.15 ppm to 0.50 ppm) can also directly affect the
 lungs, causing respiratory and coronary irritation and possible changes in lung functions. These health problems are
 particularly acute in children and elderly people exposed to these pollutants.
 Carbon Monoxide (CO)
 Characteristics. CO is a colorless, odorless, toxic gas produced through the incomplete combustion of fossil fuels.
 Concentrations are higher in winter when more fuel is burned for heating purposes and weather conditions favor the
 build-up of directly emitted contaminants.
 Sources. The use of gasoline-powered engines is the major source of this contaminant, with automobiles being the
 primary contributor. CO emissions from gasoline-powered engines are higher during winter months due to poor engine
 efficiency in cold temperatures. Various industrial processes also produce CO emissions through incomplete combustion
 of fossil fuels.
 Effects. CO does not irritate the respiratory tract. However, it passes through the lungs directly into the blood stream
 and, by interfering with the transfer of oxygen, deprives sensitive tissues of oxygen.

Draft Programmatic Environmental Impact Report                                                                              101
San Joaquin Council of Governments 2018 Regional Transportation Plan/ Sustainable Communities Strategy Nitrogen Oxides (NOX) Characteristics. NOX primarily consists of nitric oxide (NO) (a colorless, odorless gas formed from atmospheric nitrogen and oxygen when petroleum combustion takes place under high temperatures and/or pressure) and nitrogen dioxide (NO2) (a reddish-brown irritating gas formed by the combination of nitric oxide with oxygen). Due to the role they play as ozone precursors, oxides of nitrogen are one of the two criteria pollutants subject to federal ozone requirements. Sources. High combustion temperatures cause nitrogen and oxygen to combine and form nitric oxide. Further reaction produces additional oxides of nitrogen. Combustion in motor vehicle engines, power plants, refineries and other industrial operations are the primary sources in the region. Ships, railroads and aircraft are other significant emitters. Effects. Oxides of nitrogen are direct participants in photochemical smog reactions. The emitted compound, nitric oxide, combines with oxygen in the atmosphere in the presence of sunlight, to form nitrogen dioxide and ozone. Nitrogen dioxide, the most significant of these pollutants, can color the atmosphere at concentrations as low as 0.5 ppm on days of 21 0-mile visibility. NO2 is an important air pollutant in the region because it is a primary receptor of ultraviolet light. The latter initiates photochemical reactions, helping to form ozone and/or particulate nitrate. It will also react in the air to form nitrate particulates. Sulfur Dioxide (SO2) Characteristics. SO2 is a colorless, pungent, irritating gas formed primarily by the combustion of sulfur-containing fossil fuels. In humid atmospheres, SO2 can form sulfur trioxide and sulfuric acid mist, with some of the latter eventually reacting to produce sulfate particulates. Sources. This contaminant is the natural combustion product of sulfur or sulfur-containing fuels. Fuel combustion is the major source, while chemical plants, sulfur recovery plants, and metal processing are minor contributors. Effects. At sufficiently high concentrations, sulfur dioxide irritates the upper respiratory tract. At lower concentrations, when in conjunction with particulates, SO2 appears able to do still greater harm by injuring lung tissues. Sulfur oxides, in combination with moisture and oxygen, can yellow the leaves of plants, dissolve marble and eat away iron and steel. Sulfur oxides can also react to form sulfates, which reduce visibility. Particulates (Total Suspended Particles and PM10) Characteristics. Atmospheric particulates are made up of finely divided solids or liquids, such as soot, dust, aerosols, fumes, and mists. About 90 percent by weight of the emitted particles are larger than 10 microns in diameter, but about 10 percent by weight, or 90 percent of the total number of particulates, are less than 5 microns in diameter. The aerosols formed in the atmosphere, primarily sulfate and nitrate, are usually smaller than 1 micron. In areas close to major sources, particulate concentrations are generally higher in the winter, when more fuel is burned for heating, and meteorological conditions favor the build-up of directly-emitted contaminants. However, in areas remote from major sources and subject to photochemical smog (ozone), particulate concentrations can be higher during summer months because the presence of ozone increases the potential for SO2 and NO2 to convert to sulfate and nitrate particulates. Sources. Particulate matter consists of particles in the atmosphere resulting from many kinds of dust and fume- producing industrial and agricultural operations, from combustion, and from atmospheric photochemical reactions. Re- entrained road dust from vehicles is a significant source of particulates. Natural activities also put particulates into the atmosphere; wind-raised dust and ocean spray are two such sources of particulates. Effects. In the respiratory tract very small particles of certain substances may produce injury by themselves, or may contain absorbed gases that are injurious. Suspended in the air, particulates less than 5 microns in diameter can both scatter and absorb sunlight, producing haze and reducing visibility. They can also cause a wide range of damage to materials. 102
Environmental Impact Analysis
                                                                                                            Air Quality

 Diesel Particulate Matter (DPM)
 Characteristics. Diesel particulate matter is part of a complex mixture that makes up diesel exhaust. Diesel exhaust is
 commonly found throughout the environment. Diesel exhaust is composed of two phases, either gas or particle, and
 both phases contribute to the risk. The gas phase is composed of many of the urban hazardous air pollutants, such as
 acetaldehyde, acrolein, benzene, 1,3-butadiene, formaldehyde, and polycyclic aromatic hydrocarbons. Diesel exhaust
 has a distinct odor, which is primarily a result of hydrocarbons and aldehydes contained in diesel fuel. The particle phase
 also has many different types of particles that can be classified by size or composition. The size of diesel particulates
 that are of greatest health concern are those that are in the categories of fine and ultra-fine particles. The composition
 of these fine and ultra-fine particles may be composed of elemental carbon with adsorbed compounds such as organic
 compounds, sulfate, nitrate, metals, and other trace elements.
 Sources. Diesel exhaust is emitted from a broad range of diesel engines: the on-road diesel engines of trucks, buses, and
 cars and the off-road diesel engines that include locomotives, marine vessels, and heavy-duty equipment.
 Effects. Acute exposure to diesel exhaust may cause irritation to the eyes, nose, throat and lungs, and some
 neurological effects such as lightheadedness. Acute exposure may also elicit a cough or nausea as well as exacerbate
 asthma. Chronic exposure in experimental animal inhalation studies has shown a range of dose-dependent lung
 inflammation and cellular changes in the lung and there are also diesel exhaust immunological effects. Based upon
 human and laboratory studies, there is considerable evidence that diesel exhaust is a likely carcinogen. Human
 epidemiological studies demonstrate an association between diesel exhaust exposure and increased lung cancer rates in
 occupational settings.
 Hydrocarbons and other Organic Gases (Total Hydrocarbons, CH4NMHC (non-methane), AHC, NHC)
 Characteristics. Any of the vast family of compounds consisting of hydrogen and carbon in various combinations are
 known as hydrocarbons. Fossil fuels are included in this group. Many hydrocarbon compounds are major air pollutants,
 and those which can be classified as olefins or aromatics are highly photochemically reactive. Atmospheric hydrocarbon
 concentrations are generally higher in winter because the reactive hydrocarbons react more slowly in the winter and
 meteorological conditions are more favorable to their accumulating in the atmosphere to higher concentration before
 producing photochemical oxidants. Due to the role they play as ozone precursors, reactive hydrocarbons are one of the
 two criteria pollutants subject to federal ozone requirements.
 Sources. Motor vehicles are a major source of anthropogenic hydrocarbons (AHC) in the basin. Other sources include
 evaporation of organic solvents and petroleum refining and marketing operations. Trees are the principal emitters of
 biogenic or natural hydrocarbons (NHC).
 Effects. Certain hydrocarbons can damage plants by inhibiting growth and causing flowers and leaves to fall. Levels of
 hydrocarbons currently measured in urban areas are not known to cause adverse effects in humans. However, certain
 members of this contaminant group are important components in the reactions which produce photochemical oxidants.
 Lead (Pb)
 Characteristics. Lead is an elemental heavy metal found naturally in the environment as well as in manufactured
 products. Lead can be released directly into the air, as suspended particles. It is soft, malleable, and melts at a relatively
 low temperature. When freshly cut, it has a bluish-white tint; it tarnishes to a dull gray upon exposure to air. Lead has
 several properties that make it useful: high density, low melting point, ductility, and relative inertness to oxidation.
 Combined with relative abundance and low cost, these factors resulted in the extensive worldwide use of lead. Lead is
 persistent in the environment and accumulates in soils and sediments through deposition from air sources, direct
 discharge of waste streams to water bodies, mining, and erosion.
 Sources. The major sources of lead emissions historically have been mobile and industrial sources. As a result of phasing
 out leaded gasoline, metal processing currently is the primary source of Pb emissions. The highest level of lead in the air
 is generally found near lead smelters. Other stationary sources include waste incinerators, utilities, and lead-acid
 battery manufacturers.
 Effects. Humans may be exposed to lead from air pollution directly, through inhalation, or through the incidental
 ingestion of lead that has settled out from the air onto soil or dust. Depending on the level of exposure, lead can
 adversely affect the nervous system, kidney function, immune system, reproductive and developmental systems and
 the cardiovascular system. Lead exposure also affects the oxygen carrying capacity of the blood. The lead effects most
 commonly encountered in current populations are neurological effects in children and cardiovascular effects (e.g., high
 blood pressure and heart disease) in adults. Infants and young children are especially sensitive to even low levels of
 lead, which may contribute to behavioral problems, learning deficits and lowered IQ. Elevated lead in the environment
 can result in decreased growth and reproductive rates in plants and animals, and neurological effects in vertebrates.

Draft Programmatic Environmental Impact Report                                                                              103
San Joaquin Council of Governments 2018 Regional Transportation Plan/ Sustainable Communities Strategy c. Other Pollutants Diesel engine fuel combustion emits particulate matter, referred to as diesel particulate matter (DPM) that can be very small and readily respirable. The particles have hundreds of chemicals adsorbed onto their surfaces, including many known or suspected mutagens and carcinogens (CARB 2016a). Both short and long-term exposure to DPM can result in adverse health effects. Short-term exposure may cause irritation to the eyes, nose, throat and lungs and exacerbate asthma, while chronic exposure has been shown to lead to lung inflammation and cellular changes in animals and has been linked to cancer (U.S. EPA 2017a). Statewide, DPM is estimated to result in 1,400 additional cases of cardiopulmonary death, 100 cases of cardiovascular hospitalization, 120 cases of respiratory hospitalization, and 600 cases of respiratory emergency room visits (CARB 2016a). Most major sources of diesel emissions, such as ships, trains, and trucks, operate in and around ports, rail yards, and heavily traveled roadways. DPM is identified by CARB as a toxic air contaminant (TAC) (CARB 2016a). Besides DPM, several other pollutants emitted by vehicle exhaust are a public health concern. The U.S. EPA has identified five pollutants of highest priority in addition to DPM: acrolein, acetaldehyde, formaldehyde, benzene, and 1,3-butadiene. The latter five pollutants are found in organic gases emitted by vehicles. d. Odors Typically, odors are regarded as an annoyance rather than a health hazard. However, manifestations of a person’s reaction to foul odors can range from psychological (e.g., irritation, anger, or anxiety) to physiological (e.g., circulatory and respiratory effects, nausea, vomiting, and headache). The ability to detect odors varies considerably among the population and overall is quite subjective. Some individuals have the ability to smell minute quantities of specific substances; others may not have the same sensitivity but may have sensitivities to odors of other substances. In addition, people may have different reactions to the same odor; in fact, an odor that is offensive to one person (e.g., from a fast-food restaurant) may be perfectly acceptable to another. It is also important to note that an unfamiliar odor is more easily detected and is more likely to cause complaints than a familiar one. This is because of the phenomenon known as odor fatigue, in which a person can become desensitized to almost any odor and recognition only occurs with an alteration in the intensity. Quality and intensity are two properties present in any odor. The quality of an odor indicates the nature of the smell experience. For instance, if a person describes an odor as flowery or sweet, then the person is describing the quality of the odor. Intensity refers to the strength of the odor. For example, a person may use the word “strong” to describe the intensity of an odor. Odor intensity depends on the odorant concentration in the air. When an odorous sample is progressively diluted, the odorant concentration decreases. As this occurs, the odor intensity weakens and eventually becomes so low that the detection or recognition of the odor is quite difficult. At some point during dilution, the concentration of the odorant reaches a detection threshold. An odorant concentration below the detection threshold means that the concentration in the air is not detectable by the average human. e. Sensitive Receptors A sensitive receptor is a location where human populations, especially children, seniors, and sick persons, are present and where there is a reasonable expectation of continuous human exposure to pollutants. Examples of sensitive receptors include residences, hospitals, and schools. 104
Environmental Impact Analysis
                                                                                                     Air Quality

f. Ambient Air Quality
The federal and state governments have established ambient air quality standards for the
protection of public health. The U.S. EPA has set primary national ambient air quality standards
(NAAQS) for ozone, CO, nitrogen dioxide (NO2), sulfur dioxide (SO2), particulate matter with a
diameter of up to ten microns (PM10) and up to 2.5 microns (PM2.5), and lead (Pb). Primary
standards are those levels of air quality deemed necessary, with an adequate margin of safety, to
protect public health. In addition, California has established ambient air quality standards for these
and other pollutants, which are typically more stringent than the federal standards. Table 6 lists the
current federal and State standards for regulated pollutants.

Table 6      Federal and State Ambient Air Quality Standards
 Pollutant                            Averaging Time   Federal Primary Standards           California Standards

 Ozone                                1-Hour                          −                          0.09 ppm
                                      8-Hour                  0.070 ppm                         0.070 ppm
 CO                                   8-Hour                    9.0 ppm                            9.0 ppm
                                      1-Hour                   35.0 ppm                          20.0 ppm
 NO2                                  Annual                  0.053 ppm                         0.030 ppm
                                      1-Hour                  0.100 ppm                          0.18 ppm
 SO2                                  Annual                          −                                   −
                                      24-Hour                         −                          0.04 ppm
                                      1-Hour                  0.075 ppm                          0.25 ppm
                                                                                                            3
 PM10                                 Annual                         ---                         20 µg/m
                                                                         3                                  3
                                      24-Hour                 150 µg/m                           50 µg/m
                                                                         3                                  3
 PM25                                 Annual                   12 µg/m                           12 µg/m
                                                                         3
                                      24-Hour                  35 µg/m                                    −
                                                                                                            3
 Lead                                 30-Day                          −                          1.5 µg/m
                                                                         3
                                      3-Month                0.15 µg/m                                    −
 Visibility-Reducing Particles        −                               −               Extinction coefficient of
                                                                                      0.23 per kilometer - visibility
                                                                                      of 10 miles or more due to
                                                                                      particles when relative
                                                                                      humidity is less than 70
                                                                                      percent.
                                                                                                            3
 Sulfates                             24-Hour                         −                          25 µg/m
 Hydrogen Sulfide                     1-Hour                          −                          0.03 ppm
 Vinyl Chloride                       24-Hour                         −                          0.01 ppm
 ppm = parts per million;
 µg/m3 = micrograms per cubic meter
 Source: CARB 2016b

Draft Programmatic Environmental Impact Report                                                                      105
San Joaquin Council of Governments 2018 Regional Transportation Plan/ Sustainable Communities Strategy The U.S. EPA and CARB designate air basins, or portions of air basins, and counties as being in “attainment” or “nonattainment” for each of the criteria pollutants. Nonattainment areas are ranked as marginal, moderate, serious, severe, or extreme according to the degree of nonattainment. Areas that do not meet the standards shown in Table 6 are classified as nonattainment areas. The NAAQS (other than ozone, PM10, PM2.5, and those based on annual averages or arithmetic mean) are not to be exceeded more than once per year; the NAAQS for ozone, PM10, PM2.5 are based on statistical calculations over one- to three-year periods, depending on the pollutant. The California Ambient Air Quality Standards (CAAQS) are not to be exceeded during a three-year period. The determination of whether an area meets state and federal standards is based on air quality monitoring data. Some areas are unclassified, which means there is insufficient monitoring data for determining attainment or nonattainment. Unclassified areas are typically treated as being in attainment. Because the attainment/nonattainment designation is pollutant specific, an area may be classified as nonattainment for one pollutant and attainment for another. Similarly, because the State and federal standards differ, an area could be classified as in attainment for the federal standards of a pollutant and nonattainment for the State standard of the same pollutant. Table 7 summarizes the SJVAB’s attainment status for federal and State criteria pollutant standards. As indicated in the table, the SJVAB is currently in nonattainment of the following standards (SJVAPCD 2012b): State one-hour ozone State and federal eight-hour ozone State 24-hour PM10 State and federal PM2.5 The SJVAB is classified as being in nonattainment for the state one-hour ozone standard, federal and state eight-hour ozone standards, the state PM10 standard, and the federal and state 24-hour and annual PM2.5 standards. Table 7 Criteria Pollutant Attainment Status for San Joaquin Valley Air Basin Pollutant NAAQS CAAQS Ozone – 1 hour None Nonattainment/Severe Ozone – 8 hour Nonattainment Nonattainment CO Attainment/Unclassified Attainment NO2 Attainment/Unclassified Attainment SO2 Unclassified Attainment PM10 Attainment Nonattainment PM2.5 Nonattainment Nonattainment Lead (Pb) Attainment/Unclassified Attainment Sulfates None Attainment Hydrogen Sulfide None Unclassified Visibility-Reducing Particles None Unclassified Vinyl Chloride None Attainment Source: SJVAPCD 2012 106
Environmental Impact Analysis
                                                                                         Air Quality

g. Air Quality Monitoring
The SJVAPCD and CARB maintain four air quality-monitoring sites in San Joaquin County: Hazelton
Street, Stockton; Airport, Tracy; Wagner/Holt, Stockton; and 530 Fishback Road, Manteca. Figure 8
shows the locations of air quality monitoring stations in the SJVAB. Table 8 summarizes the top four
maximum daily concentrations of criteria pollutants throughout San Joaquin County in 2014, 2015,
and 2016. Table 9 and Table 10 show the emissions inventory and forecast for ROG, NOX, and PM2.5
and PM10 within the SJVAB, respectively.

Figure 8 SJVAB Air Quality Monitoring Stations (2017)

Draft Programmatic Environmental Impact Report                                                   107
San Joaquin Council of Governments
2018 Regional Transportation Plan/ Sustainable Communities Strategy
Table 8 Maximum Sampled Pollutant Concentrations for San Joaquin County (2014-
2016)
Pollutant 2014 2015 2016
8-Hour Ozone (ppm), 8-Hour Average 0.084 0.091 0.092
Number of days of State exceedances (>0.070 ppm) 17 21 19
Number of days of Federal exceedances (>0.070 ppm) 17 21 19
Ozone (ppm), Worst Hour 0.097 0.107 0.109
Number of days of State exceedances (>0.10 ppm) 1 4 4
Nitrogen Dioxide (ppb) - Worst Hour 66.9 58 64.1
Number of days of State exceedances (>180 ppb) 0 0 0
3 1
Particulate Matter 10 microns, µg/m , Worst 24 Hours 109.0 107.3 71.7
3 2
Number of samples of State exceedances (>50 µg/m ) 3 4 5
3
Number of samples of Federal exceedances (>150 µg/m ) 0 0 0
3
Particulate Matter 35 µg/m ) 17 18 7
1
Maximum PM10 data is taken from the Manteca-530 Fishback Rd Station monitoring results.
2
Because no State monitoring data is available for the Manteca-530 Fishback Rd Station, the number of State exceedances is taken
from the Stockton-Hazelton Street Station.
Source: CARB 2017a
Table 9 Emissions Inventory and Forecasts for ROG and NOX
Annual Average Emissions (tons/day)
2013 2017 2020 2022
ROG 324.4 301.6 296.4 294.8
NOX 318.1 237.5 208.3 185.2
PM2.5 63.4 60.0 60.0 59.5
Source: SJVAPCD 2016a
Table 10 Emissions Inventory and Forecasts for PM10
Annual Average Emissions (tons/day)
Tons/Day 2000 2005 2010 2020
PM10 (All Sources) 324.0 284.6 282.4 290.3
Source: SJVAPCD 2007
108Environmental Impact Analysis
Air Quality
h. Regulatory Setting
Air quality in the County is addressed through the efforts of various federal, state, regional, and
local government agencies. The agencies primarily responsible for improving the air quality within
the County include the U.S. EPA, CARB, SJVAPCD, and the SJCOG. These agencies work jointly, as
well as individually, to improve air quality through legislation, regulations, planning, policy-making,
education, and a variety of programs. The agencies primarily responsible for improving the air
quality within San Joaquin County are discussed below, along with their individual responsibilities.
Federal
The U.S. EPA is responsible for enforcing the CAA and establishing National Ambient Air Quality
Standards (NAAQS), as required under the 1977 CAA and subsequent amendments. The U.S. EPA
regulates emission sources that are under the exclusive authority of the federal government, such
as aircraft, ships, and certain types of locomotives. The agency has jurisdiction over emission
sources outside state waters (e.g. beyond the outer continental shelf) and establishes various
emission standards, including those for vehicles sold in states other than California. Automobiles
sold in California must meet the stricter emission standards established by CARB.
As part of its enforcement responsibilities, the U.S. EPA requires each state with areas that do not
meet the federal standards to prepare and submit a State Implementation Plan (SIP) that
demonstrates the means to attain the federal standards. The SIP must integrate federal, state, and
local plan components and regulations to identify specific measures to reduce pollution, using a
combination of performance standards and market-based programs within the time frame
identified in the SIP.
State
In California, CARB is responsible for meeting the state requirements of the federal CAA,
administering the California CAA, and establishing the California Ambient Air Quality Standards
(CAAQS). The California CAA, as amended in 1992, requires all air districts in the state to endeavor
to achieve and maintain the CAAQS. The CAAQS are generally more stringent than the
corresponding federal standards and incorporate additional standards for sulfates, hydrogen sulfide,
vinyl chloride, and visibility reducing particles. CARB regulates mobile air pollution sources, such as
motor vehicles. The agency is responsible for setting emission standards for vehicles sold in
California and for other emission sources, such as consumer products and certain off-road
equipment. CARB established passenger vehicle fuel specifications, which became effective in
March 1996. In addition, the California Legislature enacted Senate Bill 656 (SB 656) to reduce public
exposure of airborne particulate matter in 2003, which required CARB to develop and adopt a list of
readily available, feasible, and cost-effective control measures that could be employed by CARB and
local air districts. CARB oversees the functions of local air pollution control districts and air quality
management districts, which in turn administer air quality activities at the regional and county level.
Regional and Local
The SJVAPCD is the agency responsible for monitoring and regulating air pollutant emissions from
stationary, area, and indirect sources throughout the SJVAB. Under state law, the SJVAPCD is
required to prepare a plan for air quality improvement for pollutants for which the SJVAPCD is in
non-compliance. SJVAPCD has adopted numerous air quality plans to reduce ozone and particulate
Draft Programmatic Environmental Impact Report 109San Joaquin Council of Governments
2018 Regional Transportation Plan/ Sustainable Communities Strategy
precursor emissions since 1992. The following list provides the latest plan iterations to address
attainment of different standards for which the Basin is in nonattainment (SJVAPCD 2016b, 2017):
2016 Plan for the 2008 8-hour Ozone Standard (adopted June 2016). Ensures attainment of
federal 2008 8-hour ozone standard (0.075 ppm) by December 31, 2031. The Ozone Plan
describes a comprehensive stationary and mobile source control strategy to reduce NOX
emissions by over 60 percent between 2012 and 2031.
2013 Plan for the Revoked 1-Hour Ozone Standard (adopted September 2013). Ensures
attainment of the now revoked 1-hour federal ozone standard (0.124 ppm).
2017 PM Plans (in preparation). Will provide a single comprehensive attainment plan that
addresses multiple PM2.5 standards under the FCAA (1997, 2006, and 2012 federal annual
PM 2.5 standards), and the 1987 federal annual PM10 standard.
2016 Moderate Area Plan for the 2012 PM2.5 Standard (adopted September 2016). Ensures
attainment of the federal annual PM2.5 standard of 12 µg/m3 established in 2012. The
Moderate Area Plan addresses the fact that attainment of the 2012 PM2.5 standard by 2021
is impracticable and is physically impossible given that critical mobile source regulations,
such as CARB regulations for trucks, buses, and off-road engines, would not be fully
implemented until 2023.
2015 Plan for the 1997 PM2.5 standard (adopted April 2015). Ensures attainment of 1997
federal annual PM2.5 standard of 15 µg/m3 and 24-hour PM2.5 standard of 65 µg/m3.
2012 PM2.5 Plan (adopted December 2012). Addresses federal 24-hour PM2.5 standard of 35
µg/m3 established in 2006.
In addition to preparing planning documents to ensure attainment of federal and state standards,
the SJVAPCD sets rules and regulations to support attainment of standards and address air quality
issues. Applicable rules and regulations including the following:
Regulation VIII – Fugitive PM10 Prohibition. This regulation requires actions to prevent,
reduce, or mitigate fugitive dust emissions associated with human activities, including
construction and earthmoving activities.
Rule 8021 – Construction, Demolition, Excavation, Extraction, and other Earthmoving
Activities. This rule requires that appropriate measures be implemented during
construction, demolition, excavation, extraction, or other earthmoving activities, to
ensure that visible dust emissions (VDE) do not exceed 20% opacity. Control measure
options include watering of exposed surface areas, application of chemical/organic
stabilizers, constructing wind barriers, restricting vehicles from the site, and establishing
a speed limit of 15 miles per hour on unpaved access/haul roads. Rule 8021 also
establishes administrative requirements, such as a Dust Control Plan for residential
development involving 10 acres or more of disturbed surface area, non-residential
development involving 5 acres or more, or for any project that would relocate more
than 2,500 cubic yards per day of bulk materials on at least three days.
Regulation IX – Mobile and Indirect Sources. This regulation encompasses a number of
regulations that apply to mobile and indirect sources including the following:
Rule 9120 – Transportation Conformity. This rule specifies criteria and procedures for
determining the conformity of highway and transit plans and projects funded by the US
DOT, MPOs, or other recipients of funds under Title 23, United States Code or the
Federal Transit Act, with SJVAPCD implementation plans.
110Environmental Impact Analysis
Air Quality
Rule 9410 – Employer Based Trip Reduction. This rule requires employers with at least
100 employees to develop and implement an Employer Trip Reduction Implementation
Plan (eTRIP). The rule provides a menu of measures that can be incorporated into the
eTRIP to encourage employees to use alternative transportation and ridesharing, such
as registering with a local rideshare agency, internal ride matching, and providing onsite
food service or childcare. Each measure is allotted a certain amount of points and the
employer must achieve a total of either 100 or 250 points, depending on the type of
work site.
Rule 9510 – Indirect Source Review. The Indirect Source Review (ISR) rule, which went
into effect March 1, 2006, requires developers of new residential, commercial, and
industrial projects to reduce smog-forming and particulate emissions generated by their
projects. The ISR rule also applies to transportation and transit projects whose
construction exhaust emissions would result in a total of two or more tons per year of
NOX or PM10. The rule requires developers to reduce construction NOX and PM10 exhaust
emissions by 20 percent and 45 percent, respectively, and reduce operational NOX and
PM10 emissions by 33.3 percent and 50 percent, respectively, as compared to the
unmitigated baseline.
County and City General Plans
A General Plan Air Quality element is required for all jurisdictions in the SJVAPCD. The Air Quality
Element is intended to protect the public’s health and welfare by implementing measures that allow
the SJVAPCD to attain Federal and State air quality standards. To achieve this goal, the Element sets
forth a number of policies and standards to reduce current pollution emissions and to require new
development to include measures to comply with air quality standards. Policies include preparing
local plans to achieve air quality standards, enforcing SJVAPCD regulations and guidance, monitoring
air pollutants, implementing dust control practices for construction sites, and encouraging
transportation alternatives to motor vehicles.
4.3.2 Impact Analysis
a. Significance Thresholds and Methodology
Significance Thresholds
The SJVAPCD has established the following significance thresholds for construction and operational
emissions from individual projects:
Construction and Operational Thresholds
100 tons per year of CO
10 tons per year of NOX
10 tons per year of ROG
27 tons per year of SOX
15 tons per year of PM10
15 tons per year of PM2.5
Draft Programmatic Environmental Impact Report 111San Joaquin Council of Governments 2018 Regional Transportation Plan/ Sustainable Communities Strategy Because the 2018 RTP/SCS is a programmatic document and would not directly generate emissions, SJVAPCD significance thresholds do not apply in determining the significance of emissions associated with the 2018 RTP/SCS. However, individual projects included in the 2018 RTP/SCS undergoing CEQA review would be subject to these thresholds. State and federal clean air laws require that emissions of pollutants for which national or state ambient air quality standards are violated be reduced from current levels. Therefore, for the purposes of this EIR, SJCOG has determined that adoption and/or implementation of the proposed 2018 RTP/SCS (including adoption of the RTP policies, adoption of the SCS, and adoption of the transportation project list and financing plan) could result in significant adverse impacts to air quality if any of the following would occur: 1. Projected long-term emissions of criteria pollutants are greater than current emission levels; 2. Projected short-term emissions of criteria pollutants (construction of transportation projects and anticipated development) would result in substantial levels of criteria pollutant emissions; 3. Projected long-term emissions of toxic air contaminants (DPM from heavy-duty diesel trucks and other emissions from industrial activities) are greater than current emission levels; 4. Localized concentrations of toxic air contaminants at sensitive receptors (short-term and/or long- term) exceed existing conditions; and/or 5. Projected long-term emissions would be considered to be cumulatively significant if they are not consistent with the local air quality management plans and state implementation plans. Short-Term Emissions Methodology Emissions from construction activities represent temporary impacts that are typically short in duration and depend on the size, phasing, and type of project. Air quality impacts can nevertheless be acute during construction periods, resulting in significant localized impacts to air quality. Construction-related emissions are speculative at the RTP level because such emissions are dependent on the characteristics of individual projects. However, because implementation of the 2018 RTP/SCS would generate temporary criteria pollutant emissions, primarily due to the operation of construction equipment and truck trips, a qualitative analysis is provided. Long-Term Emissions Methodology The methodology for determining the significance of air quality impacts compares baseline conditions (i.e., 2015, the baseline year utilized in traffic modeling) to the future RTP/SCS conditions in 2042, as required in CEQA Section 15126.2(a). Air emissions from mobile sources were calculated using CARB’s EMFAC 2014 model and regional vehicle miles travelled (VMT) calculated using the San Joaquin Valley Model Improvement Plan, Phase 2 (VMIP2), which incorporates land use, socioeconomic growth projections, interregional travel, and adjustments to reflect employment density, intersection density, and access to jobs and houses. EMFAC 2014 was developed by CARB and accommodates mobility assumptions (e.g., vehicle speed, delay times, average trip lengths, time of day, and total travel time) provided by VMIP2. 112
Environmental Impact Analysis
                                                                                                                 Air Quality

b. Project Impacts and Mitigation Measures
This section evaluates generalized air quality impacts associated with the 2018 RTP/SCS. Due to the
programmatic nature of the 2018 RTP/SCS, a precise, project-level analysis of the specific impacts
associated with individual transportation and land use projects is not possible at this time.

Threshold 1: Projected long-term emissions of criteria pollutants are considered significant if they
             are greater than current emission levels

IMPACT AQ-1            IMPLEMENTATION OF THE 2018 RTP/SCS WOULD REDUCE OZONE PRECURSOR AND PM2.5
EMISSIONS FROM MOBILE SOURCES COMPARED TO 2015 EXISTING CONDITIONS. HOWEVER, THE 2018
RTP/SCS WOULD RESULT IN INCREASED PM10 EMISSIONS RELATIVE TO EXISTING CONDITIONS. IMPACTS
WOULD BE SIGNIFICANT BUT MITIGABLE.

The 2018 RTP/SCS would alter mobile source emissions of criteria pollutants by implementing traffic
improvement projects and promoting more compact growth with greater infill development in
proximity to transit. Table 11 summarizes the emission levels (tons/day) of criteria pollutants under
baseline (2015) conditions and 2042 with 2018 RTP/SCS conditions. As shown below, all criteria
pollutants are expected to decrease under 2042 conditions with the project, except for PM10, which
would minimally increase by about 0.1 ton per day.

Table 11 Regional On-Road Motor Vehicle Emissions of Criteria Pollutants
                                                                                                           1
 Scenario                               ROG (tons/day)          NOX (tons/day)          PM10 (tons/day)           PM2.5 (tons/day)

 2015 SJCOG Baseline                              7.2                  17.3                       1.2                     0.61

 2042 with 2018 RTP/SCS                           2.0                   4.2                       1.3                     0.53

 Net change                                       -5.2                -13.1                     +0.1                     -0.08
 1
     PM10 includes emissions from exhaust only.
 Notes: The modeling season providing the highest pollutant levels was used for each criteria pollutant: ROG (summer), NOx (winter),
 PM10 (annual), PM2.5(winter).

SJVAPCD Rule 9510 (ISR) requires developers of new residential, commercial, and industrial projects
to reduce operational NOX and PM10 emissions by 33.3 percent and 50 percent, respectively, as
compared to the unmitigated baseline. In addition, SJVAPCD Rule 9410 requires employers with at
least 100 employees to develop and implement an Employer Trip Reduction Implementation Plan
(eTRIP) to reduce employee trees. Enforcement of these rules would reduce PM10 emissions
associated with implementation of the 2018 RTP/SCS. However, because individual project details
are not known at this time, it is possible that impacts from development of the envisioned land use
scenario would remain potentially significant even with implementation of applicable rules.

Mitigation Measure
For transportation projects under their jurisdiction, SJCOG shall implement, and transportation
project sponsor agencies can and should implement, the following mitigation measure developed
for the 2018 RTP/SCS program where applicable for transportation projects involving construction
activities. Local agencies in the SJCOG region can and should implement this measure, where
relevant, to land use projects implementing the 2018 RTP/SCS.

Draft Programmatic Environmental Impact Report                                                                                     113
San Joaquin Council of Governments
2018 Regional Transportation Plan/ Sustainable Communities Strategy
AQ-1 Long-term PM10 Emission Reductions
Project Sponsors shall require project proponents to demonstrate compliance with SJVAPCD Rules
9510 and 9410, if applicable, prior to the issuance of grading/building permits for individual
projects. In addition, implementing and local agencies shall require projects that would exceed
SJVAPCD significance thresholds for operational PM10 emissions after implementation of applicable
rules to enter into a Voluntary Emission Reduction Agreement (VERA) with the SJVAPCD to reduce
PM10 emissions to below threshold level, as described in the SJVAPCD’s Guidance for Assessing and
Mitigating Air Quality Impacts (GAMAQI). A VERA is a mitigation measure by which the project
proponent provides pound-for-pound mitigation of air emissions increases through a process that
funds and implements emission reduction projects by the SJVAPCD.
Significance After Mitigation
With implementation of the above mitigation, impacts related to long-term PM10 emissions would
be less than significant.
Threshold 2: Projected short-term emissions of criteria pollutants (from construction of
transportation projects and anticipated development) are considered to be
significant if they would result in substantial criteria pollutant emissions
IMPACT AQ-2 IMPLEMENTATION OF THE TRANSPORTATION PROJECTS AND LAND USE PATTERN ENVISIONED
IN THE 2018 RTP/SCS WOULD INVOLVE CONSTRUCTION ACTIVITIES THAT WOULD GENERATE SHORT-TERM
EMISSIONS OF CRITERIA POLLUTANTS. IMPACTS WOULD BE SIGNIFICANT BUT MITIGABLE.
Implementation of the 2018 RTP/SCS would involve construction activities related to transportation
improvements, as well as general construction as part of regional growth. These construction
activities would result in short-term emissions of air pollutants including ROGs, NOx, PM10, PM2.5
and fugitive dust from operation of construction equipment, employee and vendor vehicle trips,
demolition, grading and other ground-disturbing activities, application of paint and other coatings,
paving, and other activities.
Individual projects would be required to comply with SJVAPCD regulations to reduce air quality
impacts associated with construction activities, such as Regulation VIII, which establishes control
measures for fugitive dust, and Rule 9510 (ISE), which requires developers and transportation
projects meeting applicability criteria to reduce on-site construction NOX and PM10 emissions by 20
percent and 45 percent, respectively, or pay fees to fund off-site mitigation of the remaining
balance of emission reductions required. In addition, the SJVAPCD has established quantitative
significance thresholds for construction emissions that would apply to individual projects
undergoing CEQA review . However, given the unknown scale of construction and timing of
individual projects, it is possible that construction emissions of criteria pollutant emissions could
create or substantially contribute to a short-term exceedance of ambient air quality standards.
Impacts would be potentially significant, but mitigable.
Mitigation Measure
For transportation projects under their jurisdiction, SJCOG shall implement, and transportation
project sponsor agencies can and should implement, the following mitigation measure developed
for the 2018 RTP/SCS program where applicable for transportation projects involving construction
activities. Local agencies in the SJCOG region can and should implement this measure, where
relevant, to land use projects implementing the 2018 RTP/SCS.
114Environmental Impact Analysis
Air Quality
AQ-2 Short-term Criteria Pollutant Emission Reductions
Implementing and local agencies shall require project proponents to demonstrate that they have
obtained all required permits from the SJVAPCD prior to the issuance of grading/building permits for
individual projects and that all construction activities will continuously comply with applicable
regulatory standards, including, but not limited to SJVAPCD Regulation VIII, “Control Measures for
Construction Emissions of PM10,” and ISR. In addition, Implementing and local agencies require
projects that would exceed SJVAPCD significance thresholds for construction emissions to enter into
a VERA with the SJVAPCD, as described in the SJVAPCD’s GAMAQI.
Significance After Mitigation
With implementation of the above mitigation, impacts related to short-term construction emissions
from individual projects would be less than significant.
Threshold 3: Projected long-term emissions of toxic air contaminants (diesel particulate matter
from heavy-duty diesel trucks and other emissions from industrial activities) are
considered significant if they would be greater than current emission levels
IMPACT AQ-3 IMPLEMENTATION OF THE 2018 RTP/SCS WOULD REDUCE LONG-TERM EMISSIONS OF DIESEL
PARTICULATE MATTER (DPM) FROM MOBILE SOURCES. THIS IMPACT WOULD BE LESS THAN SIGNIFICANT.
Vehicle use is associated with a number of toxic air contaminants (TACs), including DPM, benzene,
1,3-butadiene, formaldehyde, acetaldehyde, acrolein, polycyclic organic matter (POM), and
naphthalene. Diesel particulate matter (DPM) is the primary TAC and is emitted in the exhaust of
diesel-powered vehicles. DPM is primarily composed of very fine particles, with more than 90
percent of DPM being less than one micron in diameter. Since particles less than 2.5 microns in
diameter are categorized as PM2.5, this means that over 90 percent of DPM is in the form of PM2.5,
with less than 10 percent existing as PM10; PM10 emissions from mobile sources mainly result from
tire wear, brake dust, and road dust being re-entrained rather than from fuel combustion.
Therefore, PM2.5 emissions are used as a proxy for DPM emissions in this analysis. The remaining
TACs are primarily ROGs and generally components of vehicle exhaust, though a small portion occur
as fugitive emissions that are emitted during fueling or fuel transport. Fugitive emissions of TACs are
relatively minor in amount, and would not be considered likely to affect the overall rate of TAC
emissions.
In order to more closely evaluate DPM emissions, PM2.5 emissions from heavy-duty diesel vehicles
(the primary source of DPM) were estimated using the EMFAC 2014 model. Table 12 summarizes
PM2.5 emissions from heavy-duty diesel vehicles under existing conditions and 2042 with project
conditions; 2042 conditions without the project are also included for informational purposes. PM2.5
emissions from heavy-duty diesel vehicles would be lower in 2042 with the 2018 RTP/SCS than
under existing conditions. This impact would be less than significant.
Draft Programmatic Environmental Impact Report 115San Joaquin Council of Governments
2018 Regional Transportation Plan/ Sustainable Communities Strategy
Table 12 PM2.5 Emissions from Heavy-Duty Diesel Vehicles
Scenario PM2.5 (tons/day)
2015 SJCOG Baseline 0.26
2042 with 2018 RTP/SCS 0.11
Net change -0.15
Notes: The modeling season providing the highest levels of criteria pollutants was used for PM2.5(winter).
Mitigation Measures
No Mitigation Measures are required.
Significance After Mitigation
Impacts would be less than significant without mitigation.
Threshold 4: Localized concentrations of toxic air contaminants at sensitive receptors (short-term
and/or long- term) are considered significant if they would exceed existing conditions
IMPACT AQ-4 IMPLEMENTATION OF THE 2018 RTP/SCS MAY RESULT IN INCREASED EXPOSURE OF SENSITIVE
RECEPTORS TO DIESEL PARTICULATE MATTER (DPM) FROM MOBILE SOURCES. IMPACTS WOULD BE SIGNIFICANT
BUT MITIGABLE.
The 2018 RTP/SCS would result in the construction of new roadways or widening of existing
roadways that may occur in proximity to existing sensitive receptors. In addition, as a result of 2018
RTP/SCS policies and the selected land use scenario, the anticipated growth pattern in the SJCOG
region would concentrate population adjacent to transit and other transportation facilities that
could result in more people being exposed to elevated health risks and nuisance odors relative to
existing conditions. Populations residing close to freeways or busy roadways may experience
adverse health effects beyond those typically found in urban areas. In the Air Quality and Land Use
Handbook: A Community Health Perspective (CARB 2011), CARB recommends avoiding siting new
sensitive land uses, such as residences, schools, daycare centers, playgrounds, or medical facilities,
within 500 feet of a freeway, urban roads with 100,000 vehicles/day, or rural roads with 50,000
vehicles/day. California freeway studies show about a 70 percent drop-off in particulate pollution
levels at 500 feet (CARB 2005). Vehicle delay, especially along corridors near sensitive residential
receptors, can also increase idling emissions and associated health risks for nearby receptors from
roadways.
The CARB has several programs and regulations in place to reduce DPM and TAC emissions from
mobile sources statewide, including the Diesel Risk Reduction Plan (CARB 2010) and Advanced Clean
Cars Program (CARB 2017b). These programs include measures such as enforced retrofit of diesel
particulate filters, replacement of older trucks and buses, requirements for lower emissions on new
diesel vehicles, inspection programs, idling restrictions, and other programs for marine and off-road
diesel vehicles. These programs and regulations would reduce air toxic emissions from mobile
sources over the horizon of the 2018 RTP/SCS. Nevertheless, in order to achieve the greatest VMT
reductions from a compact growth pattern, development must necessarily occur in close proximity
to public transit and major roadway corridors. Although the precise location and density of such
development is not known at this time, the proposed 2018 RTP/SCS may result in new sensitive
116Environmental Impact Analysis
Air Quality
receptors being sited close to existing and new hazardous air pollutant sources, potentially resulting
in substantial exposure to substantial hazardous air pollutant concentrations and nuisance odors.
Impacts would be significant but mitigable.
Mitigation Measure
For transportation projects under their jurisdiction, SJCOG shall implement, and transportation
project sponsor agencies can and should implement, the following mitigation measure developed
for the 2018 RTP/SCS program where applicable. Local agencies in the SJCOG region can and should
implement this measure, where relevant, to land use projects implementing the 2018 RTP/SCS.
AQ-3 Health Risk Reduction Measures
Consistent with the general guidance contained in CARB’s Air Quality and Land Use Handbook,
appropriate and feasible measures shall be incorporated into project building design for residential,
school and other sensitive uses located within 500 feet, or other distance as determined by the lead
agency, of freeways, heavily travelled arterials, railways and other sources of DPM, including
roadways experiencing significant vehicle delays (CARB 2005). The appropriate measures shall
include one or more of the following methods, as determined by a qualified professional, as
applicable:
The project sponsor shall incorporate health risk reduction measures based on analysis of individual
sites and project circumstances. These measures may include:
Avoid siting new sensitive land uses within 500 feet of a freeway, railway, or other source of
TACs.
Require development projects for new sensitive land uses to be designed to minimize exposure
to roadway-related pollutants to the maximum extent feasible through inclusion of design
components including air filtration and physical barriers.
Avoid locating sensitive receptors near the entry and exit points of a distribution center.
Locate structures and outdoor living areas for sensitive uses as far as possible from the source of
emissions. As feasible, locate doors, outdoor living areas, and air intake vents primarily on the
side of the building away from the freeway or other pollution source. As feasible, incorporate
dense, tiered vegetation that regains foliage year round and has a long life span between the
pollution source and the project.
Maintain a 50-foot buffer from a typical gas dispensing facility (under 3.6 million gallons of gas
per year).
Install, operate and maintain in good working order a central heating and ventilation (HV)
system or other air take system in the building or in each individual residential unit that meets
the efficiency standard of the MERV 13. The HV system should include the following features:
Installation of a high efficiency filter and/or carbon filter-to-filter particulates and other
chemical matter from entering the building. Either HEPA filters or ASHRAE 85% supply filters
should be used. Ongoing maintenance should occur.
Retain a qualified HV consultant or Home Energy Rating Systems (HERS) rater during the design
phase of the project to locate the HV system based on exposure modeling from the mobile
and/or stationary pollutant sources.
Achieve a performance standard of at least one air exchange per hour of fresh outside filtered
air.
Draft Programmatic Environmental Impact Report 117You can also read