OUR INNOVATION. YOUR ADVANTAGE - EquiLend
←
→
Page content transcription
If your browser does not render page correctly, please read the page content below

OUR INNOVATION. YOUR ADVANTAGE.

                                  1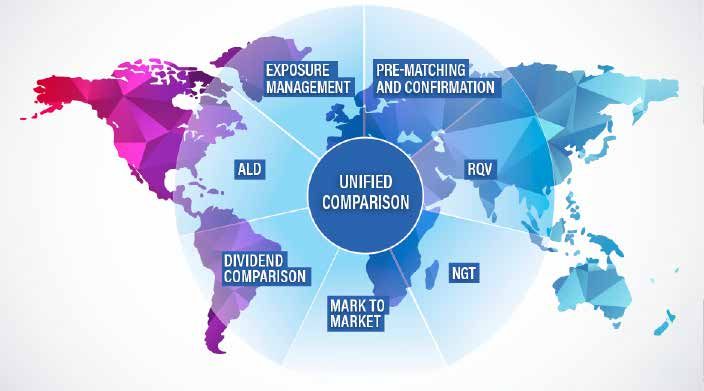
CONTENTS
                                 TRADING                                                                            4
                                 Next Generation Trading (NGT) is a multi-asset class trading platform
                                 for the securities finance marketplace. Accessed through NGT’s intuitive, Web-
                                 based user interface or via full automation using our proprietary messaging
                                 protocol, NGT offers access to global securities finance trading to firms of all sizes.

                                 SWAPTIMIZATION                                                                     7
      DAN DOUGHERTY              Swaptimization is a technology solution designed to provide automation to global
      MANAGING DIRECTOR,         equity total return swap (TRS) trading workflow.
        GLOBAL HEAD,
         SALES & CRM             COLLATERAL TRADING                                                                 9
                                 Equilend Collateral Trading is designed for funding or financing desks to effectively
          +1 212 901 2248        trade collateral. This platform, to be released in Q1 2020, will allow for a centralized
    dan.dougherty@equilend.com   way for clients to execute and manage trade structures with their counterparties.

                                 CLEARING                                                                           11
                                 EquiLend Clearing Services (ECS) provides direct connectivity to CCPs for central
                                 clearing of securities finance trades.

                                 POST TRADE                                                                         13
                                 EquiLend’s Post-Trade Suite (PTS) includes powerful tools that improve efficiency
                                 and mitigate risk. They integrate into a firm’s existing environment and can be
                                 fully automated.

                                 SFTR                                                                               24
                                 As leading providers of trading, confirmation and reporting solutions, EquiLend
                                 and TRAX are ideally placed to offer solutions around Unique Transaction Identifier
                                 (UTI) generation, timestamps and lifecycle events to help firms meet their SFTR
                                 reporting obligation.

                                 MARKET DATA                                                                        26
                                 DataLend provides aggregated, anonymized, cleansed and standardized securities
                                 finance data covering all asset classes, regions and markets globally. DataLend
         PAUL LYNCH              operates on a “give-to-get” model, processing more than 3 million global
                                 transactions per day.
      MANAGING DIRECTOR,
        GLOBAL HEAD              EQUILEND SPIRE                                                                     34
         OF PRODUCTS
                                 EquiLend Spire is a state-of-the-art platform and technology-driven hub for
           +1 212 901 2281       securities finance firms of all types, including agent lenders, prime brokers, retail
     paul.lynch@equilend.com     brokers, beneficial owners and collateral managers. Managing your securities
                                 finance business has never been more efficient.

2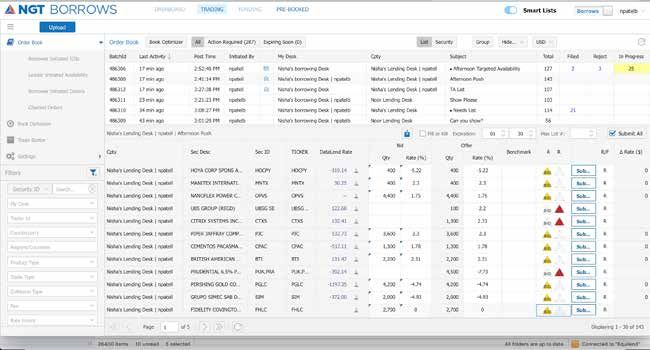
WHO WE ARE

  EquiLend is a global financial
     technology firm offering
   trading, post-trade, market
  data, regulatory and clearing
services for the securities finance,
 collateral and swaps industries.

                  EQUILEND | PRODUCTS AND SERVICES | 2021
                                                        3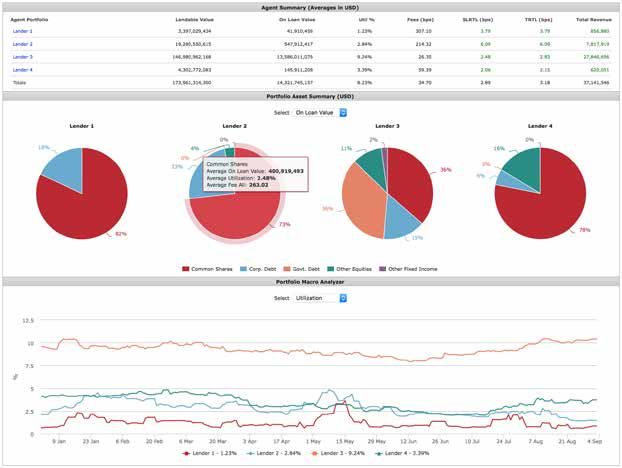
MICHAEL NORWOOD                                    JIM LAILEY
      ASSOCIATE DIRECTOR                                DIRECTOR
    PRODUCT OWNER, TRADING                         CRM, NORTH AMERICA

            +1 857 800 9551                             +1 646 767 4354
    michael.norwood@equilend.com                    jim.lailey@equilend.com

      NEXT GENERATION TRADING (NGT) is a multi-asset class
      trading platform for the securities finance marketplace.
      Accessed through NGT’s intuitive, Web-based user
      interface or via full automation using our proprietary
      messaging protocol, NGT offers access to global securities
      finance trading to firms of all sizes. With tens of thousands
      of trades conducted on the platform around the globe
      each day, NGT offers unparalleled liquidity in the securities
      finance market. NGT’s strategic features increase trade-
      level transparency, improve workflow automation and
      generate efficiencies market wide.

                                   BEST SECURITIES FINANCE
                                   TRADING PLATFORM
                                   GLOBALLY
                                   GLOBAL INVESTOR/ISF
                                   AWARDS 2012, 2013, 2014,
                                   2015, 2016, 2017, 2018, 2019,
                                   2020

4
KEY STATS                                                  STRATEGIC FEATURES
•   100+ firms globally using NGT                          •   Negotiation tools with real-time bid/offer workflow
•   NGT users based in 30+ locations around the            •   Trading on screen or via automated messaging
    globe                                                  •   Straight-through processing for trade decisions
•   Assets domiciled in 50+ markets traded on NGT              and bookings
•   $98bn notional on average traded on NGT each           •   Targeted Availability (TA): up-to-date, executable
    day (as of Q2 2020)                                        inventory
•   $170bn notional: highest notional traded in a single   •   Indications of interest (IOI): market discovery tool
    day on NGT on March 13, 2020                           •   Borrower-to-lender and broker-to-broker trade
                                                               flows
                                                           •   Flexible non-cash collateral communication
                                                           •   Streamlined static data setup and ongoing
                                                               maintenance

                                       NGT TRADE LIFE CYCLE

                                                           EQUILEND | PRODUCTS AND SERVICES | 2021
                                                                                                                      5
Book Optimizer allows a        Smart Lists use                   Users can easily toggle
user to filter a needs list    patterns in NGT activity          between screens to
against the availabilities     to streamline the                 conduct borrows and
shown for both a               availability lists shown          loans on the same
borrower or lender             to the borrower                   platform

    NGT offers a variety                                          Users can take action
    of filters such as                                            on orders sent to
    counterparty, collateral                                      them in the Order
    type and region/country                                       Book

                                             EQUILEND | PRODUCTS AND SERVICES | 2021
6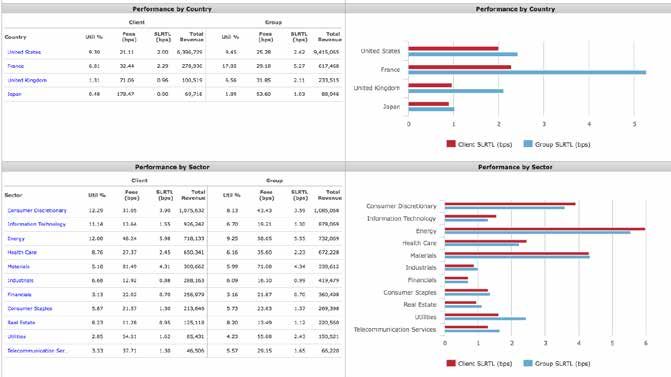
SWAPTIMIZATION

    NANCY ALLEN                           MATT COLLINS
        DIRECTOR                              DIRECTOR
 GLOBAL PRODUCT OWNER,                    MARKETS & TRADING
DATALEND & SWAPTIMIZATION
        +1 212 901 2262                       +1 646 767 4314
   nancy.allen@equilend.com              matt.collins@equilend.com

   SWAPTIMIZATION is a technology solution designed to
   provide automation to global equity total return swap (TRS)
   trading workflow. Swaptimization utilizes a proprietary
   matching algorithm to pair natural positions across market
   participants to facilitate bilateral security-based TRS in an
   efficient, centralized and scalable manner.
   Building off of EquiLend’s industry-leading and award-
   winning position in the secured financing and collateral
   trading technology marketplace, Swaptimization will deliver
   automation and efficiency to equity TRS trading. By using
   Swaptimization’s intuitive, Web-based user interface, access
   to liquidity is a few simple clicks away.

                                                                     7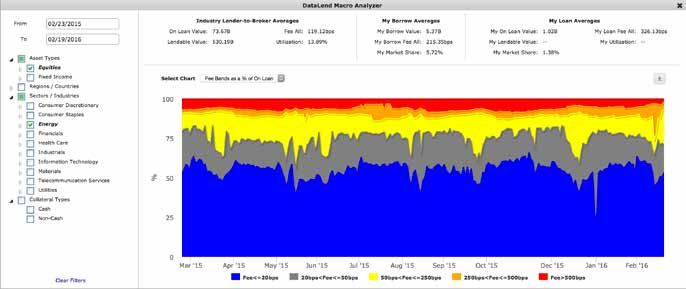
SWAPTIMIZATION
TRANSFORMING THE TOTAL                                 KEY ATTRIBUTES OF
RETURN SWAP WORKFLOW WITH                              SWAPTIMIZATION:
SWAPTIMIZATION:

•   Trade execution lifecycle management in single-    •   Proven track record in achieving standardization,
    name equity TRS                                        liquidity, scale and automation in the secured
                                                           funding market
•   Reset, maturity and unwind notifications
                                                       •   Global platform with connectivity available in the
•   Basket maintenance and advisory of key swap
                                                           United States, Europe and Asia
    attributes including corporate actions, upcoming
    resets and maturity dates                          •   Ease of onboarding for clients with existing
                                                           connectivity to EquiLend
•   Hard to borrow indicator for improved
    optimization                                       •   Offers ability to handle lifecycle management on
                                                           platform
•   Customization of term sheets
•   Data analytics and benchmarking of portfolio
    activity relative to the broader marketplace
•   Short sale restricted notifications
•   Read-only functionality for trade support and
    data-capture obligations

EASY ONBOARDING:
•   ISDA in place between bilateral counterparties
•   Sign one-page addendum to the EquiLend
    agreement to memorialize pricing
•   Supply EquiLend with user IP addresses for
    whitelisting

EQUILEND | PRODUCTS AND SERVICES | 2021
8
COLLATERAL TRADING
MICHAEL NORWOOD GRANT DAVIES
ASSOCIATE DIRECTOR DIRECTOR
PRODUCT OWNER, TRADING HEAD OF EUROPEAN SALES
+1 857 800 9551 +44 203 023 8383
michael.norwood@equilend.com grant.davies@equilend.com
EQUILEND COLLATERAL TRADING is designed for funding
or financing desks to effectively trade collateral. The platform
allows for a centralized way for firms to execute and manage
trade structures with their counterparties. The initial rollout
supports collateral upgrades and downgrades and will be
screen-based.
9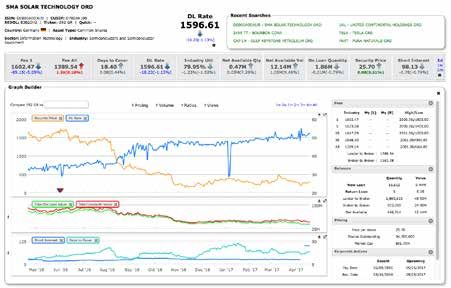
COLLATERAL TRADING
KEY STATS                                                 STRATEGIC FEATURES

•    Counterparties can post bids and/or offers for the   •   Market transparency and price discovery
     collateral upgrade or downgrade trade structure      •   A view into the basket trading environment does
•    Clients can negotiate and agree on fixed,                not exist today, and this will provide insight to
     evergreen and extendible trade baskets on the            potential trading opportunities
     platform                                             •   Efficiency and organization of basket trading all in
•    After the basket has been agreed, clients can            one place
     allocate the underlying basket constituents or       •   The ability to view balances across counterparties
     collateral and communicate it to one another             and manage their baskets efficiently in one venue
•    Throughout the tenure of the loan, clients
                                                          •   SFTR compliant
     can manage trade lifecycle events such as
     substitutions and transaction rolls                  •   Get UTI, LEI and timestamp information at the
                                                              point of trade for regulatory reporting compliance
                                                          •   Subsequent phases of this product will leverage
                                                              NGT technology for efficient straight-through
                                                              processing

EQUILEND | PRODUCTS AND SERVICES | 2021
10
MATT COLLINS JOHN SURGENT
DIRECTOR ASSOCIATE DIRECTOR
MARKETS & TRADING, ECS HEAD OF NA POST-TRADE SERVICES
+1 646 767 4314 +1 646 767 4325
matt.collins@equilend.com john.surgent@equilend.com
EQUILEND CLEARING SERVICES (ECS) provides direct
connectivity to CCPs for central clearing of securities
finance trades. Our services offer powerful trading and
post-trade tools that improve efficiency and mitigate
risk. They integrate into a firm’s existing environment and
can be fully automated. We currently have connections
to OCC and Eurex, and have delivered a solution that
is portable across CCPs globally. The ECS Gateway
provides a central point for all matched transactions to
flow directly to a CCP, while delivering real-time updates
on settlement back to clients. ECS also offers a front-to-
back solution from trade execution through the lifecycle
of the trade, including support for returns, recalls, rerates
and corporate actions.
11EQUILEND CLEARING SERVICES LOAN MARKET
THE EQUILEND CLEARING SERVICES (ECS) Loan Market currently offers the only CCP-based
securities lending market for U.S. equities, ETFs and ADRs. The ECS Loan Market provides activity
to OCC’s centrally cleared Market Loan Program for securities lending clearance and settlement
services. Integrating trade execution, clearance and settlement through the full trade lifecycle, the
ECS Loan Market enables U.S. broker-dealers to benefit from the centrally cleared model for their
securities lending business.
HOW IT WORKS BENEFITS
• Access all market services via an API connection or • Covers all OCC-eligible securities, including over
our Web-based application 6,000 underlying equities, ETFs and ADRs
• Identify market liquidity including the depth of the • Offers access to wide marketplace of U.S. broker-
market, last traded rate and floating rate versus dealer counterparties active in securities lending
OBFR overnight published rates • Facilitates CCP legal and credit intermediation
• Upload a spreadsheet with borrow needs or loan between lenders and borrowers, reduces balance
supply sheet risk profile and improves overall capital
footprint
• Execute trades on our proprietary trading
screens, custom built for securities lending market • Delivers fully automated, real-time, straight-through
participants settlement processing once trade is matched and
with near-time settlement status updates
• Lender supply and borrower demand are
automatically matched and immediately sent to • Enables flexible connectivity solutions, including
OCC for clearance and settlement API system-to-system services and browser-based
screen access
• Transact with all OCC Market Loan Program
approved counterparties • Improves operational efficiency through trading
and post-trade tools that ensure synchronization
• Supports lifecycle events, including returns, recalls,
of lender, borrower and CCP recordkeeping while
rerates, marks and corporate actions
eliminating contract comparison breaks
• Enhances risk mitigation for both borrowers and
lenders via the CCP guarantees
• Provided through Automated Equity Finance
Markets, Inc., a FINRA-regulated broker-dealer
operating an SEC-registered Alternative Trading
System (ATS) with a proven track record in
securities lending technology
HOW IT WORKS
EUREX CLEARING CONNECTIVITY
As a third-party flow provider, EquiLend Clearing Services (ECS) offers connectivity to Eurex
Clearing’s Lending CCP. ECS leverages EquiLend’s suite of trading and post-trade services
coupled with the ECS Gateway to allow for trade execution/matching and management
of all lifecycle events. ECS allows EquiLend’s market participants to leverage their existing
infrastructure to make the management of CCP activity consistent with traditional bilateral
activity.
HOW IT WORKS BENEFITS
• Clients conduct their normal bilateral trading • Provides access to Eurex Clearing’s Lending CCP
activity using the NGT platform. via a trusted technology provider
• Once both sides of the transaction match, the • Leverages existing EquiLend trading and post-
transaction is sent to the ECS Gateway and on to trade technology, simplifying the Lending CCP
Eurex Clearing for clearance and settlement. connection for current EquiLend users
• ECS will then communicate settlement, mark to • Fully automated, real-time status updates
market, billing and asset servicing information from • Automated best practice approaches to exposure
Eurex Clearing in real time to the counterparties. management, asset servicing and settlement risk
• The flexibility exists to allow for straight-through
• Global solution that can be used for many CCPs
processing for all activity or the use of our screen-
based solution. • Standard process for bilateral and CCP-novated
trades
EQUILEND | PRODUCTS AND SERVICES | 2021
12IAIN MACKAY ROWENA BROWN
DIRECTOR DIRECTOR
PRODUCT OWNER, CRM, EMEA
POST-TRADE SERVICES
+44 20 7426 4402 +44 20 7426 4412
iain.mackay@equilend.com rowena.brown@equilend.com
EquiLend’s POST-TRADE SUITE (PTS)
includes powerful tools that improve
efficiency and mitigate risk. They integrate
into a firm’s existing environment and can be
fully automated.
BEST POST-TRADE
CLIENT SERVICE GLOBALLY
Global Investor/ISF Awards 2018
INNOVATION IN SECURITIES
FINANCE AWARD
Global Custodian Leaders in
Custody Awards 2019
13ONEFILE is the flexible, transparent electronic communication between
EquiLend and our clients for post-trade services. The single start-of-day file
provides a seamless, multi-asset, one-entry access point to all existing post-trade
services and future post-trade developments.
Additional intra-day activity files facilitate real-time comparisons throughout
the day. This integration option will increase bilateral automation by expanding
real-time messaging for further simplification of the post-trade services within
EquiLend.
HOW IT WORKS STRATEGIC FEATURES
• Provides succinct data communication as • Minimizes clients’ technology costs to integrate
EquiLend will accept any file format from clients, with post-trade services
which is then translated to our standard protocols • Generates scalability for clients
• Simple adoption to new post-trade services • Easy to leverage future services without additional
• Enables streamlined two-way, real-time messaging build
between EquiLend and client • Real-time communication will help clients manage
their intraday risk more effectively
If clients do not want to miss out on the experience of
EquiLend’s new Post-Trade Suite, we can generate a
start-of-day OneFile equivalent from legacy Contract
Comparison files. This will allow the user to utilize the
Unified Comparison functionality while building out
to OneFile for additional real-time products.
Look out for this symbol for the services
compatible with OneFile.
14UNIFIED COMPARISON lets you interact with your post-trade system in
completely new ways. Its flexible, automated workflow management will liberate
break resolution, letting you choose precisely what you want to view and how
you want to communicate with your clients. Unified Comparison is the nucleus for
post-trade lifecycle management and a gateway into all the other PTS products
available within EquiLend. By connecting to Unified Comparison, you will reduce
downstream lifecycle noise and be positioned to adhere to future regulatory
initiatives.
HOW IT WORKS STRATEGIC FEATURES
• Fast connections for high performance Intra- • Supports all equity and fixed income products
day One File connectivity allows for fast data • Reconciles global pending trades to recognized
transfer, ensuring you are instantly connected industry standards
to all your necessary content
• Customizable filters and columns catering for
• Reduces clutter Unified Comparison is individual preferences
incredibly content rich, but with its dynamic • Multi-search capability to allow easy access to
filtering it allows you to focus on your key risk relevant data
initiatives effortlessly. It aggregates the data
• Ability to normalize non-vanilla activity
so that you can get a more complete and
succinct picture of all your client portfolios
• Easy visibility What is the best way to
improve your settlement rates or reduce your
P&L issues? Unified Comparison helps you
structure your workload. Priority columns
direct you to fix your most important breaks
first
EQUILEND | PRODUCTS AND SERVICES | 2021
15MARK-TO-MARKET COMPARISON allows users to compare mark values, prices
and other loan details for cash and non-cash loans. Customizable tolerances and
rules can be applied based on collateral currency and mark amount to auto-mark
records. Mark-to-Market Comparison offers the ability to automatically submit
Security Payment Order (SPO) charges directly from the screen to DTCC (for U.S.
securities). Prices for the comparison can be sent by the client or automatically
applied based on EquiLend’s pricing source.
HOW IT WORKS STRATEGIC FEATURES
• OneFile is leveraged to generate marks • Processes cash and non-cash mark records
comparison
• Flexible tolerances and rules may be applied for
• A matching and comparison algorithm will specific currencies
highlight breaks on the old price, new price,
• Easily reconcile in real time directly on the screens
quantity and mark amount that falls outside an
agreed-upon tolerance • Aggregated security-level view and lot-level detail
• Matched and matched-within-tolerance records • Ability to automatically submit Security Payment
are returned to both counterparties in a Order (SPO) charges directly from Mark-to-Market
standardized file, which can be integrated into a screen to DTCC
firm’s proprietary system • SPO charges stored online for 6 months with XLS
• Items that fall outside the specified tolerance can file download available
be reconciled on screen in real time • Interactive comments allow client and
• Total mark value figures are agreed upon for cash counterparty to record notes on a break
collateral movements • Reconciliation results can be automatically
• SPO charges for matched and reconciled records integrated into a firm’s proprietary system
are automatically sent to DTCC • A customizable browser interface, filters and
global actions facilitate a simplified online
reconciliation process
• Centralized pricing source option
16In many ways the automation of the post-trade life cycle has never been better.
Contracts are more regularly reconciled. Intraday reconciliation goes beyond
anything you may have previously imagined. But something happened as we
ventured into this exciting new world—the billing process got left behind.
Our goal with EquiLend BILLING was to engineer a complete end-to-end Billing
experience utilizing the lightest and most compact process seen to date. That
meant reimagining every step of the billing life cycle to make it easier for clients to
recoup their revenue within the current billing month. The result is more than just a
reconciliation product. It is a unique, flexible, integrated solution that allows clients
to communicate efficiently. EquiLend Billing has all you need to create, distribute
and reconcile your bills today.
HOW IT WORKS STRATEGIC FEATURES
Generate and distribute statements • Ability to create statements in both PDF and Excel
automatically. with automatic distribution
Connect either through a standard billing file • Billing dashboard to monitor progress across all
or leverage the existing Billing Comparison file. your global counterparts
Billing statements are automatically generated • Easy setup for faster implementation of service
and distributed on clients’ behalf to all their • Statements can be downloaded for reconciliation,
counterparts. The counterpart doesn’t even printing and storage for audit records
need to be an existing EquiLend client. • Detailed reconciliation screen both at security and
daily interaction level
Reconciliation. Payments. Tracking. You’re • Filters and Sorts on the browser help make the
covered. reconciliation process more efficient
Detailed, daily reconciliation of security breaks • On-screen visualization of outstanding payables
is a cinch. Use the interactive reconciliation and receivables
functionality to resolve the discrepancies and • Offers direct access to historical break detail on
agree the bill directly from the Billing screen. Unified Comparison
• Public comments provide the ability to record
All your life cycle events. One seamless notes on a break
product.
• Ability to reconcile up to 6 months of historical
EquiLend Billing works seamlessly with Unified statements
Comparison, allowing clients to easily transfer
• Facilitates reconciliation of multi-currency breaks
the reconciliation work already completed in
Unified Comparison into EquiLend Billing.
* Clients can leverage their existing legacy
Billing files to use the new functionality—no
new build!
EQUILEND | PRODUCTS AND SERVICES | 2021
17Compare dividend claims and payment details with DIVIDEND COMPARISON,
which highlights breaking information between two counterparties.
HOW IT WORKS STRATEGIC FEATURES
• Files are submitted by both counterparties • Data delivery by browser entry, FTP or XLS file
• Claims are compared and discrepancies identified upload
using a multi-step algorithm • Pre-advice offers payment instructions, which can
• Counterparties resolve breaks on the browser and be received by a firm’s proprietary system
messaging is sent back, which can automatically • Customizable tolerances by currency
update a client’s proprietary system
• Two-sided comparison or single file delivery with
• Pre-advice functionality allows users to send claim counterparty affirmation
payment details; alternatively, a client can send a
• Public and private comments to record notes on a
one-sided file and the receiver can affirm the claim
break
and payment details
• Ages unresolved breaks prior to and post pay date
• Reduces time spent manually reconciling & paying
or making claims
• History tab displays data from past runs
• Get paid on time!
The EquiLend RETURNS & RECALLS services provide an efficient, automated
way for borrowers and lenders to send return or recall notifications.
HOW IT WORKS STRATEGIC FEATURES
• A counterparty initiates a return/recall for a • Initiate returns/recalls via the browser, XLS file
specific contract using a unique EquiLend ID, or uploads or messaging
may issue a more general return/recall for one or
• Set system to automatically acknowledge the
more securities
return/recall or have active control
• The recipient may acknowledge the receipt of a
• Ability to bilaterally agree on customized cut-off
return/recall via the EquiLend screen or through
times by market
messages integrated into their prop system
• Using an EquiLend ID, initiate a return/recall that is
• EquiLend provides reporting and tracking
contract specific for both parties
capabilities to monitor return/recall status online
• Through a direct link to the DTCC ARMS hub,
EquiLend clients can recall U.S. securities from
non-EquiLend clients with whom they have
transacted
• Ability to return or recall all global equity and fixed
income securities
18TRI-PARTY CONNECTIVITY allows collateral providers and collateral receivers to
agree required values (RQVs) and send the agreed-upon figures to the tri-party
agent. The service is available if both counterparties are using EquiLend’s Tri-Party
Connectivity service or if only one client is using it.
HOW IT WORKS STRATEGIC FEATURES
• Collateral receiver and/or provider submits RQVs • Bulk submit RQVs via one XLS upload for all
to EquiLend counterparties
• EquiLend compares counterparties’ values • Collateral provider submits aggregate value
against each other and facilitates the resolution of for a group of instructions; receiver determines
discrepancies breakdown by submitting values at individual fund
• When the values match or fall within a provider’s level
tolerance, EquiLend sends the figures on behalf of • Receive response messages from the tri-party
both parties to the tri-party agent agent to know the real-time statuses of RQVs
• The tri-party agent sends response messages • Allegement messages with trade details displayed
acknowledging receipt of the figures, which when a counterparty not using EquiLend is first
EquiLend processes to generate individual status to submit, so EquiLend clients can quickly and
updates on the screen accurately respond
• Collateral providers can set value & percentage
tolerances on each instruction to facilitate
comparison—not necessary to agree exact values
• Receive alert if instruction sent to tri-party agent
requires action
EQUILEND | PRODUCTS AND SERVICES | 2021
19IAIN MACKAY ROWENA BROWN
DIRECTOR DIRECTOR
PRODUCT OWNER, CRM, NORTH AMERICA
POST-TRADE SERVICES
+44 20 7426 4402 +44 20 7426 4412
iain.mackay@equilend.com rowena.brown@equilend.com
EquiLend’s ALD service acts as a conduit for
data transfer between EquiLend counterparties
globally. It also provides secure and timely
transfer of principal loan data as a facility for
approving underlying principals. This enables
the credit prequalification of principals on
EquiLend ALD, which in turn permits clients
to calculate daily capital adequacy on their
proprietary systems.
20EquiLend’s ALD service acts as a conduit for data transfer between EquiLend
counterparties globally. It also provides secure and timely transfer of principal
loan data as a facility for approving underlying principals. This enables the credit
prequalification of principals on EquiLend ALD, which in turn permits clients to
calculate daily capital adequacy on their proprietary systems.
HOW IT WORKS STRATEGIC FEATURES
• Credit Prequalification Borrowers must actively • Send or receive ALD files with all counterparties,
prequalify each principal lender with whom they even if they are not EquiLend clients
will transact. • Deliver and receive daily position and activity files
• Daily Capital Calculation Helps borrowers to through the EquiLend platform
perform regulatory capital calculations and credit • Account management tools include broker
exposure monitoring. affirmations of new principal accounts opened by
• Comparison & Reporting EquiLend produces agent lenders
comparison data with highlighted breaks. A • Flexible exception rules accommodate differences
selection of reports are available for review or in client proprietary systems
download for the operations and credit groups.
• Persistent actions and comments allow users to
track break history
• Reporting displays lender contracts aggregated
with totals
• Exception reports highlight allocation and loan
discrepancies
• Compliant with SIFMA and ISLA standards
• View the status of principals in the browser
EQUILEND | PRODUCTS AND SERVICES | 2021
21GABI MANTLE DOMINIQUE ROSE
VICE PRESIDENT VICE PRESIDENT
POST-TRADE SERVICES SALES, NORTH AMERICA
+44 203 023 8377 +1 212 901 2274
gabi.mantle@equilend.com dominique.rose@equilend.com
Increased regulatory reform, combined
with the requirement for financial
institutions to manage collateral in a
more efficient and cost-effective manner,
has meant that accurate exposure
management and transparency of
collateral usage is imperative. EQUILEND
EXPOSURE is uniquely designed to
enable collateral teams to effectively
manage collateral requirements based on
real-time information.
22EQUILEND EXPOSURE provides a centralized way to highlight intra-day exposure risk,
identify discrepancies in collateral requirements between counterparties and facilitate STP
connectivity to triparty agents whilst enhancing control and governance to ensure that
collateral transactions are executed exactly how clients would expect.
Features Benefits
» Automatic connectivity to all tri-party agents, » Enables greater STP on connecting collateral
providing straight-through processing (STP) movements, reducing settlement latency to
directly from the exposure screens support loan release and returns processing
» Calculate actual and forecasted exposure » Increased profit:
numbers split by counterpart and collateral
* Accurate funding requirements with real-
type
time view of settlement positions
» Absorb counterparts’ equivalent data and
provide real-time reconciliation * Reduces RWA costs by eliminating under
or over collateralization of clients
» Direct real-time linkage into Unified
Comparison facilitating instant view of * Reduce operational costs associated with
discrepancies manually reconciling discrepancies and
submitting RQV numbers
» Ability to prioritize collateral requirements,
for example, independent calculation and * Reduce settlement costs associated with
agreement of pre-pay activity failing trades or buy-ins
» Real-time receipt of collateral allocations from » Enables CSDR and SFTR solution
tri-party agents » Exact risk management with all clients;
» On screen visibility to intraday settlement knowing precisely the value of collateral to be
activity to ensure accurate, up to date provided to each client
collateral requirement calculations
» All up-to-date data absorbed and displayed
on configurable, easy-to-view screen
All data will be leveraged from your OneFile submission
EQUILEND | PRODUCTS AND SERVICES | 2021
23GRANT DAVIES MARK BYRNE
DIRECTOR ASSOCIATE DIRECTOR
HEAD OF EUROPEAN SALES POST TRADE
+44 203 023 8383 +353 1 961 9278
grant.davies@equilend.com mark.byrne@equilend.com
As leading providers of trading, confirmation and
reporting solutions, EquiLend and MarketAxess
are ideally placed to offer solutions around Unique
Transaction Identifier (UTI) generation, timestamps
and lifecycle events to help firms meet their SFTR
reporting obligation.
24CLIENTS need to report to a chosen trade repository by T+1 both sides of a trade, any associated
collateral, plus modifications throughout the lifecycle using a common UTI. They must also
manage any exceptions in the reporting flow. Additionally, clients must deal with any reconciliation
discrepancies flagged by the trade repository. The EquiLend and MarketAxess solution enables
firms to meet regulatory requirements by using regulated trading, post-trade and reporting
platforms to do the following:
OUR SOLUTION CLIENT A CLIENT B
FUNCTIONALITIES OFFERED
Generate and Share UTI
Pre-matching (NGT & UC) • Trades
Data Enrichment • Associated Collateral
• Lifecycle Updates
Data Validation
Post-Trade Lifecycle Management
Report Creation &
Exception Management
Real-Time Status Update
Delegate Reporting
TRADE
REPOSITORY
DIRECT END-TO-END SOLUTION
CLIENT UTI AND SELF REPORT TO TR
EquiLend and MarketAxess offer a joint solution that allows firms subject to SFTR to obtain a
pre-repository match to help ensure accurate reporting and efficient exception management
processing.
The fully interoperable solution enables the onward routing of trades to the MarketAxess Insight
engine, which (i) enriches the reports submitted by a client with reference data and (ii) sends the
enriched transaction reports to certain trade repositories. The MarketAxess Insight engine captures
and centralizes reporting flows, enabling firms to manage exceptions through a single interface and
to rely on MarketAxess rules engine to filter and enrich trades. Clients will also be able to benefit
from delegated reporting.
KEY BENEFITS
• Expertise in securities finance and regulatory • A customizable client dashboard, which includes
reporting space with access to largest securities MI reports and benchmarking
lending and repo community • UTI portal for industry-wide sharing of UTI
• ESMA-compliant UTI and execution timestamp at information
point of trade via NGT and point of matching via • Insulation from future regulatory/repository
Post-Trade Suite change cost and development need
• A complete reporting solution including • Aggregated reporting price benefit (subject to TR
enrichment, eligibility and break management pricing structure)
either via direct or delegated reporting
• Adherence to a common industry solution
• Message validation and counterparty field realizing matching efficiencies and contribution to
comparison, pre-repository ingestion a vendor-aligned collective voice
• A centralized view of MiFID and SFTR reporting
EQUILEND | PRODUCTS AND SERVICES | 2021
25NANCY ALLEN ROWENA BROWN
DIRECTOR DIRECTOR
PRODUCT OWNER, CRM, EMEA
DATALEND & SWAPTIMIZATION
+1 212 901 2262 +44 20 7426 4412
nancy.allen@equilend.com rowena.brown@equilend.com
DATALEND provides aggregated, anonymized,
cleansed and standardized securities finance
data covering all asset classes, regions and
markets globally. DataLend operates on a
“give-to-get” model, processing more than 3
million global transactions per day.
BEST SECURITIES FINANCE
MARKET DATA PROVIDER
GLOBALLY
Global Investor/ISF Awards
2013, 2014, 2015, 2016, 2017,
2018, 2019, 2020
26DATALEND DATA COVERS
$26+ trillion $2.4+ trillion 55,000+
lendable on loan securities on loan
* Data as of January 2021
DATALEND ADVANTAGE CLIENT CONFIDENTIALITY
• Data available T+1 DataLend maintains the highest data security
• Rigorous data cleansing process standards to protect client data and identity:
• Leverages EquiLend & BondLend trading data • Internet Protocol (IP) Security: All User IDs are
tied to an approved organization IP address
• Proprietary indices, including DataLend Target 50 meaning a user cannot log-in from outside their
and DataLend Newly Hot corporate network.
• Options-derived implied borrow cost • Beneficial Owner Confidentiality: Each agent
• Daily newsletters and automated reports lender assigns a code to their underlying beneficial
owner client. DataLend does not know the identity
• Frequent thought leadership contributor to RMA, of any beneficial owner.
ISLA, PASLA, CASLA, IMN and other securities
lending associations as well as various industry • Segregation: Each client organization within
magazines DataLend is strictly segregated from other
organization in our secure database tables. User
IDs are tied directly to an organization.
DataLend offers four ways to access:
» Raw data files that contain fees, utilization and other » An Excel Add-In tool that supports functions and right-
metrics across all securities on loan click functionality
» An intuitive and highly customizable Web-based user » An Application Protocol Interface (API) that allows
interface clients to access data directly from the database
SECURITY SEARCH
The Security Search screen is a
highly customizable, intuitive view
into securities lending activity
taking place within a specific
security. The tool contains current
and historical data, including
volume-weighted average fees,
utilization, on-loan and inventory
balances, short interest, re-rate
information, transaction-level
data, corporate actions and other
information critical to securities
lending trading performance.
EQUILEND | PRODUCTS AND SERVICES | 2021
27RESEARCH
The Research screens allow traders and analysts to assess their portfolio
performance relative to the industry either at an aggregate level or drilled down
to the asset class, sector or individual security level. The screens also allow users
to identify market movers with predetermined fee or utilization changes. Reports
may be customized and emailed on a daily, weekly or monthly basis.
Business intelligence and data analytics tools are increasingly crucial for securities
finance market participants. DataLend’s robust and award-winning securities
finance market data allows firms to make the most informed trading decisions with
its comprehensive, global data set and powerful analytical tools. The DATALEND
API offers direct access to DataLend’s database in a fast, flexible and developer-
friendly solution ready to be tailored for a firm’s proprietary system.
THE DATALEND API ADVANTAGE NOTES FOR DEVELOPERS
• Instant access to the DataLend ecosystem • Up-to-date RESTful API architecture implemented
on scalable, cloud-based technologies
• Simplified integration to your business
intelligence tools • Built with HTTP Web standards for direct
compatibility with open-source libraries in many
• No expensive or time-consuming storage and software languages
ETL process to maintain
• Sub-second response times, ensuring a consistent
• Amendments to data are automatically and swift experience
reflected
• Well-formed concrete nouns for the securities
• New data fields are easily implemented lending industry and standard HTTP verbs for the
• Historical data request
• All queries are executed over HTTPS, ensuring
secure communication
• Authentication and authorization based on latest
OAuth 2.0 standards
28FOR AGENT LENDERS
Experience robust performance reports with unparalleled insight into your securities
lending program. Benefit from standardized performance measurement, flexible
but DataLend-controlled peer groups and unique and exclusive data. Optimize your
lending program and maximize revenue by making the most informed decisions with
DataLend’s CLIENT PERFORMANCE REPORTING.
CLIENT PERFORMANCE REPORTING
STANDARDIZED PEER GROUPS
PORTFOLIO SUMMARY EXCLUSIVE DATA
Ensure consistency across performance DataLend has access to inventory and loan
reviews through the use of DataLend’s positions not included in any other securities
standardized peer groups. DataLend’s peer lending data service. Ensure this data is part
groups are controlled by the DataLend of your analysis to obtain the most accurate
proprietary algorithm. They cannot be performance measurement possible.
manipulated to impact performance.
Peer group matching options allow users to FLEXIBILITY
select the best peer group match (in addition to
matching at the security and dividend rate by ACCOUNT DRILLDOWN
default): Review performance across all accounts
• Identify which accounts are under or over-
• Industry (most relaxed criteria) performing versus the group
• Legal structure and collateral type • Navigate to a selected account for further
• Legal structure and fiscal location analysis
• Legal structure, fiscal location and collateral CREATE-YOUR-OWN PERFORMANCE
type (strictest criteria) METRICS
• DataLend Collateral Matching Multi-select by asset class, country and sector over a
customized time period and tailored account groups
PERFORMANCE METRICS
Once filters are applied, a wide variety of performance metrics will appear. Examples include
performance by sector and over performers, pictured here.
PERFORMANCE METRICS
If you have any questions about the new Client Performance Reporting, please reach out to your product
specialist or email the team at DataLendProductSpecialists@equilend.com.
EQUILEND | PRODUCTS AND SERVICES | 2021
LONDON HONG KONG
29
NEW YORK TORONTO
+1 212 901 2200 +44 207 426 4426 +1 416 865 3395 +852 3101 7070FOR BENEFICIAL OWNERS Review all your securities lending data in one place with DATALEND PORTFOLIO. Whether you have a single- or multi-agent securities lending program, your single login to DataLend Portfolio will provide you with an aggregated view of your securities lending activity. Drill down into each program to access DataLend’s standardized performance metrics, used by agent lenders around the globe. AGENT LENDER SUMMARY STATISTICS AGGREGATE VIEW Features key metrics across all your securities lending programs over a customized time period, including: » Asset allocation » Fee » On loan » Revenue » Utilization » Return to lendable 30
PERFORMANCE MEASUREMENT
STANDARDIZED PEER GROUPS
Ensure consistency across performance reviews through the use of DataLend’s
standardized peer groups. DataLend’s peer groups are controlled by the DataLend
proprietary algorithm. Choose from peer groups based on fiscal location, legal
entity and/or collateral type.

EXCLUSIVE DATA
DataLend has access to inventory and loan positions not included in any other
securities lending data service. Ensure this data is part of your analysis to obtain
the most accurate performance measurement possible.

FLEXIBILITY
ACCOUNT DRILLDOWN
•   Identify which accounts are under or over-performing versus the group
•    Navigate to a selected account for further analysis

CREATE-YOUR-OWN PERFORMANCE METRICS
•   Multi-select by asset class, country and sector over a customized time period and
    tailored account groups

AGENT LENDER PERFORMANCE METRICS

                                                           EQUILEND | PRODUCTS AND SERVICES | 2021
                                                                                                 31
DATALEND CONSULTING offers a suite of powerful revenue-optimizing tools
and insights. Services offered include:
• DataLend Portfolio
A Dedicated Beneficial Owner Performance Analytics Tool
• Market Intelligence
• Revenue Estimate Analysis
• Bespoke Reporting
REPORT EXAMPLES
Portfolio Revenue Estimate Quarterly Industry Revenue
Report Information
Report Information
Program: DataLend Portfolio Currency: USD
Period: 1st Jan 2017 - 31st Dec 2017 Transaction Type: Lender to Broker Only Fee Display: Basis Points
Period: 2017 Q2 Currency: USD
Portfolio Summary Portfolio - Inventory by Asset Class
2017 Q2
Industry Revenue 18%
Portfolio
Security Count: 216 2017 Q2 2016 Q2 Δ Americas
Americas
Common Shares (60%) Global 2,369,948,128 2,790,007,284 -15.1% 48% EMEA
Americas 1,314,533,537 1,183,030,183 11.1%
Average Daily Inventory Value: 1,421,264,863 ETF/ETNs (7.5%) APAC
EMEA 940,310,005 1,105,543,814 -14.9%
Average Utilization (%): 21.35 APAC 483,393,678 501,433,287 -3.6%
34%
Sovereign Debt (20%)
Average Fee (bps): 65.41
Total Revenue: 1,984,801 Energy Corporate Debt (12.5%)
Americas Revenue Americas Top Earners
2017 Q2 2016 Q2 Δ
Equity 913,517,248 972,403,358 -6.1% Equity Revenue Fee
United States 800,366,702 851,734,891 -6.0% SNAP INC COM CL A 48,261,702 1,520.57
Daily Revenue Top Earners Canada 105,774,754 113,476,532 -6.8% TESLA INC COM 24,443,708 98.50
Daily Daily Brazil 6,156,820 5,728,405 7.5% SIRIUS XM HOLDINGS INC COM 17,271,797 331.68
Mexico 1,216,077 1,459,392 -16.7% BRITISH AMERICAN TOBACCO 16,850,200 376.67
Average Tot. Inv. On-Loan Total
Revenue (USD) Cayman Islands 2,415 1,775 36.1% UNDER ARMOUR INC COM STK CL A 16,328,703 514.07
Security Description Fee (bps) Value Value Revenue
10,000
1 APPLIED OPTOELECTRONICS INC COM 4,000 300,000 270,000 108,000 Fixed Income 272,269,489 176,720,859 54.1% Fixed Income Revenue Fee
8,000 2 TESLA INC COM 125 8,600,000 7,740,000 96,750 United States 260,638,978 173,003,640 50.7% UST NOTES 2.375% NT 15/05/2027 3,183,359 36.97
6,000 3 SIRIUS XM HOLDINGS INC COM 300 3,010,000 2,709,000 81,270 Canada 11,003,758 2,983,223 268.9% UST NOTES 0.625% BDS 31/07/18 2,265,767 23.03
4 UBIQUITI NETWORKS INC COM 1,400 560,000 504,000 70,560 Argentina 348,025 572,425 -39.2% UST NOTES 2% NTS 15/02/23 2,262,551 17.57
4,000 Uruguay 192,357 160,288 20.0% UST NOTES 0.75% NTS 15/07/2019 2,093,967 32.17
5 OVERSTOCK COM INC DEL COM 1,500 500,000 450,000 67,500
Mexico 82,612 75,255 9.8% UST NOTES 2.25% NT 15/02/2027 2,038,195 9.13
2,000 6 FRONTIER COMMUNICATIONS CORP 2,900 250,000 225,000 65,250
0 7 DIAMOND OFFSHORE DRILLING COM 1,400 490,000 441,000 61,740
8 SILLAJEN INC 1,700 375,000 337,500 57,375
9 SNAP INC COM CL A 500 1,200,000 1,080,000 54,000 EMEA Revenue EMEA Top Earners
Revenue 10 SHARP CORP NPV 1,200 420,000 378,000 45,360 2017 Q2 2016 Q2 Δ
Equity 731,908,347 917,479,814 -20.2% Equity Revenue Fee
France 255,591,102 231,846,703 10.2% AXA 19,527,676 127.34
Sweden 84,839,173 168,661,336 -49.7% SANOFI 18,301,060 70.92
Market Performance Revenue by Market (USD) Germany 69,137,850 96,846,363 -28.6% DANONE 16,656,544 159.74
United States United Kingdom 56,995,358 71,391,379 -20.2% SAMPO PLC SER'A'NPV 15,586,588 385.72
Average Average Daily Total Finland 43,939,756 65,828,314 -33.3% BNP PARIBAS 14,671,225 100.26
Korea,
Market Utilization Fee (bps) On-Loan Revenue
Republic of Fixed Income 208,401,658 188,064,000 10.8% Fixed Income Revenue Fee
United States 15.15 64.32 98,004,931 630,368
Japan Germany 88,018,366 76,598,884 14.9% GERMANY 0.5% SNR 15/02/2026 3,451,858 35.33
Korea, Republic of 23.56 68.86 88,059,527 606,378
United Kingdom 30,491,432 33,724,700 -9.6% GERMANY 0% SNR 15/08/2026 3,319,035 31.25
Japan 21.09 67.12 68,986,125 463,035 France 27,553,677 19,302,131 17.5% GERMANY 3.25% SNR 04/07/42 3,226,943 40.97
Canada 18.14 58.89 48,389,465 284,966 Canada
Luxembourg 23,326,029 23,456,907 20.8% GERMANY 0.25% SNR 15/02/27 2,705,787 37.11
Italy 8,613,524 2,927,705 194.2% GERMANY 1.5% SNR 15/05/2023 1,932,666 11.19
APAC Revenue APAC Top Earners
Security Type Performance Revenue by Security Type (USD) 2017 Q2 2016 Q2 Δ
Equity 397,880,844 387,339,202 2.7% Equity Revenue Fee
Average Average Daily Total Japan 131,570,599 98,045,420 34.2% SHARP CORP NPV 12,991,108 551.57
Common Shares
Security Type Utilization Fee (bps) On-Loan Revenue Hong Kong 85,502,928 84,319,129 1.4% CELLTRION INC 12,215,954 465.95
Common Shares 12.12 115.55 108,004,931 1,247,997 Korea, Republic of 77,285,142 103,116,622 -25.1% CHINA EVERGRANDE GROUP 11,322,914 409.88
ETF/ETNs Taiwan 55,011,140 47,643,700 15.5% CYBERDYNE INC NPV 8,606,575 1,842.61
ETF/ETNs 15.83 51.86 68,389,465 354,668
Australia 24,313,194 23,136,625 5.1% FULLSHARE HOLDINGS LIMITED 8,236,660 762.46
Sovereign Debt 36.15 26.89 68,059,527 183,012
Sovereign Debt
Corporate Debt 12.48 33.75 58,986,125 199,078 Fixed Income 7,166,499 14,909,082 -51.9% Fixed Income Revenue Fee
Japan 5,637,715 11,831,556 -52.4% JAPAN 2.3% SNR 20/03/39 1,595,880 28.58
Corporate Debt Australia 540,080 1,423,245 -62.1% JAPAN 2.3% SNR 20/03/40 1,431,167 28.80
Singapore 527,158 863,102 -38.9% JAPAN 2.2% SNR 20/03/41 922,835 26.71
Hong Kong 406,118 752,481 -46.0% JAPAN 2.5% SNR 20/09/36 530,022 31.33
Thailand 20,542 20,618 -0.4% JAPAN 2.5% SNR 20/03/38 491,810 30.00
Sector Performance Revenue by Sector (USD) Regional Equity Revenue by Fee Bucket
EMEA APAC
Americas
Average Average Daily Total Health Care 3% 3%
7% 9% 9%
Sector Utilization Fee (bps) On-Loan Revenue
Health Care 22.65 63.48 78,044,021 495,423 Materials 12%
Materials 18.15 61.45 73,389,465 450,978 15%
41%
Industrials 16.89 58.19 71,059,527 413,495 Industrials 22% 46%
47%
Financials 26.48 55.64 68,986,125 383,839
15%
Financials
27%
25%
19%
THE INFORMATION CONTAINED HEREIN IS PROPRIETARY TO DATALEND AND SELECT THIRD PARTIES; MAY NOT BE COPIED OR DISTRIBUTED WITHOUT THE EXPRESS CONSENT OF THE INFORMATION CONTAINED HEREIN IS PROPRIETARY TO DATALEND AND SELECT THIRD PARTIES; MAY NOT BE COPIED OR DISTRIBUTED WITHOUT THE EXPRESS CONSENT OF DATALEND; SHALL NOT
DATALEND; SHALL NOT CONSTITUTE INVESTMENT ADVICE BY DATALEND, OR ANY REPRESENTATIVE THEREOF; IS NOT WARRANTED TO BE ACCURATE, COMPLETE OR TIMELY; IS CONSTITUTE INVESTMENT ADVICE BY DATALEND, OR ANY REPRESENTATIVE THEREOF; IS NOT WARRANTED TO BE ACCURATE, COMPLETE OR TIMELY; IS PROVIDED FOR INFORMATIONAL PURPOSES ONLY; IS
PROVIDED FOR INFORMATIONAL PURPOSES ONLY; IS NOT INTENDED FOR TRADING PURPOSES; AND SHOULD NOT BE CONSTRUED AS DATALEND MAKING FORECASTS, PROJECTING NOT INTENDED FOR TRADING PURPOSES; AND SHOULD NOT BE CONSTRUED AS DATALEND MAKING FORECASTS, PROJECTING RETURNS OR RECOMMENDING ANY PARTICULAR COURSE OF ACTION. NEITHER
DATALEND NOR ANY REPRESENTATIVE THEREOF SHALL BE AN ADVISOR OR A FIDUCIARY OF A READER OF THIS REPORT. DATALEND IS NOT RESPONSIBLE OR LIABLE IN ANY WAY TO THE READER, OR TO ANY
RETURNS OR RECOMMENDING ANY PARTICULAR COURSE OF ACTION. NEITHER DATALEND NOR ANY REPRESENTATIVE THEREOF SHALL BE AN ADVISOR OR A FIDUCIARY OF A READER OF PERSON, FIRM OR CORPORATION FOR ANY DAMAGES OR LOSSES ARISING FROM ANY USE OF THE INFORMATION CONTAINED HEREIN. IN CONSIDERING THE INFORMATION CONTAINED HEREIN, A READER OF
THIS REPORT. DATALEND IS NOT RESPONSIBLE OR LIABLE IN ANY WAY TO THE READER, OR TO ANY PERSON, FIRM OR CORPORATION FOR ANY DAMAGES OR LOSSES ARISING FROM ANY THIS REPORT DOES SO SOLELY IN RELIANCE ON THE READER’S OWN JUDGMENT. PAST PERFORMANCE IS NO GUARANTEE OF FUTURE PERFORMANCE.
USE OF THE INFORMATION CONTAINED HEREIN. IN CONSIDERING THE INFORMATION CONTAINED HEREIN, A READER OF THIS REPORT DOES SO SOLELY IN RELIANCE ON THE READER’S
OWN JUDGMENT. PAST PERFORMANCE IS NO GUARANTEE OF FUTURE PERFORMANCE. © 2018 EquiLend Holdings LLC. Proprietary and Confidential. For discussion purposes only. Test Data Only
© 2018 EquiLend Holdings LLC. Proprietary and Confidential. For discussion purposes only. Test Data Only
DataLend Consulting
clients have exclusive
access to content
from The Purple—A
DataLend Research
Publication.
32THE PULSE—PRECISION ANALYTICS POWERED BY DATALEND offers unparalleled
insight into your NGT trading activity through an intuitive, simple-to-use Web portal.
Easily access and analyze trade activity across your counterparties and your rank
amongst all firms on NGT.
Counterparty Heatmap Counterparty Trends Trade Initiation Activity
Analyze your activity across all Analyze your activity across all View your activity across
your counterparties—identify your counterparties—identify NGT workflows (IOI, Targeted
your most efficient and inefficient your most efficient and inefficient Availability, Unsolicited Bid)—
trading partners trading partners benchmark yourself to the industry
My Firm
My Firm
Advanced Filtering League Tables Fee Buckets
Drill down to any combination Identify where you rank See your NGT performance at
of market, asset type, sector, amongst your peers—see if your a fee band level—compare your
collateral and fee bucket competitors are optimizing their market share of GC and specials to
NGT flow better than you your competitors
EQUILEND | PRODUCTS AND SERVICES | 2021
33POWERED BY STONEWAIN
MICHAEL DOYLE TRISH BARRY
DIRECTOR DIRECTOR, BUSINESS ANALYSIS,
SALES, NORTH AMERICA CLEARING AND MIDDLE OFFICE
+1 646 767 4335 +1 646 767 4307
michael.doyle@equilend.com trish.barry@equilend.com
Flexible, Modular, Customizable—EQUILEND
SPIRE is a bespoke technology solution for all
your securities finance business needs.
BEST SOFTWARE
SOLUTION AMERICAS
GLOBAL INVESTOR/ISF
AWARDS, 2019
34EQUILEND SPIRE POWERED BY STONEWAIN
EQUILEND SPIRE is a state-of-the-art platform and technology-driven hub for securities finance
firms of all types, including agent lenders, prime brokers, retail brokers, beneficial owners and
collateral managers. Managing your securities finance business has never been more efficient
Consolidate disparate systems by adopting our comprehensive, full-service offering covering
the front, middle and back office. Or, choose one or more modules that complement and are
interoperable with your existing technology. EquiLend Spire streamlines the management of your
operation with a bird’s eye view of your entire business.
EquiLend Spire ties in seamlessly with EquiLend platforms including NGT (trading), PTS (post-
trade), DataLend (market data), EquiLend Clearing Services and a variety of other systems, market
infrastructures and vendors across the industry. Use the EquiLend Spire interface or link the
platform to your proprietary system for a powerful engine allowing you to drive your business from
one central hub.
EQUILEND SPIRE OFFERS
EquiLend Spire allows users to leverage an
» Centralized management of your entire securities
finance business industry-leading financing platform with
EquiLend’s many automated trading and
» Comprehensive, industry-specific functionality post-trade services to optimize and efficiently
» Cutting-edge technology and automation process inventory management, cash and
» Seamless integration with EquiLend and other non-cash collateral, trade distribution through
securities finance industry service providers electronic trading algos and trading desk
including DTC, SWIFT, Pirum, FIS (Loanet), P&Ls—all with enhanced management and
Broadridge (Anetics) and Helix client reporting.
EQUILEND SPIRE MODULES INCLUDE:
Securities Finance Core
a comprehensive books &
records/subledger system
Short Sale Order/Inventory
Approvals Management
fully automated a full suite of services
process ideal for to manage your
tracking and audit securities finance
purposes
EQUILEND business
Modules may
SPIRE
be implemented
individually, to replace
existing components
or fill gaps in your
securities finance Fully Paid Lending Seg Optimization
system, or as a full gain the opportunity to frees up securities
package for firms earn incremental available in margin that
looking for a front-to- income on your have the greatest P&L
back system upgrade portfolio through the opportunities
or those who are just securities lending
entering the business. market
EQUILEND | PRODUCTS AND SERVICES | 2021
35OUR INNOVATION. YOUR ADVANTAGE.
EquiLend is a leading provider
of trading, post-trade, market
data and clearing services for the
securities finance industry.
SALES@EQUILEND.COM
NEW YORK TORONTO LONDON DUBLIN HONG KONG TOKYO
+1 212 901 2200 +1 416 865 3395 +44 207 426 4426 +353 1 653 2122 +852 3622 3988 +81 50 3579 3335
EquiLend LLC, EquiLend Europe Limited, EquiLend Limited, EquiLend Canada Corp. and EquiLend Clearing Services are subsidiaries of EquiLend Holdings LLC
(collectively, “EquiLend”). EquiLend LLC and EquiLend Clearing Services are members of FINRA and SIPC. EquiLend Clearing Services is registered with the
SEC and FINRA as Automated Equity Finance Markets, Inc. EquiLend Europe Limited is authorized and regulated by the Financial Conduct Authority. EquiLend
Canada Corp. is authorized and regulated by IIROC. EquiLend Limited is regulated by the Central Bank of Ireland. All services offered by EquiLend are offered
through EquiLend LLC, EquiLend Europe Limited, EquiLend Limited, EquiLend Canada Corp. and EquiLend Clearing Services. EquiLend and the EquiLend mark
are protected in the United States and in countries throughout the world. © 2001-2021 EquiLend Holdings LLC. All Rights Reserved.
36You can also read