2020 Beyond the Black Box: An Intuitive Approach to Investment Prediction with Machine Learning
←
→
Page content transcription
If your browser does not render page correctly, please read the page content below

2020
                                                              VOLUME

                                              WINTER

                                                              2 1
                                                              NUMBER

  the journal of

                                                               JFDS. pm-research.com

Beyond the Black Box: An Intuitive Approach
to Investment Prediction with Machine Learning
Yimou Li, David Turkington, and Alireza Yazdani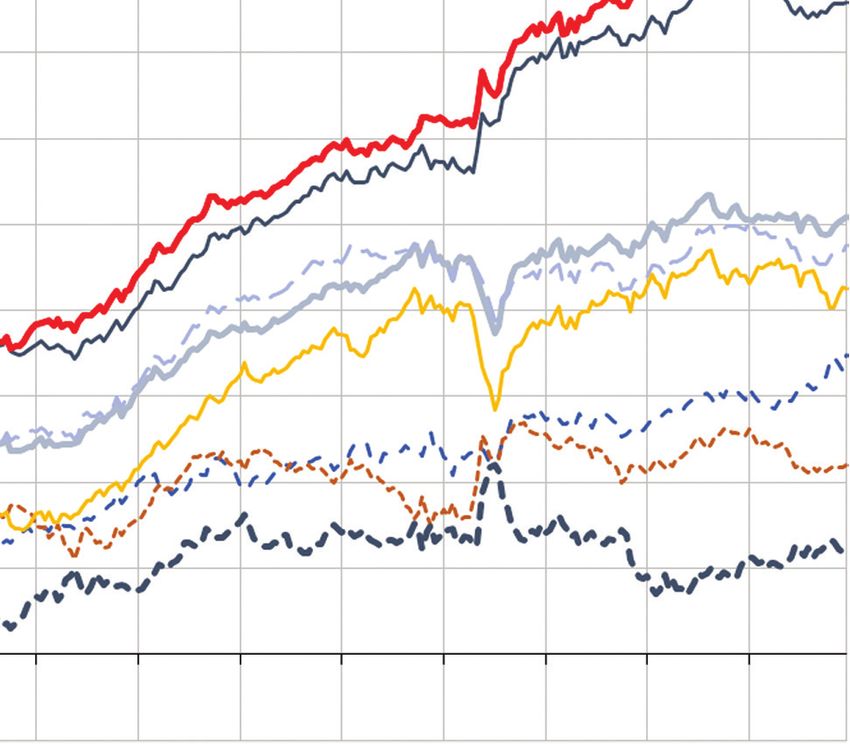
It is illegal to make unauthorized copies of this article, forward to an unauthorized user, or to post electronically without Publisher permission.
Beyond the Black Box:
An Intuitive Approach
to Investment Prediction
with Machine Learning
It is illegal to make unauthorized copies of this article, forward to an unauthorized user, or to post electronically without Publisher permission.
Yimou Li, David Turkington, and Alireza Yazdani
Yimou Li
is assistant vice president KEY FINDINGS
and machine learning • This article presents a framework for the implementation and interpretation of machine
researcher at State learning model predictions applied to investment portfolios.
Street Associates in • Model predictions are decomposed into the linear, nonlinear, and interaction components,
Cambridge, MA. and their predictive efficacy is evaluated using these components.
yli24@statestreet.com • Using a currency prediction case study, it is demonstrated that machine learning models
reliably identify known effects and find new nonlinear relationships and interactions.
David T urkington
is senior managing director
and head of Portfolio
and Risk Research at ABSTRACT: The complexity of machine learning TOPICS: Statistical methods, simulations,
State Street Associates models presents a substantial barrier to their adoption big data/machine learning*
in Cambridge, MA.
for many investors. The algorithms that generate
dturkington@statestreet.com
M
machine learning predictions are sometimes regarded
A lireza Yazdani as a black box and demand interpretation. In this achine learning has led to
is vice president and article, the authors present a framework for demys- impressive results in many
machine learning tifying the behavior of machine learning models. fields. Although the specific
research manager at They decompose model predictions into linear, applications and types of
State Street Associates
in Cambridge, MA.
nonlinear, and interaction components and study a models vary widely, they generally owe their
ayazdani@statestreet.com model’s predictive efficacy using the same compo- success to greater computational efficiency
nents. Together, this forms a fingerprint to summa- paired with models that are less dependent
rize key characteristics, similarities, and differences on simplifying assumptions, such as styl-
among different models. The presented framework ized forms of probability distributions, than
is demonstrated in a case study applying random those in the past. As a result, sophisticated
forest, gradient boosting machine, and neural network machine learning models have the ability
models to the challenge of predicting monthly currency to capture nonlinear dependencies and
returns. All models reliably identify intuitive effects interaction effects that may lead to superior
in the currency market but also find new relationships predictions. On the other hand, the inherent
attributable to nonlinearities and variable interac- complexity of these models creates chal-
*All articles are now
categorized by topics tions. The authors argue that an understanding of lenges for interpretation and understanding.
and subtopics. View at these predictive components may help astute investors This issue is especially relevant to investment
PM-Research.com. generate superior risk-adjusted returns. applications. Predicting time-series returns in
Winter 2020 The Journal of Financial Data Science 1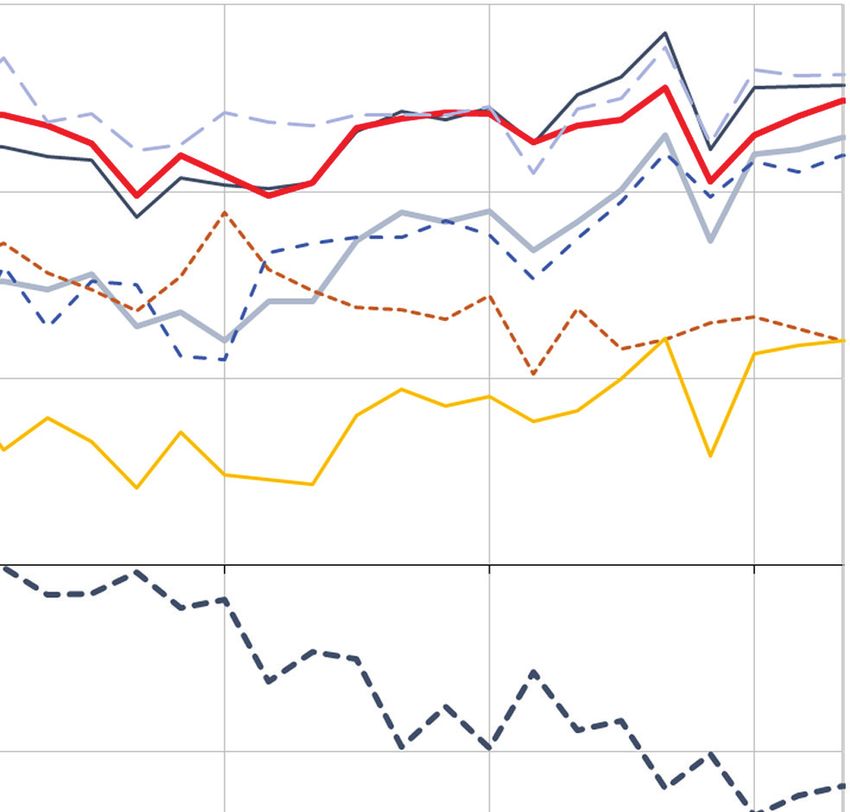
financial markets is fundamentally different from other necessarily large, the problem is quite complex because
mainstream applications of machine learning, such as of the many economic effects involved. Another moti-
image recognition, where the underlying data genera- vation for this case study is that, although there is a rich
tion process is relatively stable over time. In contrast, the body of research in economics and finance to motivate
behavior of financial markets is ruled by constant change the choice of predictor variables and provide helpful
and uncertainty as a result of competitive dynamics and intuition, many traditional quantitative strategies have
structural shifts. This means that data from more dis- failed to deliver reliable results in the aftermath of the
tant history may be less relevant for training machine 2008 financial crisis (Czasonis, Pamir, and Turkington
It is illegal to make unauthorized copies of this article, forward to an unauthorized user, or to post electronically without Publisher permission.
learning algorithms, and we are left with an inherently 2019). There is a practical need for improvement.
short data sample and a low signal-to-noise ratio. Because Previous research has applied machine learning
of such unique characteristics of financial information, to investment prediction, with encouraging results.
some practitioners (López de Prado 2019; Simonian and Many such studies, however, have focused on secu-
Fabozzi 2019) have called for establishing financial data rity selection within the equity market. For example,
science as a standalone field in its own right, wherein Heaton, Polson, and Witte (2016) explored the use of
greater emphasis is placed on empiricism and data- deep learning models for financial prediction problems,
driven expansions of traditional financial econometrics. including pricing securities, constructing portfolios, and
The two primary goals of data analysis, as noted risk management. Gu, Kelly, and Xiu (2019) showed that
by Breiman (2001), are to make a prediction and to the cross section of US stock returns can be predicted
obtain information that aids in understanding. Along well with machine learning models, and neural networks
these lines, we pose two distinct questions: in particular. Rasekhschaffe and Jones (2019) explored
machine learning for stock selection and forecasting the
1. Can machine learning algorithms detect patterns cross section of stock returns. We extend this literature
in financial data that lead to superior investment on empirical findings by offering promising results for
returns? currency market predictions.
2. How do the algorithms process the data to form Regarding model interpretation, theoretical research
predictions? has offered a variety of ways to study the information
processing mechanisms of machine learning algorithms.
In this article we attempt to answer these questions, Molnar (2019) provided a useful survey of existing
particularly by proposing a methodology to address the approaches to interpretability, including ways to quan-
second question, which is often neglected in the litera- tify the inf luence of a given predictor toward the model
ture. Specifically, we propose a set of interpretability outcome, as well as ways to analyze the nature of the
metrics, collectively named a model fingerprint, to decom- relationship (e.g., linear, nonlinear) between predictors
pose the behavior of any model’s predictions into linear, and outcome. For instance, it is common to compute a
nonlinear, and interaction effects among predictors. measure of variable importance to quantify the predictive
We also show how to decompose the model’s predictive strength of each input variable in a model, but the method
efficacy into these components. Next, we explore these for doing so is usually specific to the model in question,
concepts in the context of foreign currency investing. limited in scope, and far from unified. For example, the
We present a case study applying random forest, gra- importance of a predictor in a multiple linear regression
dient boosting machine, and neural network algo- might be defined as the absolute value of its t-statistic.
rithms to predict one-month-forward currency returns. For tree-based models, however, the total reduction in
We choose to illustrate these concepts in the currency prediction error over all nodes that select the variable
market for a number of important reasons. The currency of interest is commonly used. The list extends with
market is one of the largest and most actively traded many proposals of custom variable importance scores
global markets and thus a very important one for many for specific model types (Kuhn 2008). A methodology
investors. In particular, we study the behavior of a subset known as partial dependency (Friedman 2001) can be
of exchange rate investments, consisting of all pairs used to understand the relationship between predictors
(cross-rates) of the 10 largest currencies. Though the and the model outcome. Another measure proposed by
amount of data involved in currency prediction is not Greenwell, Boehmke, and McCarthy (2018) uses the
2 Beyond the Black Box: An Intuitive Approach to Investment Prediction with M achine L earning Winter 2020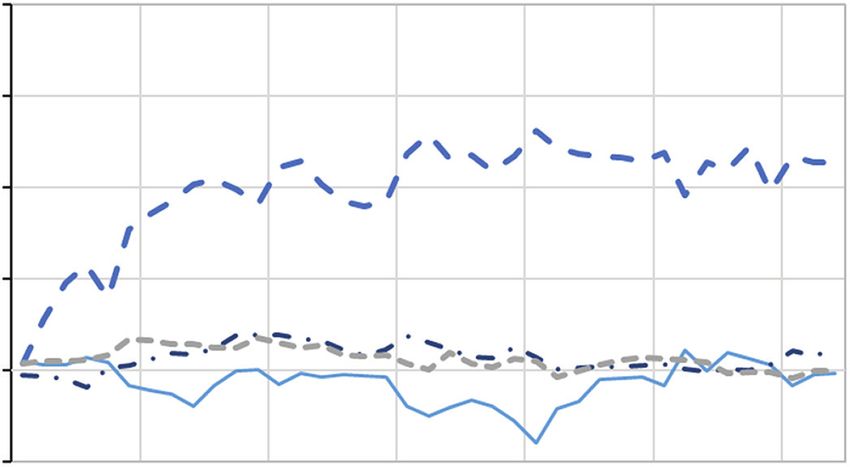
f latness of a predictor’s partial dependency as a measure specified loss function) and proceed iteratively to
of variable inf luence. fit the residuals from previous iterations, leading to
Our proposed approach, which we call a model a phenomenon known as boosting (Friedman 2001).
fingerprint, is distinguished from those in the earlier 3. Neural networks consist of nested data processing
literature. It decomposes model predictions into linear, layers transforming inputs into predictions. In deep
nonlinear, and interaction components and offers an networks, multiple nodes and hidden layers pro-
intuitive, model-independent notion of predictive effi- vide the capacity to model highly complex rela-
cacy. The fingerprint metrics are expressed directly in tionships (Goodfellow, Bengio, and Courville
It is illegal to make unauthorized copies of this article, forward to an unauthorized user, or to post electronically without Publisher permission.
units of the predicted returns, making them compa- 2016). In our application to currencies, we use a
rable across any set of models. This approach offers valu- relatively shallow feed-forward network architec-
able insights in understanding how a machine learning ture with no more than four hidden layers.
model outcome is affected by the presence of interactions
among different drivers of performance. Model Fingerprints (Part 1):
We structure the remainder of the article as fol- Decomposition of Predictions
lows. First, we introduce our methodology for model
fingerprints, including a decomposition of a model’s After a model is selected and calibrated on training
predictions and a decomposition of its performance. data, it can be used to map any desired set of input values
Second, we present an intuitive application to currency into a predicted value. Although it is usually straightfor-
investing, including an evaluation of performance on ward to calculate the prediction value, the actual pre-
both training and testing samples. Last, we summarize diction mechanism can be quite intricate and difficult
and conclude. to visualize or understand for all but the simplest cases.
Our goal is to summarize the characteristics of a given
METHODOLOGY model in terms of its linear, nonlinear, and interaction
effects. In particular, we quantify how much varia-
Machine Learning Models tion in predicted values results from variation in each
input variable—and each pair of variables—in isolation,
The methodology we present for model finger- holding all else constant. We refer to this set of metrics
prints is general and applies to any predictive model, as a fingerprint because it provides a concise and distinc-
but it is helpful to keep in mind some specific examples. tive description of the predictive characteristics of the
In this paper, we consider three machine learning models. calibrated model.
Even with just three models, this collection has diver- Our methodology modifies and extends the notion
sity in terms of model characteristics and capabilities, of partial dependence introduced by Friedman (2001).
architecture complexity (e.g., nonlinear, tree based), and The partial dependence function captures the mar-
learning styles. We brief ly describe the three models and ginal prediction derived from the average effect of one
refer the interested reader to further machine learning variable in isolation. Let us denote a model prediction
resources, such as work by Kuhn and Johnson (2013) function as
and Hastie, Tibshirani, and Friedman (2008), for details.
ŷy = f̂f ( x1 , x 2 , …, xm ) (1)
1. Random forests aggregate the outcomes of many
simple decision trees developed independently on This prediction depends on each of the M input
randomly selected subsets of predictors and data. variables, whereas the partial dependence function only
This process, known as bootstrap aggregating or depends on one of the input variables, xk. For a given
bagging (Hastie, Tibshirani, and Friedman 2008), value of xk, this partial dependence function returns the
aims to preserve the ability of tree-based models to expected value of the prediction over all other possible
capture conditional effects in data while mitigating values for the other predictors, which we denote as x \k:
their tendency to overfit the training sample.
2. Gradient boosting machines also use simple ŷyk = f̂f k ( xk ) = E x\ k [ fˆ ( x1 , x 2 , …, xm )] = ∫ fˆ ( xk , x \k ) p( x \k )ddx \k
decision trees as base learners, but they use an addi-
(2)
tive model to minimize prediction errors (given a
Winter 2020 The Journal of Financial Data Science 3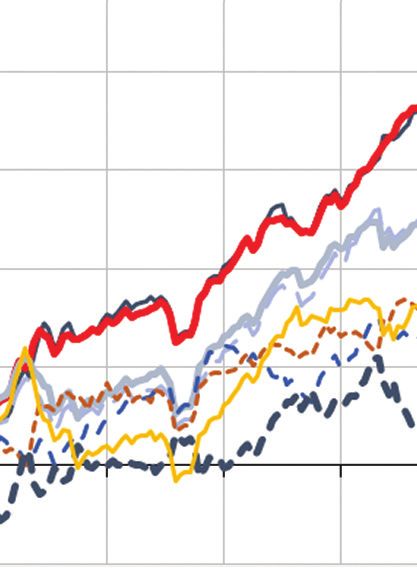
By marginalizing the prediction output over the partial dependence function, and xk,i is the ith value of
distribution of all other predictor variables, the partial xk in the dataset.
dependence function provides an intuitive sense for the Next, we define the nonlinear prediction effect—
marginal impact of the variable of interest, which we the predictive contribution of the nonlinear com-
may think of as a partial prediction. In practice, the ponent—as the mean absolute deviation of the total
procedure to estimate the partial dependence function marginal (single variable) effect around its corresponding
from the empirical data is as follows: linear effect. When this procedure is applied to an ordi-
nary linear model, the nonlinear effects equal precisely
It is illegal to make unauthorized copies of this article, forward to an unauthorized user, or to post electronically without Publisher permission.
1. Choose a permissible value for xk. zero, as they should.
2. Combine this value with one of the actual input
N
vectors for the remaining variables, x \k , and 1
generate a new prediction from the function:
Nonlinear predictionn eeffect ( xk ) =
N
∑abs( fˆ [ x k k ,i ] − lˆk [( xk ,i )])
i =1
ŷy = f̂fˆ ( x1 , x 2 , …, xm ). (4)
3. Repeat step 2 with every input vector for x \k , Exhibit 1 depicts these relationships graphically.
holding the value for xk constant, and record all The linear and nonlinear effects are intuitively related
predictions. to the shaded areas, as shown in Exhibit 1.1
4. Average all the predictions for this value of xk to A similar method can be applied to isolate the
arrive at the value of the partial prediction at that interaction effects attributable to pairs of variables xk
point, yˆ xk . and xl, simultaneously. The procedure for doing this is
5. Repeat steps 1 through 4 for any desired values of the same as given earlier, but in step 1 values for both
xk and plot the resulting function. variables are chosen jointly.
The partial dependence function will have small yŷk ,l = ff̂ k ,l ( xk , xl ) = E xk {E xl [ fˆ ( x1 , x 2 , …, xm )]} (5)
deviations if a given variable has little inf luence on
the model’s predictions. Alternatively, if the variable is
We define the pairwise interaction effect as the de-
highly inf luential, we will observe large f luctuations in
meaned joint partial prediction of the two variables
prediction based on changing the input values. When
minus the de-meaned partial predictions of each vari-
this procedure is applied to an ordinary linear regres-
able independently. When this procedure is applied to
sion model, the plot will be a straight line with a slope
an ordinary linear model, the interaction effects equal
equal to the regression coefficient of xk. Therefore, it is
precisely zero, as they should.
intuitive to view the partial dependence function as a
generalized version of a regression coefficient that allows Pairwise
ir
irwise interactionn eeffect ( xk , xl )
for nonlinear effects. N N
1
Next, we decompose a variable’s marginal impact
into a linear component and a nonlinear component by
=
N2
∑∑abs[ fˆ k ,l ( xk ,i , xl , j ) − ff̂ k ( xk ,i ) − ff̂ l ( xl , j )] (6)
i =1 j =1
obtaining the best fit (least squares) regression line for
the partial dependence function. We define the linear Our approach to defining the pairwise interaction
prediction effect—the predictive contribution of the effect is conceptually similar to the H-statistic intro-
linear component—as the mean absolute deviation of duced by Friedman and Popescu (2008). The H-statistic
the linear predictions around their average value. compares joint variable interactions to the sum of the rel-
evant individual variable effects, all measured with par-
Linearr pre
pprediction
redi
dict
ctio
ionn eeffect ( xk )
1
N
N
This illustration is based on the random forest model, which
1 1
=
N
∑abs lˆk [ xk,i ] − N ∑ fˆk [ xk, j ] (3) will be discussed in the next section. The area under the curve is
a stylized example that applies exactly if the predictor values are
i =1 j =1
uniformly distributed across their domain. In practice, we sum the
absolute deviations over all observed values for the predictor, so
In Equation 3, for a given predictor xk, the predic-
ˆ some parts of the predictive function will be more highly repre-
tion lk ( xk ,i ) results from the linear least square fit of its sented than others.
4 Beyond the Black Box: A n I ntuItIve ApproAch to I nvestment p redIctIon wIth m AchIne L eArnIng Winter 2020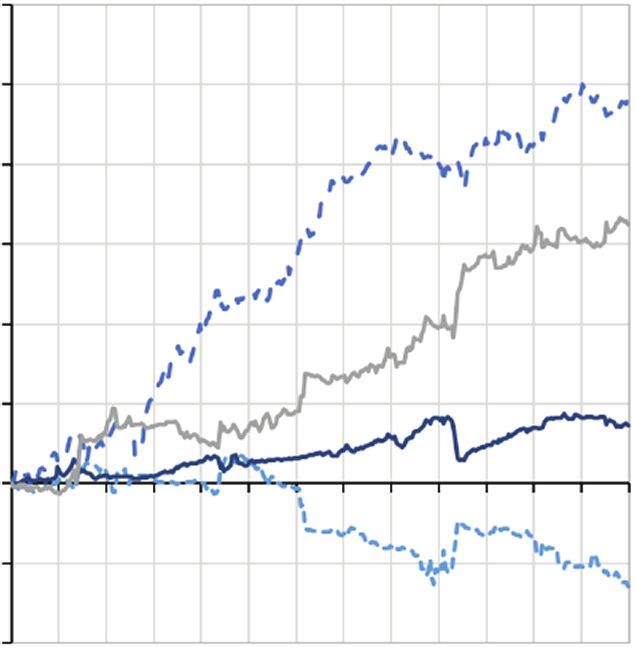
eXHiBiT 1
Partial Prediction (left), Linear Effect (middle), and Nonlinear Effect (right)
5HVSRQVH
5HVSRQVH
5HVSRQVH
It is illegal to make unauthorized copies of this article, forward to an unauthorized user, or to post electronically without Publisher permission.
± ± ±
± ± ±
± ± ±
± ± ± ± ± ± ± ± ±
3UHGLFWRU 3UHGLFWRU 3UHGLFWRU
3DUWLDO'HSHQGHQFH $
$YHUDJH3UHGLFWLRQ /LQHDU)LW
tial dependence functions. It sums the squares of these demystify the drivers of model predictions and facilitate
incremental interaction effects across every data point interpretations of why a model behaves the way it does.
and then divides by the sum of the squared total joint
predictions. In other words, it equals the variance of Model Fingerprints (Part 2):
incremental interaction effects divided by the variance of Decomposition of Performance
the total joint predictions. Our approach in Equation 6
differs in two ways. First, we use the mean absolute devi- Although the fingerprint metrics from Part 1 pro-
ation to measure the extent of the effect, rather than the vide insight into the behavior of a predictive function,
squared deviations (variance), which makes our measure they do not provide any information about the effective-
less sensitive to outliers in the data. Second, we explicitly ness of those predictions. We now turn our attention to
keep our measure in units of the predicted variable for this issue and apply the same framework to decompose
easy interpretation and comparison to the linear and prediction efficacy into its component parts. We choose
nonlinear prediction effects we measured previously, so to measure efficacy in terms of the performance of port-
we present the mean absolute deviation directly, without folios formed from the model’s predictions. This way, the
the denominator (normalization) that is included in the assessment is made in economically meaningful units, is
H-statistic. diversified across assets (such as currency pairs) at each
Exhibit 2 shows an example of an isolated pairwise point in time to mitigate noise, and can be observed as
interaction effect in two dimensions. The total extent of a time series for additional insights.
the interaction effect is intuitively related to the volume We have already described the methodology to
under the surface defined by these two dimensions (anal- decompose the overall prediction function. To attri-
ogous to the shaded areas in Exhibit 1). bute a model’s performance to its component parts,
The metrics we have described here offer attrac- we extract partial predictions based only on a subset
tive properties. First, they can be applied to any set of of the predictive components and form portfolios from
predictive models, and fingerprint results are comparable those partial predictions. In Part 1, we discussed partial
across them. Second, they measure linear, nonlinear, predictions based on the information from one input
and interaction effects in common units that are eco- variable. The partial predictions that we consider now
nomically meaningful (units of the response variable are aggregated across all of the predictor variables in the
that is being predicted). Third, they extend highly intui- model, but they are partial in the sense that they only use
tive and familiar ordinary linear regression concepts to a subset of the predictive components from our decom-
the machine learning models. In summary, they help position (linear, nonlinear, and interaction effects).
Winter 2020 The Journal of Financial Data Science 5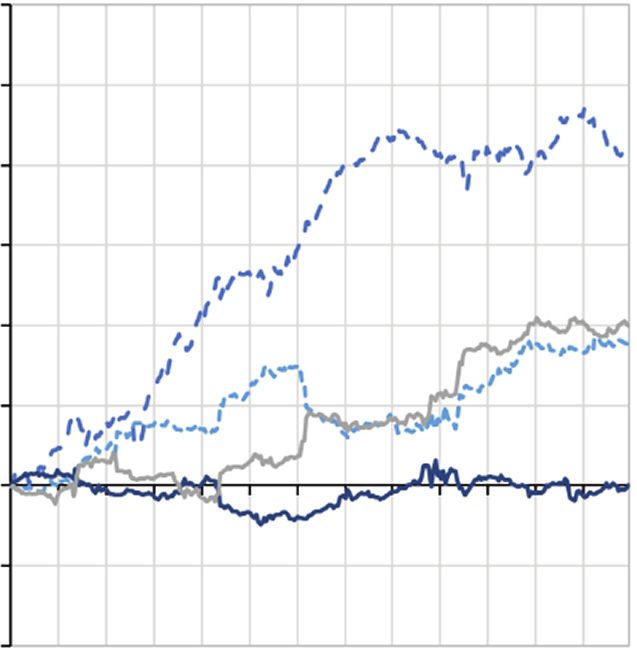
eXHiBiT 2
Pairwise Interaction Effect

                         1.0      0.4%     0.4%       0.3%       0.2%      0.1%     0.0%      –0.1%    –0.3%    –0.4%    –0.6%                 0.4%

                         0.9      0.3%     0.3%       0.2%       0.1%      0.1%     0.0%      –0.1%    –0.2%    –0.3%    –0.4%                 0.3%

                         0.8      0.2%     0.1%       0.1%       0.1%      0.1%     0.0%       0.0%    –0.1%    –0.2%    –0.3%                 0.2%

                                                                                                                                                                     It is illegal to make unauthorized copies of this article, forward to an unauthorized user, or to post electronically without Publisher permission.
                         0.7      0.0%     0.0%       0.0%       0.0%      0.0%     0.0%       0.0%     0.0%    –0.1%    –0.1%                 0.1%
           Predictor 2

                                                                                                                                    Response
                         0.6      0.0%     0.0%       0.0%       0.0%      0.0%     0.0%       0.0%     0.0%     0.0%     0.0%                 0.0%

                         0.4   –0.1%     –0.1%      –0.1%      –0.1%       0.0%     0.0%       0.0%     0.1%     0.1%     0.2%                 –0.1%

                         0.3   –0.2%     –0.2%      –0.1%      –0.1%       0.0%     0.0%       0.1%     0.1%     0.2%     0.3%                 –0.2%

                         0.2   –0.2%     –0.2%      –0.2%      –0.1%       –0.1%    0.0%       0.1%     0.1%     0.2%     0.3%                 –0.3%

                         0.1   –0.2%     –0.2%      –0.2%      –0.1%       –0.1%    0.0%       0.1%     0.2%     0.3%     0.4%                 –0.4%

                         0.0   –0.3%     –0.2%      –0.2%      –0.1%       –0.1%    0.0%       0.1%     0.2%     0.3%     0.4%                 –0.6%

                               –0.5%     –0.4%      –0.3%      –0.2%       –0.1%    0.0%       0.1%     0.2%     0.3%     0.4%
                                                                            Predictor 1

           M                                  M                                                  pairwise interaction predictions minus the time
     ŷy = ∑L
            Liinea
              inear   ffect ( xk ) + ∑Nonlinearr eeffect( xk )
               near eeffe                                                                        series of returns from steps 1 and 2.
          k =1                               k =1
                                                                                              4. The higher-order interactions performance
          +              ∑     Pairwise
                                 ir
                                 irwise interactionn eeffect ( xk , xl )                         effect is equal to the time series of returns of port-
               {k ,l }∈M ,k ≠ l                                                                  folios formed from the full predictive model minus
          + Higher -order interactionn eeffects
                                            ct                                (7)                the time series of returns from steps 1, 2, and 3.
                                                                                                 This captures the inf luence of higher-order inter-
      We compare the returns of portfolios built from                                            actions that occur above and beyond the pairwise
different subsets of predictive components to arrive at                                          interactions on the predictive models.3
time series of returns corresponding to each component.2
In particular, we define each component as follows:                                              The sequence in which we compute these per-
                                                                                           formance effects may at first seem strange, but it serves
    1. The linear (unconditional) performance effect                                       an important purpose. The interaction effects come
       is equal to the time series of returns of portfolios                                second in the sequence because they are, in a sense,
       formed from linear predictions in isolation.                                        more fundamentally important to investment predic-
    2. The pairwise interactions (conditional) perfor-                                     tion than are the nonlinear sizing effects. Interactions
       mance effect is equal to the time series of returns                                 allow for conditional relationships between variables,
       of portfolios formed from the combined linear and                                   and conditional relationships can dramatically change
       pairwise interaction predictions minus the time                                     the directionality of a prediction. For example, suppose
       series of returns from step 1.                                                      that variable A is a positive predictor when B is low
    3. The nonlinear (sizing) performance effect is                                        but a negative predictor when B is high. Furthermore,
       equal to the time series of returns of portfolios                                   imagine that variable A is a stronger predictor when
       formed from the combined linear, nonlinear, and                                     its value is at extreme highs or lows than when it is
      2
       In our empirical analysis, we use a simple ranking and equal
                                                                                                 3
weighting to construct portfolios, but other portfolio construction                               We quantify the impact of higher-order interaction effects
methods could be used instead.                                                             by exclusion because they are too numerous to evaluate directly.

6    Beyond the Black Box: A n I ntuItIve ApproAch to I nvestment p redIctIon wIth m AchIne L eArnIng                                                  Winter 2020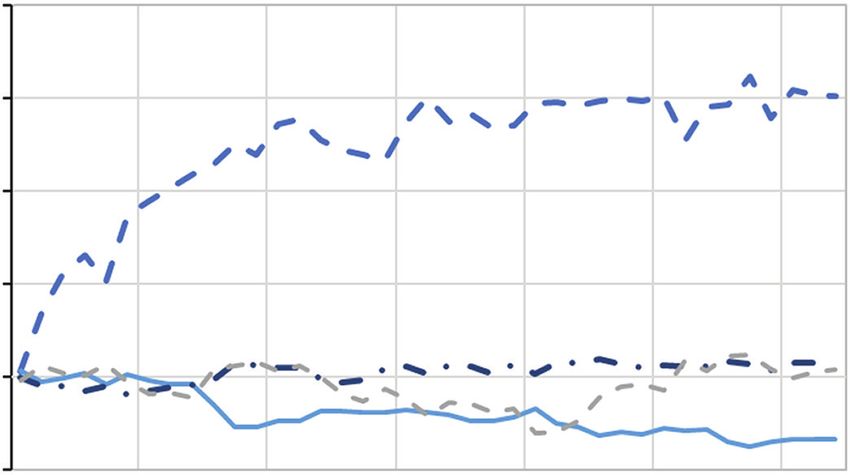
in the middle of its range (a nonlinear effect). In this represent investable exposures in the currency market.4
example, trying to isolate the nonlinear performance We form a dataset of monthly returns for each of the
effect of A will produce very counterintuitive—and exchange rate pairs from the G10 currencies: Australian
possibly meaningless—results if we do not account for dollar (AUD), Canadian dollar (CAD), Swiss franc
its conditionality on B. The nonlinear performance in (CHF), Euro (EUR),5 British pound (GBP), Japanese
isolation implies a larger prediction for both high and yen ( JPY), Norwegian krone (NOK), New Zealand
low values of A (imagine a U-shaped curve). Only in dollar (NZD), Swedish krona (SEK), and US dollar
combination with B do we see that half of these strong (USD). Our full dataset includes the returns of each of
It is illegal to make unauthorized copies of this article, forward to an unauthorized user, or to post electronically without Publisher permission.
positions take the opposite sign when they enter into the 90 currency pairs (quoted in both directions, to avoid
the full model’s prediction. Although it may not be pos- the arbitrary effect of one quoting convention) observed
sible to prevent this type of issue altogether, we suspect for 351 months from January 1990 to March 2019, for
that for many popular models, considering interaction a total of 31,950 observations. We split the data into a
effects before nonlinear effects for performance decom- training sample spanning January 1990 to December
position is likely to yield a more useful interpretive 2015 and a test sample spanning January 2016 to March
analysis. In summary, it seems reasonable to consider 2019, which we reserve for final performance evaluation.
conditional relationships before nonlinear sizing effects. We structure the prediction problem as a panel
Lastly, it is worth noting that this issue does not affect regression: the return of a given currency pair at a given
the decomposition of predictions in the previous sec- point in time is to be predicted with the information
tion because that analysis is concerned with the mag- available about that pair. The panel regression combines
nitude of predictive components and not their positive cross-sectional and time-series information, allowing
or negative direction. the model to be trained on increased variability from a
greater number of observations.6 We deliberately restrict
EMPIRICAL APPLICATION TO FOREIGN our attention to a narrow set of established currency
CURRENCY INVESTING factors as predictors. This simplicity makes it easier to
view the similarities and differences in how each model
In this section, we apply the three machine processes the data to form predictions. Each predictor is
learning techniques described earlier to the task of for- motivated by established results in the currency market:
eign currency prediction. This real-world empirical
study allows us to identify intuitive relationships using 1. The short-term interest rate differential between
the model fingerprint approach. We begin by describing countries forms the basis for the carry trade, where
the currency model specification, data, and proce- forward contracts for currencies with higher
dure for training. It is critical to distinguish between interest rates have historically outperformed those
performance in the training sample (before 2016) and with lower interest rates (Burnside, Eichenbaum,
performance in the testing sample (after 2016). First, and Rebelo 2011).
we thoroughly examine the model fingerprints for
4
prediction and performance based on the training data A currency forward contract is an agreement to buy or sell a
to better understand the behavior and data processing given currency versus another currency at some point in the future.
The market price of the forward rate is determined by a no-arbitrage
mechanisms of each model. Second, we present perfor- condition called Covered Interest Parity because one may achieve
mance results and interpretation for the testing sample, the same payout as the forward contract by borrowing money in one
which provides a realistic indication of how the models currency and investing it in the other. Thus, a currency position—
behave when exposed to previously unseen data. whether implemented using a forward contract or by borrowing
and investing across countries—is self-funding and has a total return
equal to the interest rate differential between the two countries plus
Model Specification and Training the change in the spot exchange rate over the investment horizon.
We model actual forward prices, which are investable.
The goal of our empirical study is to predict one- 5
Before the introduction of the Euro, we proxy it with the
month-forward returns for major currencies. We focus German mark.
6
on the total return of forward contracts because they The information about a given currency pair partly overlaps
with the information about other pairs that contain one of the same
currencies. However, the information is not completely redundant
and therefore helps in model training.
Winter 2020 The Journal of Financial Data Science 7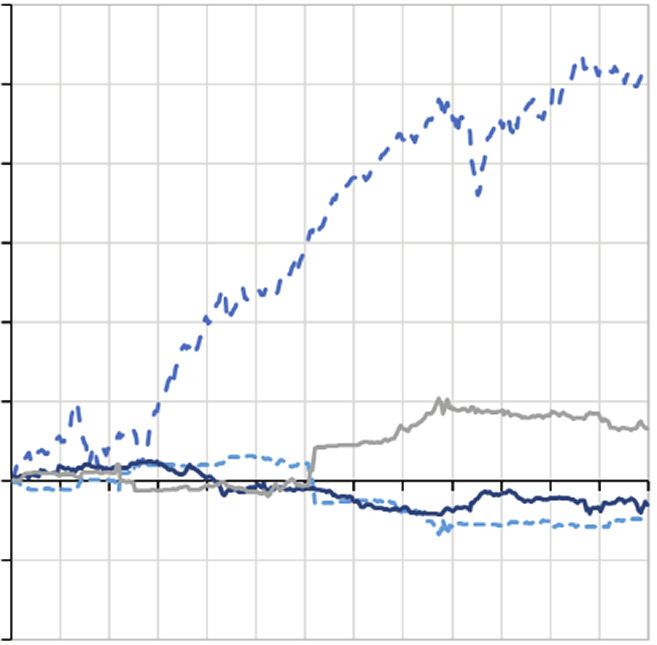
2. The trailing five-year spot return adjusted for               to the data. In essence, cross validation creates synthetic
      trailing five-year inf lation differential pro-               unseen evaluation samples from subsets of the training
      vides an indication of the deviation from fair value          data. Specifically, we divide our panel of training data
      for a currency pair, based on the notion of relative          into 10 contiguous and nonoverlapping blocks of time.
      purchasing power parity, and underpins the valu-              For a given set of hyperparameters, we fit the model on
      ation trade. Currencies that are undervalued have             every combination of nine blocks and evaluate model
      historically outperformed those that are overvalued           performance using root mean squared error (RMSE)
      (Czasonis, Pamir, and Turkington 2019).                       on the remaining block. We store the composite predic-

                                                                                                                                   It is illegal to make unauthorized copies of this article, forward to an unauthorized user, or to post electronically without Publisher permission.
   3. The trailing one-year spot return for a cur-                  tive performance (RMSE across all evaluation blocks)
      rency pair informs a trend strategy. Currencies               of the model under the current set of hyperparameters
      that recently rose in value have historically out-            and then search for the hyperparameters that result in
      performed those that recently lost value (Burnside,           the best overall fit.
      Eichenbaum, and Rebelo 2011).                                       The overall performance of machine learning
   4. The trailing one-year equity return differen-                 regression models is typically evaluated using measures
      tial between countries constitutes an equity differ-          such as R 2 and RMSE. Although these measures can
      ential trade. Currencies whose local equity market            be informative, they may not adequately ref lect how a
      has risen recently have historically outperformed             model performs in a financial portfolio setting. Thus, it
      those whose equity market has done relatively                 is prudent to test the return and risk performance of real-
      poorly (Turkington and Yazdani 2019).                         istic portfolios formed from model predictions. To do
   5. Currency market turbulence is a multivariate                  this, we identify for each month the 27 currency pairs
      unusualness score of the currency market based on             with the largest prediction magnitude and assign long
      the Mahalanobis distance (Kritzman and Li 2010),              or short positions depending on each prediction’s direc-
      and we employ it as a measure of the overall market           tional sign. The selection of 27 out of the 45 nonover-
      risk profile that is more persistent than the vola-           lapping pairs ensures a diversified portfolio by avoiding
      tility of individual currency pairs. Larger magni-            significant exposure to one single currency and is in line
      tude return swings and correlation breakdowns                 with a traditional top three, bottom three approach to
      both increase the amount of turbulence observed.              building long–short currency portfolios.
      Some currency factors, such as the carry trade,
      have historically behaved very differently during                   Model Fingerprints: Evaluation
      turbulent versus quiet periods.                                     on the Training Sample

      Hyperparameter tuning is an important issue                         Exhibit 3 presents the model fingerprints of pre-
that affects the training of machine learning models.               dictor inf luence. It is notable that the relative size of
Hyperparameters differ by model, but examples include               linear effects is nearly identical across all three models
the number and depth of decision trees in a random                  (even though their absolute size differs). All models
forest, the depth and sample rate of trees in a gradient            exhibit the most nonlinearity with respect to the interest
boosting machine, and the activation function and size              rate differential factor but differ in their other nonlinear
of hidden layers in a neural network. It is often desir-            effects. The interaction between currency turbulence
able for these parameter choices to be informed directly            and interest rate differential is deemed the most salient
by the data. The goal of proper calibration is to achieve           pairwise interaction effect in each case, but again the
(near) optimal performance of a model for the task at               other interaction effects vary across the models. A closer
hand, while minimizing the risk of overfitting in the               look into the interaction heatmaps shown in Exhibit 4
training sample. As such, hyperparameter tuning can                 reveals that all three models make predictions in line with
be challenging and a task that requires an extra layer              the conventional carry trade (based on the interest rate
of data processing. To this end, we use a 10-fold cross-            differential) when turbulence is low. However, during
validation approach to identify the most desirable set of           highly turbulent regimes, all three models reverse this
hyperparameters while mitigating the risk of overfitting            relationship. This interaction effect aligns with previous

8   Beyond the Black Box: An Intuitive Approach to Investment Prediction with M achine L earning                    Winter 2020
It is illegal to make unauthorized copies of this article, forward to an unauthorized user, or to post electronically without Publisher permission.
Winter 2020
&XUUHQF\7XUEXOHQFH &XUUHQF\7XUEXOHQFH &XUUHQF\7XUEXOHQFH
(TXLW\'LI
(TXLW\'LIIHUHQWLDO (TXLW\'LI
(TXLW\'LIIHUHQWLDO (TXLW\5HWXUQ'LI
(TXLW\5HWXUQ'LIIHUHQWLDO
eXHiBiT 3
/LQHDU
/LQHDU
/LQHDU
,QWHUHVW5DWH'LI
,QWHUHVW5DWH'LIIHUHQWLDO ,QWHUHVW5DWH'LI
,QWHUHVW5DWH'LIIHUHQWLDO ,QWHUHVW5DWH'LI
,QWHUHVW5DWH'LIIHUHQWLDO
/LQHDU(IIHFW
/LQHDU(IIHFW
/LQHDU(IIHFW
6SRW5HWXUQ 6SRW5HWXUQ 6SRW5HWXUQ
9
9DOXDWLRQ 9
9DOXDWLRQ 9
9DOXDWLRQ
&XUUHQF\7XUEXOHQFH &XUUHQF\7XUEXOHQFH &XUUHQF\7XUEXOHQFH
(TXLW\'LI
(TXLW\'LIIHUHQWLDO (TXLW\5HWXUQ'LI
(TXLW\5HWXUQ'LIIHUHQWLDO (TXLW\5HWXUQ'LI
(TXLW\5HWXUQ'LIIHUHQWLDO
,QWHUHVW5DWH'LI
,QWHUHVW5DWH'LIIHUHQWLDO ,QWHUHVW5DWH'LI
,QWHUHVW5DWH'LIIHUHQWLDO ,QWHUHVW5DWH'LI
,QWHUHVW5DWH'LIIHUHQWLDO
1RQOLQHDU
1RQOLQHDU
1RQOLQHDU
Model Fingerprints (decomposition of predictions)
6SRW5HWXUQ 6SRW5HWXUQ 6SRW5HWXUQ
1RQOLQHDU(IIHF
1RQOLQHDU(IIHF
1RQOLQHDU(IIHF
W
W
W
9
9DOXDWLRQ 9
9DOXDWLRQ 9
9DOXDWLRQ
5DQGRP)RUHVW
1HXUDO1HWZRUN
(TXLW\'LI
(TXLW\'LIIHUHQWLDO (TXLW\'LI
(TXLW\'LIIHUHQWLDO (TXLW\'LI
(TXLW\'LIIHUHQWLDO
&XUUHQF\7XUEXOHQFH &XUUHQF\7XUEXOHQFH &XUUHQF\7XUEXOHQFH
*UDGLHQW%RRVWLQJ0DFKLQH
(TXLW\'LI
(TXLW\'LIIHUHQWLDO (TXLW\'LI
(TXLW\'LIIHUHQWLDO (TXLW\'LI
(TXLW\'LIIHUHQWLDO
6SRW5HWXUQ 6SRW5HWXUQ 6SRW5HWXUQ
(TXLW\'LI
(TXLW\'LIIHUHQWLDO (TXLW\'LI
(TXLW\'LIIHUHQWLDO (TXLW\'LI
(TXLW\'LIIHUHQWLDO
9
9DOXDWLRQ 9
9DOXDWLRQ 9
9DOXDWLRQ
,QWHUHVW5DWH'LI
,QWHUHVW5DWH'LIIHUHQWLDO ,QWHUHVW5DWH'LI
,QWHUHVW5DWH'LIIHUHQWLDO ,QWHUHVW5DWH'LI
,QWHUHVW5DWH'LIIHUHQWLDO
&XUUHQF\7XUEXOHQFH &XUUHQF\7XUEXOHQFH &XUUHQF\7XUEXOHQFH
,QWHUHVW5DWH'LI
,QWHUHVW5DWH'LIIHUHQWLDO ,QWHUHVW5DWH'LI
,QWHUHVW5DWH'LIIHUHQWLDO ,QWHUHVW5DWH'LI
,QWHUHVW5DWH'LIIHUHQWLDO
(TXLW\'LI
(TXLW\'LIIHUHQWLDO (TXLW\'LI
(TXLW\'LIIHUHQWLDO (TXLW\'LI
(TXLW\'LIIHUHQWLDO
,QWHUHVW5DWH'LI
,QWHUHVW5DWH'LIIHUHQWLDO ,QWHUHVW5DWH'LI
,QWHUHVW5DWH'LIIHUHQWLDO ,QWHUHVW5DWH'LI
,QWHUHVW5DWH'LIIHUHQWLDO
6SRW5HWXUQ 6SRW5HWXUQ 6SRW5HWXUQ
,QWHUHVW5DWH'LI
,QWHUHVW5DWH'LIIHUHQWLDO ,QWHUHVW5DWH'LI
,QWHUHVW5DWH'LIIHUHQWLDO ,QWHUHVW5DWH'LI
,QWHUHVW5DWH'LIIHUHQWLDO
3DLUZLVH,QWHUDFWLRQ
3DLUZLVH,QWHUDFWLRQ
3DLUZLVH,QWHUDFWLRQ
9
9DOXDWLRQ 9
9DOXDWLRQ 9
9DOXDWLRQ
6SRW5HWXUQ 6SRW5HWXUQ 6SRW5HWXUQ
&XUUHQF\7XUEXOHQFH &XUUHQF\7XUEXOHQFH
7
7XUEXOHQFH &XUUHQF\7XUEXOHQFH
7
7XUEXOHQFH
6SRW5HWXUQ 6SRW5HWXUQ 6SRW5HWXUQ
9
9DOXDWLRQ 9
9DOXDWLRQ 9
9DOXDWLRQ
9
9DOXDWLRQ 9
9DOXDWLRQ 9
9DOXDWLRQ
&XUUHQF\7XUEXOHQFH &XUUHQF\7XUEXOHQFH &XUUHQF\7XUEXOHQFH
The Journal of Financial Data Science
9eXHiBiT 4
Interaction Effects between Interest Rate Differential and Currency Turbulence
Random Forest Gradient Boosting Machine
1.0 0.05% 0.05% 0.05% 0.04% –0.04% –0.05% –0.05% –0.05% 1.0 0.18% 0.18% 0.18% –0.04% –0.04% –0.15% –0.15% –0.15%
0.8 0.05% 0.05% 0.05% 0.04% –0.04% –0.05% –0.05% –0.05% 0.8 0.18% 0.18% 0.18% –0.04% –0.04% –0.15% –0.15% –0.15%
Currency Turbulence
It is illegal to make unauthorized copies of this article, forward to an unauthorized user, or to post electronically without Publisher permission.
Currency Turbulence
0.7 0.05% 0.05% 0.05% 0.04% –0.04% –0.05% –0.05% –0.05% 0.7 0.18% 0.18% 0.18% –0.04% –0.04% –0.15% –0.15% –0.15%
0.6 0.02% 0.02% 0.02% 0.02% –0.02% –0.02% –0.02% –0.02% 0.6 0.18% 0.18% 0.18% –0.04% –0.04% –0.15% –0.15% –0.15%
0.4 0.01% 0.01% 0.01% 0.01% –0.01% –0.01% –0.01% –0.01% 0.4 0.13% 0.13% 0.13% –0.01% –0.01% –0.12% –0.12% –0.12%
0.3 –0.05% –0.05% –0.05% –0.05% 0.05% 0.05% 0.05% 0.05% 0.3 –0.23% –0.23% –0.23% 0.04% 0.04% 0.18% 0.18% 0.18%
0.2 –0.05% –0.05% –0.05% –0.05% 0.05% 0.05% 0.05% 0.05% 0.2 –0.23% –0.23% –0.23% 0.04% 0.04% 0.18% 0.18% 0.18%
0.0 –0.05% –0.05% –0.05% –0.05% 0.05% 0.05% 0.05% 0.05% 0.0 –0.23% –0.23% –0.23% 0.04% 0.04% 0.18% 0.18% 0.18%
–0.4% –0.3% –0.2% –0.1% 0.1% 0.2% 0.3% 0.4% –0.4% –0.3% –0.2% –0.1% 0.1% 0.2% 0.3% 0.4%
Interest Rate Differential Interest Rate Differential
Neural Network
1.0 0.44% 0.36% 0.25% 0.13% –0.03% –0.20% –0.40% –0.61%
0.8 0.25% 0.21% 0.15% 0.08% –0.01% –0.11% –0.24% –0.38%
Currency Turbulence
0.7 0.09% 0.08% 0.06% 0.04% 0.01% –0.04% –0.10% –0.17%
0.6 –0.04% –0.02% –0.01% 0.00% 0.01% 0.02% 0.02% 0.02%
0.4 –0.13% –0.10% –0.07% –0.03% 0.01% 0.06% 0.11% 0.17%
0.3 –0.20% –0.16% –0.12% –0.06% 0.01% 0.09% 0.18% 0.29%
0.2 –0.24% –0.20% –0.15% –0.08% 0.00% 0.11% 0.23% 0.37%
0.0 –0.26% –0.23% –0.17% –0.10% 0.00% 0.12% 0.26% 0.43%
–0.4% –0.3% –0.2% –0.1% 0.1% 0.2% 0.3% 0.4%
Interest Rate Differential
research on how turbulent regimes affect the carry trade understanding as the pairwise effects. On the other
(Kritzman and Li 2010). hand, there are times when the two move in opposition,
Exhibit 5 presents the model fingerprints from which indicates that the higher-order interaction effects
the perspective of predictive efficacy. Pairwise interac- are neutralizing or reversing the pairwise effect based
tions suggest conditional relationships at each point in on the confounding inf luence of other conditions that
time. Higher-order interactions performing in the same prevail at that time. In fact, all three models exhibit a
direction as the pairwise (as is often the case in 2008, large loss in 2002 that would have occurred from pair-
for example) indicates that the higher-order conditional wise interactions but was overturned by a higher-order
effects are confirming and even amplifying the same consideration in all three cases. Overall, the performance
10 Beyond the Black Box: A n I ntuItIve ApproAch to I nvestment p redIctIon wIth m AchIne L eArnIng Winter 2020eXHiBiT 5
Model Fingerprints (decomposition of performance)
5DQGRP)RUHVW *UDGLHQW%RRVWLQJ0DFKLQH 1HXUDO1HWZRUN
It is illegal to make unauthorized copies of this article, forward to an unauthorized user, or to post electronically without Publisher permission.
± ± ±
± ± ±
/LQHDU 3DLUZLVH,QWHUDFWLRQV 6L]LQJ +LJKRUGHU,QWHUDFWLRQV
decomposition provides insights into the degree to which of risk-adjusted return (information ratio), machine
a model relies on the component prediction effects. learning models outperformed the linear model, which
in turn outperformed the simple traditional strategies.
Performance in the Training Sample Grading boosting had the best in-sample performance,
with the highest annualized returns and one of the lowest
We are particularly interested in whether machine levels of risk. At the same time, returns from the gradient
learning strategies exceeded the performance of tradi- boosting machine had the highest excess kurtosis, indi-
tional currency strategies and a benchmark linear regres- cating a propensity for occasionally extreme monthly
sion model. A key consideration when training machine returns. It is also interesting to note the strong similarity
learning models is to reduce overfitting by avoiding in returns for the gradient boosting and neural network
aggressive data mining. To this end, we followed conven- models. Both outperform the other models by a signifi-
tional practice in structuring the training and validation cant margin, which perhaps is to be expected given the
process to minimize the expected gap in performance in nonlinear and interaction effects they find.
the training versus testing sample. Of course, we must
still acknowledge that even with the cross-validation Performance in the Testing Sample
process, which mitigates the potential to overfit the data,
these models have been selected for their performance on The understanding we have gained so far allows us
the training sample and have therefore benefited from to make interpretations about model tendencies, simi-
learning some of the features of the training data on larities, differences, and performance in the training
which we are evaluating performance here. Even with sample. The performance reliability of a model is
this caveat, a thorough analysis of training sample per- ref lected not only in its training sample performance
formance is important to gain an understanding of what but also when evaluated on unseen test data. Exhibits 8
each model is thinking. In the next section, we will and 9 present the results for the testing sample. As in
evaluate performance in the testing sample. the training sample, gradient boosting machine per-
Exhibits 6 and 7 present training sample perfor- forms well, continuing to generate comparatively high
mance across all models, including portfolios that are returns and low risk. However, the overall performance
formed on only one predictive variable in isolation gap with other models is not as wide, which may indi-
(carry, trend, valuation, and equity differential). In terms cate a mild degree of (inevitable) overfitting by the
Winter 2020 The Journal of Financial Data Science 11eXHiBiT 6
Portfolio Performance Summary Statistics (training data)
Equity Linear Random Gradient Neural
Carry Trend Valuation Differential Model Forest Boosting Machine Network
Return 3.27% 0.91% 1.70% 2.68% 3.66% 3.92% 6.12% 5.83%
Risk 6.50% 6.75% 5.82% 5.00% 5.22% 5.40% 4.94% 5.41%
Ratio 0.50 0.13 0.29 0.54 0.70 0.73 1.24 1.08
It is illegal to make unauthorized copies of this article, forward to an unauthorized user, or to post electronically without Publisher permission.
Skewness –0.69 0.10 0.99 –0.26 –0.60 –0.73 0.32 0.25
Kurtosis 1.24 3.97 4.89 0.84 2.02 2.21 4.93 3.16
Hit Rate 0.63 0.52 0.51 0.57 0.63 0.66 0.68 0.67
eXHiBiT 7
Portfolio Cumulative Returns for Different Strategies (training data)
180%
Neural Network
160%
Gradient Boosting Machine
Random Forest
140%
Linear Model
Equity Differential
ff
fferential
120%
V
Valuation
Trend
Cumulative Return
100%
Carry
80%
60%
40%
20%
0%
–20%
1990 1992 1994 1996 1998 2000 2002 2004 2006 2008 2010 2012 2014
gradient-boosting model. Overall, there is a convergence stress that their goal in this article is to understand the
in performance during this sample, with little separation tendencies of each model and to be able to demystify the
across the linear model and machine learning models. components of performance by attributing them to their
Most of the traditional currency strategies underper- component parts. The authors have intentionally erred
formed, with the exception of the equity differential. on the side of simplicity and have not tried to build the
This may indicate a reduced opportunity set based on best possible model. Exploring a wider range of variables
the predictor variables we have included. and models to enhance performance further would be
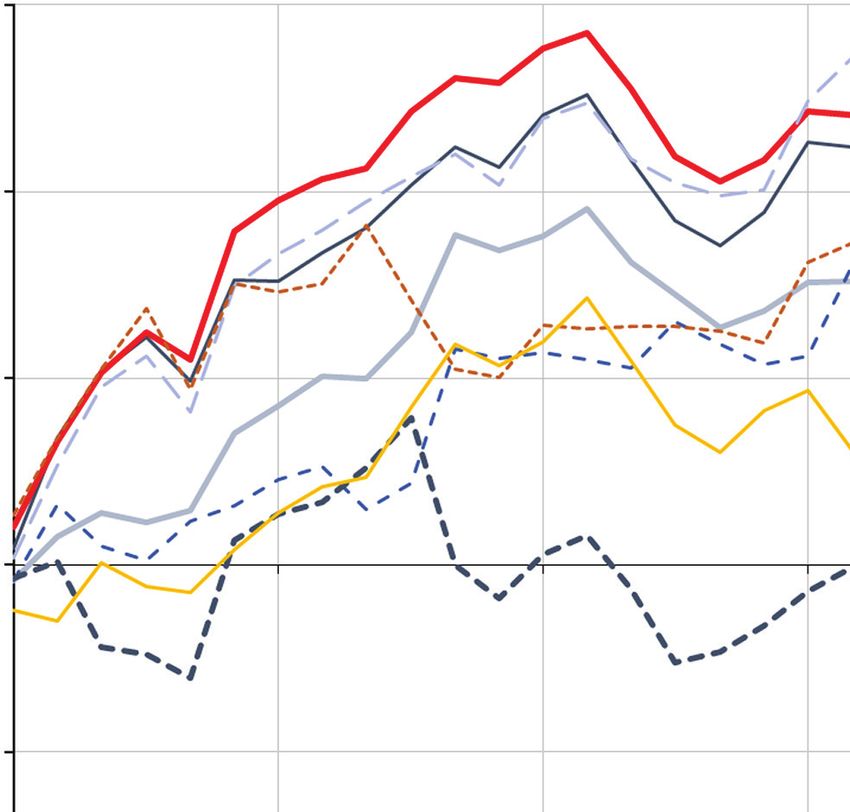
Exhibit 10 shows the performance decomposition an interesting and useful extension of our case study for
of the machine learning models over the testing sample currency investing.
and supports a similar conclusion. Again, the authors
12 Beyond the Black Box: A n I ntuItIve ApproAch to I nvestment p redIctIon wIth m AchIne L eArnIng Winter 2020eXHiBiT 8
Portfolio Performance Summary Statistics (test data)
Equity Linear Random Gradient Neural
Carry Trend Valuation Differential Model Forest Boosting Machine Network
Return 1.85% –1.82% 1.85% 3.37% 4.04% 3.52% 3.82% 3.96%
Risk 4.14% 4.84% 4.23% 3.98% 4.31% 3.66% 3.88% 4.18%
Ratio 0.45 –0.38 0.44 0.85 0.94 0.96 0.99 0.95
It is illegal to make unauthorized copies of this article, forward to an unauthorized user, or to post electronically without Publisher permission.
Skewness –0.37 –0.21 0.09 0.71 0.04 –0.36 –0.01 –0.39
Kurtosis 0.25 0.94 –0.39 0.99 0.28 1.14 1.14 0.83
Hit Rate 0.56 0.56 0.46 0.56 0.67 0.64 0.64 0.62
eXHiBiT 9
Portfolio Performance for Different Strategies (test data)
15%
10%
Cumulative Return
5%
0%
–5% Neural Network Gradient Boosting Machine
Random Forest Linear Model
Equity Differential
ff
fferential V
Valuation
Trend Carry
–10%
Jul-2018
Jan-2018
Jan-2019
Jan-2016
Jul-2016
Jan-2017
Jul-2017
CONCLUSION The authors find that the results are highly intuitive
and informative in a real-world application to currency
The authors argue that developing reliable and prediction. Interestingly, our findings reveal as much
intuitive interpretation is essential for the application of about the similarities between models as they do about
machine learning to investing. The authors introduce the differences. Despite possible concerns about com-
a framework for computing the fingerprint of machine plex models and their propensity to overfit, we find that
learning models to summarize the linear, nonlinear, and random forest, gradient boosting machine, and neural
pairwise and high-order interaction effects that drive network predicted linear effects are nearly indistin-
both predictions and performance. The framework the guishable from those of an ordinary linear regression.
authors propose is general and applicable to any pre- Where the models do behave differently, the finger-
dictive model, including base and ensemble models. print decompositions help identify the most important
Winter 2020 The Journal of Financial Data Science 13eXHiBiT 10
Subcomponent Cumulative Performances (test data)
Linear Model Random Forest
20% 20%
15% 15%
10% 10%
It is illegal to make unauthorized copies of this article, forward to an unauthorized user, or to post electronically without Publisher permission.
5% 5%
0% 0%
–5% –5%
Jan-16
Jul-16
Jan-17
Jul-17
Jan-18
Jul-18
Jan-19
Jan-16
Jul-16
Jan-17
Jul-17
Jan-18
Jul-18
Jan-19
Linear Pairwise Interactions Sizing High-order Interactions
Gradient Boosting Machine Neural Network
20% 20%
15% 15%
10% 10%
5% 5%
0% 0%
–5% –5%
Jan-16
Jul-16
Jan-17
Jul-17
Jan-18
Jul-18
Jan-19
Jan-16
Jul-16
Jan-17
Jul-17
Jan-18
Jul-18
Jan-19
Linear Pairwise Interactions Sizing High-order Interactions
components of prediction and performance, allowing for REFERENCES
further analysis and deeper understanding. We believe
that machine learning holds great promise for finan- Breiman, L. 2001. “Statistical Modeling: The Two Cultures.”
cial prediction and insight, but it is crucial for investors Statistical Science 16 (3): 199–215.
to apply domain expertise and intuition as part of the
Burnside, C., M. Eichenbaum, and S. Rebelo. 2011. “Carry
process. Additional tools will be required to meet this Trade and Momentum in Currency Markets.” Annual Review
need. Most importantly, we argue that it is not neces- of Financial Economics 3 (1): 511–535.
sary to view machine learning as a black box. People
often trust and learn from others’ perspectives despite an Czasonis, M., B. Pamir, and D. Turkington. 2019. “Carry
incomplete understanding of how that person’s brain or On.” The Journal of Alternative Investments 22 (2): 100–111.
thought process actually works. Likewise, we can derive
insights from machine learning models if we understand Friedman, J. H. 2001. “Greedy Function Approximation:
their tendencies and personalities, or more aptly, their A Gradient Boosting Machine.” Annals of Statistics 29 (5):
machinalities. 1189–1232.
14 Beyond the Black Box: A n I ntuItIve ApproAch to I nvestment p redIctIon wIth m AchIne L eArnIng Winter 2020Friedman, J. H., and B. E. Popescu. 2008. “Predictive Disclaimer
Learning via Rule Ensembles.” The Annals of Applied Statistics The material presented is for informational purposes only. The views ex-
pressed in this material are the views of the authors and are subject to change
2 (3): 916–954.
based on market and other conditions and factors; moreover, they do not
necessarily represent the official views of State Street Global Markets or
Goodfellow, I., Y. Bengio, and A. Courville. Deep Learning. State Street Corporation and its affiliates.
Cambridge, MA: MIT Press, 2016.
To order reprints of this article, please contact David Rowe at
Greenwell, B. M., B. C. Boehmke, and A. J. McCarthy. 2018. d.rowe@pageantmedia.com or 646-891-2157.
It is illegal to make unauthorized copies of this article, forward to an unauthorized user, or to post electronically without Publisher permission.
“A Simple and Effective Model-Based Variable Importance
Measure.” arXiv preprint, arXiv:1805.04755.
Gu, S., B. T. Kelly, and D. Xiu. “Empirical Asset Pricing
ADDITIONAL READING
via Machine Learning.” Chicago Booth Research Paper
No. 18-04, 2019.
Carry On
Hastie, T., R. Tibshirani, and J. Friedman. The Elements Megan Czasonis, Baykan Pamir, and David Turkington
of Statistical Learning, Data Mining, Inference, and Prediction, The Journal of Alternative Investments
2nd ed. New York: Springer, 2008. https://jai.pm-research.com/content/22/2/100
Heaton, J. B., N. G. Polson, and J. H. Witte. 2016. “Deep ABSTRACT: The carry trade in foreign currencies is known for
Learning for Finance: Deep Portfolios.” Applied Stochastic delivering positive returns, on average, and for occasionally suffering
Models in Business and Industry 33 (1): 3–12. large losses. While these characteristics prevail, on average, across
time and across currency pairs, the authors find that interest rate
Kritzman, M., and Y. Li. 2010. “Skulls, Financial Turbulence, differentials on their own are not sufficient to identify conditions in
and Risk Management.” Financial Analysts Journal 66 (5): 30–41. which currencies reliably exhibit these return and risk attributes. They
use three variables—valuation, crowding, and volatility—to identify
Kuhn, M. 2008. “Building Predictive Models in R Using the time periods and cross-sections of currencies in which the carry trade
Caret Package.” Journal of Statistical Software 28 (5). https:// performs best. They document a substantial difference in performance
www.jstatsoft.org/article/view/v028i05. between the carry trade applied to high-volatility versus low-volatility
currency pairs. In the full sample from 1984 to 2017, carry in high-
Kuhn, M., and K. Johnson. Applied Predictive Modeling. New volatility pairs has consisted of currencies that are undervalued, on
York: Springer, 2013. average, experience greater swings in valuation, and have boom and
bust cycles aligned with investor crowding. This finding is consistent
López de Prado, M. 2019. “Beyond Econometrics: A with the notion that carry represents a risk premium. Carry in low-
Roadmap Towards Financial Machine Learning.” Working volatility pairs has the opposite characteristics. Though both strategies
paper, 2019. performed well prior to the 2008 financial crisis, only carry in high-
volatility pairs has worked since.
Molnar, C. 2019. “Interpretable Machine Learning; A Guide
for Making Black Box Models Explainable.” https://chris- Triumph of the Empiricists: The Birth of Financial
tophm.github.io/interpretable-ml-book. Data Science
Joseph Simonian and Frank J. Fabozzi
Rasekhschaffe, K. C., and R. C. Jones. 2019. “Machine The Journal of Financial Data Science
Learning for Stock Selection.” Financial Analyst Journal 75 (3): https://jfds.pm-research.com/content/1/1/10
70–88.
ABSTRACT: The authors situate financial data science within the
Simonian, J., and F. J. Fabozzi. 2019. “Triumph of the broader history of econometrics and argue that its ascendance marks a
Empiricists: The Birth of Financial Data Science.” The Journal reorientation of the field toward a more empirical and pragmatic stance.
of Financial Data Science 1 (1): 12–18. They also argue that owing to the unique nature of financial infor-
mation, financial data science should be considered a field in its own
Turkington, D., and A. Yazdani. 2019. “The Equity Differ- right and not just an application of data science methods to finance.
ential Factor in Currency Markets.” Working paper.
Winter 2020 The Journal of Financial Data Science 15You can also read