BUILDING A SUSTAINABLE ELECTRIC VEHICLE BATTERY SUPPLY CHAIN: FREQUENTLY ASKED QUESTIONS - APRIL 2020
←
→
Page content transcription
If your browser does not render page correctly, please read the page content below
BUILDING A SUSTAINABLE ELECTRIC VEHICLE
BATTERY SUPPLY CHAIN:
FREQUENTLY ASKED QUESTIONS

APRIL 2020
AUTHORS

    Ethan N. Elkind

    Director, Climate Program, Center for Law, Energy & the Environment

    Patrick R. P. Heller

    Advisor, Natural Resource Governance Institute

    Senior Visiting Fellow, Center for Law, Energy & the Environment

    Ted Lamm

    Climate Law & Policy Fellow, Center for Law, Energy & the Environment

    CONTACT

    Center for Law, Energy & the Environment (CLEE)

    UC Berkeley School of Law

    390 Simon Hall

    Berkeley, CA 94720

    clee.berkeley.edu

    Natural Resource Governance Institute (NRGI)

    80 Broad Street, Suite 1801

    New York, NY 10004
    resourcegovernance.org

    DESIGN

    Layout Odd Moxie

    Template Studio Clear

    Cover Photo Francoise Gaujour (flickr @ gaujourfrancoise)

    Photography Licensed from Adobe Stock

    Building a Sustainable Electric Vehicle Battery Supply Chain: Frequently Asked Questions was
    funded through support from the ClimateWorks Foundation.

1                                                                         BUILDING A SUSTAINABLE ELECTRIC VEHICLE BATTERY SUPPLY CHAIN
                                       CENTER FOR LAW, ENERGY & THE ENVIRONMENT | NATURAL RESOURCE GOVERNANCE INSTITUTE
ABOUT CLEE
The Center for Law, Energy & the Environment (CLEE) channels the expertise and creativity
of the Berkeley Law community into pragmatic policy solutions to environmental and energy
challenges. We work with government, business, and the nonprofit sector to help solve urgent
problems that require innovative and often interdisciplinary approaches. Drawing on the com-
bined expertise of faculty, staff, and students across UC Berkeley, we strive to translate empir-
ical findings into smart public policy solutions that better our environmental and energy gov-
ernance systems.

ABOUT NRGI
The Natural Resource Governance Institute (NRGI) helps people to realize the benefits of
their countries’ endowments of oil, gas and minerals. We do this through technical advice, ad-
vocacy, applied research, policy analysis, and capacity development. We work with innovative
agents of change within government ministries, civil society, the media, legislatures, the private
sector, and international institutions to promote accountable and effective governance in the
extractive industries.

BUILDING A SUSTAINABLE ELECTRIC VEHICLE BATTERY SUPPLY CHAIN                                         2

CENTER FOR LAW, ENERGY & THE ENVIRONMENT | NATURAL RESOURCE GOVERNANCE INSTITUTE
INTRODUCTION
As governments and private actors across the world seek to reduce greenhouse gas emissions
from transportation (which exceed 15 percent of global emissions and over 40 percent of Cal-
ifornia emissions1 ), they are predominantly turning to battery electric vehicles (EVs) as a solu-
tion. When fueled by an increasingly renewable electrical grid, EVs offer the potential to signifi-
cantly reduce carbon emissions compared to internal combustion engine vehicles.

A global transition from fossil fuel-powered vehicles to EVs will require the production of hun-
dreds of millions of EV batteries, along with concerted efforts across policy, financing, and
technological development to support demand.2 Such a massive deployment raises concerns
about the availability of the minerals needed for these batteries, such as cobalt, lithium, and
nickel, and the potential impact of new demand for these minerals on the lives of people in the
mineral-producing countries. If managed effectively and in the public interest, the growth in
these minerals can boost national development in several developing and emerging econo-
mies. But realizing this potential comes with challenges, and mismanaged mineral supply chains
can exacerbate local environmental and governance difficulties, while potentially undermining
the EV market via supply shocks and consumer shifts away from EV brands.
In response, regulators and civil society organizations have launched efforts to increase the
sustainability and transparency of the EV battery supply chain. Stakeholders across industry
and government are seeking greater certainty around these efforts and what they can do to
support them.
To address these questions, UC Berkeley School of Law’s Center for Law, Energy & the Envi-
ronment (CLEE) and the Natural Resource Governance Institute (NRGI) are collaborating on
a stakeholder-led research initiative focusing on the key barriers to, and top opportunities for,
achieving greater sustainability in the EV battery supply chain.

CLEE and NRGI now offer this brief to educate decision makers and the general public about
the basic informational building blocks needed to understand sustainability in the context of
the EV battery supply chain. Specifically, this brief addresses the following questions (focusing
in some cases on cobalt and lithium as ‘case study’ examples to highlight key issues):
  •   What does the supply chain for EV batteries comprise?
  •   How do carbon emissions from EVs compare to traditional internal combustion engine
      (ICE) vehicles?
  •   What are the most significant challenges associated with managing the mineral ex-
      traction processes necessary for the EV supply chain, and what sustainability and human
      rights initiatives apply to these challenges?

Ultimately, this brief is a preview of a full report that CLEE and NRGI will produce to identify
key barriers and actionable, high-priority solutions for industry actors and government leaders
to ensure a sustainable EV battery supply chain. This brief is based on existing research resourc-
es and consultation with experts throughout the EV battery ecosystem, including automak-
ers, battery manufacturers, mining leaders, and international human rights and sustainability
organizations.3

BUILDING A SUSTAINABLE ELECTRIC VEHICLE BATTERY SUPPLY CHAIN                                          3

CENTER FOR LAW, ENERGY & THE ENVIRONMENT | NATURAL RESOURCE GOVERNANCE INSTITUTE
WHAT DOES THE EV BATTERY SUPPLY CHAIN LOOK LIKE?

                              COBALT                                            LITHIUM                            OTHER MINERALS
RAW MATERIAL

               Cobalt Mine              Cobalt Mine              Lithium Mine              Lithium Mine                  Nickel
                (Artisanal)              (Industrial)             (Hard Rock)                 (Salar)
                                                                                                                         Copper
                                                                                                                       Manganese
                                                                                                                       Rare Earths
                        Trader                                                                                          Graphite

                              Refiner              PRODUCTION                    Refiner                                 Refiner

                                                                  CATHODE                         CELL                         PACK
                                                                MANUFACTURER                  MANUFACTURER                 MANUFACTURER

                                                                                                        END USE

                                                                                                                     VEHICLE                          DISMANTLER /
                                                                                                                                           CONSUMER
                                                                                                                  MANUFACTURER                          RECYCLER

                                                                                                                          Refurbished modules
     = potential bottleneck due to
       limited number of players                                          Recycled precursor materials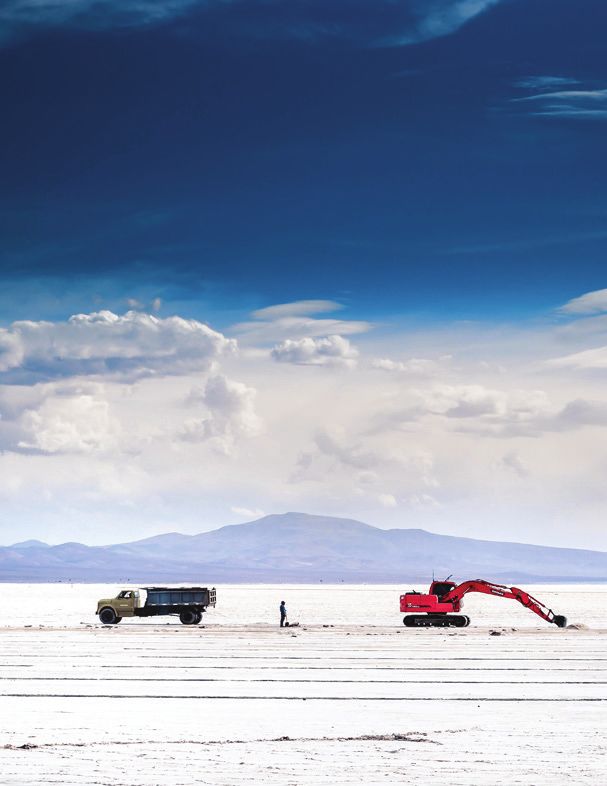
ARE EVs GREENER THAN GASOLINE VEHICLES?
       Since EVs do not rely directly on combustion of fossil fuels to operate, they hold a significant
       greenhouse gas emission advantage over traditional internal combustion engine vehicles. EV
       production and use is not entirely free of greenhouse gas impacts: extracting and processing
       minerals for batteries, producing the batteries, and generating electricity to charge them
       require energy inputs (often derived from fossil fuel sources) which emit greenhouse gases.

       Variations in fuel sources for electricity generation where EVs are charged and driven cause
       significant differences in greenhouse emissions, but studies have firmly established the
       overall emissions advantage of EVs. Overall, some estimates place EV life-cycle emissions
       at approximately 50 percent fewer greenhouse gases per kilometer traveled than internal
       combustion engines, ranging from 25-28 percent lower in jurisdictions in which electricity
       supplies are fossil fuel-reliant, up to 72-85 percent lower in areas with high renewable energy
       penetration.4 Others estimate an emissions benefit between 19 percent at the low end (for
       large vehicles in China) and 60 percent at the upper end (for small vehicles in Europe).5 In the
       US, the average EV may achieve the emissions equivalent of approximately 88 miles per gallon
       while operating, which is far better than the average internal combustion engine vehicle (with
       significant state-by-state variation depending on electricity mix).6 Overall, the lack of transit-
       related emissions, coupled with the potential to utilize and support renewable energy sources,
       gives EVs a significant emission advantage over internal combustion engine vehicles.

       Differences in battery materials and production techniques, including the location and energy
       mix of production, also affect the emissions profiles of different EVs.7 A battery produced in
       a jurisdiction using coal-fired electricity, for example, will have significantly higher emissions
       than one produced using cleaner power. The structure of the supply chain itself—how far
       battery materials are shipped from mines to refineries to manufacturing facilities—also adds
       to batteries’ life-cycle emissions, just as it does for petroleum. In total, analyses of battery
       production (including the extraction of component minerals) suggest that emissions from
       manufacturing an EV battery are roughly equivalent to the emissions from manufacturing the
       rest of the vehicle. Some experts have suggested that these emissions represent approximately
       5-15 percent of the total life-cycle emissions of an EV in many places, although these estimates
       can vary widely.8

       In addition, EV batteries’ potential use in smart charging and vehicle-to-grid applications, and
       the potential for second-life energy storage applications of used batteries, could play a key
       role in deep decarbonization of the electrical grid by enabling greater integration of renewable
       energy sources.9 Importantly, the potential greenhouse gas benefits of EV use will grow as firms
       develop new production technologies and as the overall electrical grid becomes less carbon-
       intensive.10 Some experts anticipate a 50 percent reduction in the life-cycle emissions of an
       average EV by 2030, and by one estimate of a fully renewable future grid, EVs could eventually
       produce at least 90 percent fewer life-cycle greenhouse gases than ICE vehicles.11 In terms of
       other harmful air pollutants, EVs are responsible for a fraction of the harmful pollutants such as
       nitrogen oxide and particulate matter that ICE vehicles emit.12

5                                     BUILDING A SUSTAINABLE ELECTRIC VEHICLE BATTERY SUPPLY CHAIN
    CENTER FOR LAW, ENERGY & THE ENVIRONMENT | NATURAL RESOURCE GOVERNANCE INSTITUTE
ARE THERE ENOUGH MINERALS TO BUILD ALL
THE BATTERIES THE WORLD NEEDS?
EV batteries require a number of mineral components to store and utilize electricity as fuel.
Some of these minerals, such as lithium, cobalt, nickel, graphite, copper, manganese, and
rare-earth elements like neodymium, are “critical” minerals for which substitutes are limited
or nonexistent and supplies are geographically concentrated.13 Expert opinions differ on
how likely a long-term shortage could be, particularly given changing battery technologies
and chemistries that may become less reliant on these raw materials. Some experts have
determined that long-term mineral supply shortages are unlikely to occur.14 For example,
the U.S. Geological Survey estimated global production of cobalt at 140,000 metric tons in
2018. This compares to global reserves (i.e. those that are economically feasible to extract)
of 6.9 million metric tons and terrestrial resources (i.e. known and reasonable for future
extraction) of 25 million tons.15 Worldwide lithium reserves are estimated at 14 million metric
tons, compared to 2018 production of 85,000 tons (and global resources of 62 million tons).16
On the other hand, analysis published in the scientific journal Nature shows that demand for
essential battery components could exceed supply within decades (by 2030 for cobalt and
2037 for nickel) without further developments in battery mineral composition17. And the World
Economic Forum has identified the potential for short-term supply crunches as the mining
industry strives to keep pace.18

Furthermore, the process of converting mineral reserves in the ground to extracted minerals
available for use in batteries involves complex legal, financial, and community factors.
Developing a mine requires extensive capital investment, regulation and oversight, and a system
for mitigating citizen concerns and managing stakeholder relationships in mining communities.
Therefore, governance of mining and supply chains will have a major impact on the stability with
which industry can bring in-ground resources to market.19

The pace of technological progress on materials recovery and recycling will also impact the
shape of future minerals demand. This innovation offers the possibility of extending and
diversifying supply chains. The automotive and battery industries are also investing to develop
new technologies that rely on more plentiful (and cheaper) minerals. Ultimately, while demand
for key minerals may grow exponentially with the market—by more than 300 percent for
graphite, more than 500 percent for cobalt, and more than 900 percent for lithium by 2050—
experts cannot project with certainty how technological change will impact supply chains. As
a result, the potential impact of mineral supply bottlenecks in the future remains unknown.21

BUILDING A SUSTAINABLE ELECTRIC VEHICLE BATTERY SUPPLY CHAIN                                       6

CENTER FOR LAW, ENERGY & THE ENVIRONMENT | NATURAL RESOURCE GOVERNANCE INSTITUTE
WHERE DO KEY BATTERY MINERAL INPUTS COME FROM?
COBALT: RESERVES BY COUNTRY, 2018 COBALT: PRODUCTION BY COUNTRY, 2018
RESERVES GLOBAL PRODUCTION GLOBAL
RANK COUNTRY RANK COUNTRY
(TONNES) SHARE (TONNES) SHARE
1 Dem. Rep. Congo 3,400,000 49% 1 Dem. Rep. Congo 94,445 68%
2 Australia 1,200,000 17% 2 Australia 5,492 4%
3 Cuba 500,000 7% 3 Russia 5,334 4%
4 Philippines 280,000 4% 4 Philippines 4,600 3%
5 Zambia 270,000 4% 5 Canada 4,136 3%
=6 Canada 250,000 4% 6 Cuba 3,846 3%
=6 Russia 250,000 4% 7 Papua New Guinea 3,275 2%
8 Madagascar 140,000 2% 8 Zambia 3,008 2%
9 China 80,000 1% 9 Madagascar 2,850 2%
10 Brazil 73,500 1% 10 New Caledonia 2,404 2%
Data Source: US Geoglogical Survey Cobalt Mineral Commodity Summary 2020. Data Source: S&P Metal and Mining Database*
COBALT: RESERVES BY COMPANY, 2018 COBALT: PRODUCTION BY COMPANY, 2018
RESERVES GLOBAL PRODUCTION GLOBAL
RANK COMPANY RANK COMPANY
(TONNES) SHARE (TONNES) SHARE
1 Glencore Plc 716,500 10% 1 Glencore Plc 35,444 26%
2 Katanga Mining Limited 510,000 7% 2 China Molybdenum Co. Ltd. 10,498 8%
3 China Molybdenum Co., Ltd. 468,800 7% 3 Gécamines SA 8,345 6%
4 Gécamines SA 343,590 5% 4 Katanga Mining Ltd. 8,334 6%
5 Cubaniquel 341,000 5% 5 Shalina Resources Ltd 6,650 5%
6 Vale S.A. 189,095 3% 6 PJSC MMC Norilsk Nickel 5,694 4%
7 Jinchuan Group Co., Ltd. 161,000 2% 7 Vale S.A. 4,619 3%
8 Jinchuan Group International Resources Co. Ltd 146,630 2% 8 BHR Newwood Invt Mgmt Ltd 4,499 3%
9 Metals X Limited 122,622 2% 9 Jinchuan Grp Intl Rsrc Co. Ltd 3,758 3%
10 Element ASA 80,340 1% 10 Nickel Asia Corp. 2,915 2%
Data Source: S&P Metal and Mining Database; U.S. Geological Survey Cobalt Mineral Commodity Summary 2020. Data Source: S&P Metal and Mining Database*
COBALT: RESERVES BY PROJECT, 2018
RESERVES GLOBAL
RANK PROJECT LEAD COMPANY COUNTRY
(TONNES) SHARE
1 Kamoto Katanga Mining Limited Dem. Rep. Congo 680,000 10%
2 Mutanda Glencore Plc Dem. Rep. Congo 619,000 9%
3 Tenke Fungurume China Molybdenum Co., Ltd. Dem. Rep. Congo 586,000 8%
4 Punta Gorda Cubaniquel Cuba 341,000 5%
5 Cameroon East - Cameroon 177,000 3%
6 Musonoi Jinchuan Group International Resources Co. Ltd Dem. Rep. Congo 165,000 2%
7 Jinchuan Jinchuan Group Co., Ltd. China 161,000 2%
8 Goro Vale S.A. New Caledonia 140,100 2%
9 Clean TeQ Sunrise Clean TeQ Holdings Limited Australia 132,000 2%
10 Las Camariocas/Cupey Government of Cuba Cuba 123,000 2%
Data Source: S&P Metal and Mining Database; U.S. Geological Survey Cobalt Mineral Commodity Summary 2020.
COBALT: PRODUCTION BY PROJECT, 2018
PRODUCTION GLOBAL
RANK PROJECT LEAD COMPANY COUNTRY
(TONNES) SHARE
1 Kamoto Katanga Mining Limited Dem. Rep. Congo 680,000 10%
2 Mutanda Glencore Plc Dem. Rep. Congo 619,000 9%
3 Tenke Fungurume China Molybdenum Co., Ltd. Dem. Rep. Congo 586,000 8%
4 Punta Gorda Cubaniquel Cuba 341,000 5%
5 Cameroon East - Cameroon 177,000 3%
6 Musonoi Jinchuan Group International Resources Co. Ltd Dem. Rep. Congo 165,000 2%
7 Jinchuan Jinchuan Group Co., Ltd. China 161,000 2%
8 Goro Vale S.A. New Caledonia 140,100 2%
9 Clean TeQ Sunrise Clean TeQ Holdings Limited Australia 132,000 2%
7 10 Las Camariocas/Cupey Government of Cuba Cuba 123,000 2%
Data Source: S&P Metal and Mining Database
*S&P Global Market Intelligence is a division of S&P Global. “Market Intelligence Metals & Mining” accessed through S&P Global portal, https://platform.marketintelligence.spglobal.com/.
LITHIUM: RESERVES BY COUNTRY, 2018 LITHIUM: PRODUCTION BY COUNTRY, 2018
RESERVES (ICE* GLOBAL PRODUCTION GLOBAL
RANK COUNTRY RANK COUNTRY
TONNES) SHARE (ICE* TONNES) SHARE
1 Chile 45,777,800 30% 1 Australia 292 60%
2 Bolivia 39,000,000 26% 2 Chile 97 20%
3 Australia 14,904,400 10% 3 Argentina 37 8%
4 Argentina 9,049,100 6% 4 China 35 7%
5 China 5,323,000 3% 5 Brazil 9 2%
6 USA 3,353,490 2% 6 Zimbabwe 6 1%
7 Canada 1,969,510 1% 7 USA 6 1%
8 Zimbabwe 1,224,290 1% 8 Namibia 3 1%
9 Brazil 505,685 0% 9 Portugal 1 0%
10 Portugal 319,380 0% 10 Canada 1 0%
Data Source: US Geological Survey Lithium Mineral Commodity Summary 2020; S&P Metal and Mining Database. Data Source: S&P Metal and Mining Database
LITHIUM: RESERVES BY COMPANY, 2018 LITHIUM: PRODUCTION BY COMPANY, 2018
RESERVES (ICE* GLOBAL PRODUCTION GLOBAL
RANK COMPANY RANK COMPANY
TONNES) SHARE (ICE* TONNES) SHARE
1 Corporacion Minera de Bolivia 39,000,000 34% 1 Albemarle Corp. 1531.91 20%
2 Lithium Americas Corp. 1,939,525 2% 2 Mineral Resources Ltd. 1,483 19%
3 Pilbara Minerals Limited 1,326,000 1% 3 Chengdu Tianqi Industry Grp Co 876 11%
4 Ganfeng Lithium Co., Ltd. 1,082,925 1% 4 Sociedad Quimica y Minera 799 10%
5 Bacanora Lithium Plc 1,068,400 1% 5 Ganfeng Lithium Co. Ltd. 381 5%
6 Chengdu Tianqi Industry Group Co., Ltd. 878,220 1% 6 Galaxy Resources Ltd. 354 5%
7 Mineral Resources Limited 712,000 1% 7 FMC Corp. 343 4%
8 Liontown Resources Limited 603,600 1% 8 Pilbara Minerals Ltd. 334 4%
9 Galaxy Resources Limited 584,150 1% 9 Yichun Tantalum Co Ltd 179 2%
10 Cadence Minerals Plc 547,200 0% 10 Qinghai Salt Lake Industry Co. 157 2%
Data Source: US Geological Survey Lithium Mineral Commodity Summary 2020; S&P Metal and Mining Database. Data Source: S&P Metal and Mining Database
LITHIUM: RESERVES BY PROJECT, 2018
RESERVES GLOBAL
RANK PROJECT LEAD COMPANY COUNTRY
(TONNES) SHARE
1 Uyuni Salt Flat Corporacion Minera de Bolivia Bolivia 39,000,000 34%
2 Salar de Atacama Sociedad Quimica y Minera de Chile S.A. Chile 18,000,000 16%
3 Chaerhan Lake Qinghai Salt Lake Industry Co.,Ltd China 5,600,000 5%
4 Sonora Bacanora Lithium Plc Mexico 1,824,000 2%
5 Salar del Hombre Muerto Livent Corporation Argentina 1,800,000 2%
6 Wodgina Albemarle Corporation Australia 1,780,000 2%
7 Greenbushes Chengdu Tianqi Industry Group Co., Ltd. Australia 1,722,000 2%
8 Cauchari-Olaroz Lithium Americas Corp. Argentina 1,470,000 1%
9 Mt Holland - Lithium Wesfarmers Limited Australia 1,413,000 1%
10 Pilgangoora Pilbara Minerals Limited Australia 1,326,000 1%
Data Source: US Geological Survey Lithium Mineral Commodity Summary 2020; S&P Metal and Mining Database.
LITHIUM: PRODUCTION BY PROJECT, 2018
RESERVES GLOBAL
RANK PROJECT LEAD COMPANY COUNTRY
(TONNES) SHARE
1 Greenbushes Chengdu Tianqi Industry Grp Co, Albemarle Corp. Australia 108,316 22%
2 Wodgina Albemarle Corp., Mineral Resources Ltd. Australia 69,499 14%
3 Mount Marion Mineral Resources Ltd., Ganfeng Lithium Co. Ltd. Australia 55,693 11%
4 Salar de Atacama Sociedad Quimica y Minera Chile 50,400 10%
5 Salar de Atacama Albemarle Corp. Chile 37,681 8%
6 Mt Cattlin Galaxy Resources Ltd. Australia 22,319 5%
7 Salar del Hombre Muerto Livent Corp. Argentina 21,597 4%
8 Pilgangoora Pilbara Minerals Ltd. Australia 21,044 4%
9 Salar de Olaroz Orocobre Ltd., Toyota Tsusho Corp., Jujuy Energia y Mineria Argentina 12,413 3%
10 Yichun Yichun Tantalum Co Ltd China 11,293 2%
8
Data Source: S&P Metal and Mining Database
*lce = lithium carbonate equivalent
HOW DOES EV BATTERY PRODUCTION IMPACT
HUMAN RIGHTS, LOCAL GOVERNANCE, AND
ECONOMIC DEVELOPMENT IN MINERAL-
PRODUCING COUNTRIES?
The growth in demand for the mineral components of EV batteries has the potential to boost
public revenues and economic development in countries that are home to these mineral
resources, and governments in mineral-rich countries are assessing opportunities to take
advantage of a potential boom. Mineral extraction has also been associated with human rights
and governance challenges, however, and mining of EV battery materials is no exception.
In recent years, mining operations around the world have been linked to human rights
impacts such as long-term health risks and dangerous conditions for workers, child labor and
underpayment, forced evictions, police detentions and armed conflict.22 These problems do
not permeate all mining projects, of course, and the global mining industry has taken steps in
recent years to enhance its approach to health, safety, security and community relations.23
These acute human rights impacts link in many cases to a deeper set of governance challenges
that have allowed corruption to persist and made it difficult for many citizens in resource-
rich countries to access the economic opportunities associated with the mining sector. Many
mineral-rich developing countries lack adequate policy frameworks, accountability processes,
and government capacity to enforce strong protections for citizens and manage the sector in
the public interest.24
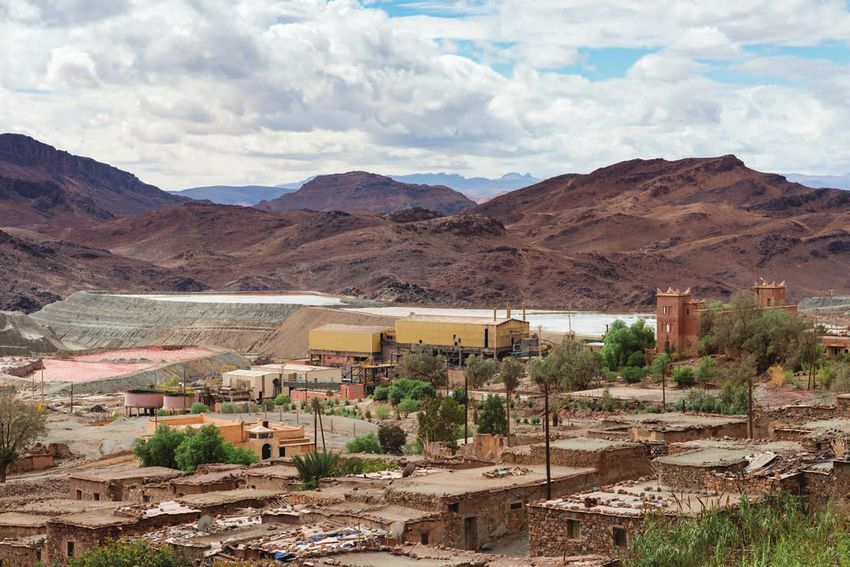
Certain risks are particularly connected with mining for minerals used in EV batteries.
Specifically, the heavy concentration of global cobalt reserves in the Democratic Republic
of Congo (DRC, where more than half of global cobalt production originates) has dramatic
impacts on the human rights risks associated with the battery supply chain due to significant
governance challenges in the country. Unregulated artisanal cobalt mining (i.e., small-scale
mining performed by groups of individuals using hand tools) in the DRC is linked to regular
risk of injury and death due to mine collapses, lung disease from particle inhalation, and
child labor concerns, with weak enforcement of health and safety standards or child labor
rules.25 International observers and NGOs have reported that state agents belonging to
Congolese state entities have been involved in corrupt practices and failed to enforce child
labor requirements, and they have linked public officials to rogue elements of security forces
that control artisanal mine sites and trading centers.26 However, a small number of more
formal artisanal mine sites are making notable progress in improving conditions. Meanwhile,
numerous NGOs and journalists covering industrial mining of cobalt have identified large-scale
public corruption wherein public officials have steered financial benefits from the Congolese
population into the hands of privileged elites. One type of scheme involves the granting of
stakes in mineral licenses at below-market value to well-connected intermediaries, who
then sell them for a profit and distribute kickbacks to top officials. This practice has sparked
investigations of major mining companies from the U.S., Canadian and British governments.27
Concerns regarding the lithium sector are not as widely reported as for cobalt. Overall,
the quality of mining sector governance varies widely among countries with large known
lithium reserves. The 2017 Resource Governance Index, which measures transparency and
accountability in public management of the sector, assessed several countries with reserves
that rank among the world’s largest. Among the findings, researchers concluded that Chile
(second in global reserves) exhibited “good” overall performance, and Australia (third-largest)
9 BUILDING A SUSTAINABLE ELECTRIC VEHICLE BATTERY SUPPLY CHAIN
CENTER FOR LAW, ENERGY & THE ENVIRONMENT | NATURAL RESOURCE GOVERNANCE INSTITUTEand Mexico (sixth-largest) exhibited “satisfactory” governance. However, in some cases indigenous residents of lithium mining areas have protested mining operations over inequality and lack of consent in siting operations.28 Natural resource governance in Bolivia—which is not currently producing commercial lithium, but hosts some of the world’s largest reserves and may be a significant future source—could pose significant challenges; the Resource Governance Index did not assess the Bolivian mining sector, but Bolivia has experienced significant political turmoil and analysts have raised concerns about the governance and viability of mineral projects in the country.29 The sustainability of the EV industry requires that industry actors, governments, researchers and civil society address the human rights and governance challenges associated with the extraction of battery minerals, while looking for win-win solutions that bolster global supply and promote development within the producer countries. This brief discusses below several initiatives that tackle these challenges. In considering the net impact of a transition from fossil fuels to electric vehicles, however, it is important to note that fossil fuel exploration and extraction has also been associated with some of the most severe problems of human rights abuse, conflict and corruption in the world.30 The average scores on the Resource Governance Index for oil-producing countries (47 out of 100) and mineral-producing countries (48 out of 100) are virtually identical, signaling that mis-governance remains a challenge in both sectors. A recent Organization for Economic Co-operation and Development (OECD) survey of officials from state-owned enterprises identified mining as the industry with the second-highest incidence of corruption, with 50 percent of respondents saying they had observed corrupt acts. The sector with the highest incidence of corruption was oil and gas, at 63 percent.31 BUILDING A SUSTAINABLE ELECTRIC VEHICLE BATTERY SUPPLY CHAIN 10 CENTER FOR LAW, ENERGY & THE ENVIRONMENT | NATURAL RESOURCE GOVERNANCE INSTITUTE
HOW DOES EV BATTERY PRODUCTION IMPACT
THE LOCAL ENVIRONMENT IN PRODUCING
REGIONS?
Local (i.e. non-greenhouse gas) environmental risks to air, water, and ecosystems are an
unavoidable result of mineral extraction operations. Extraction of mineral resources used in
industries from electronics and basic consumer items to jewelry and heavy industry has long
impacted the health of local residents, disrupted natural environments, and used significant
energy and water resources.32 Both EV battery component minerals and fossil fuels are part of
this story.
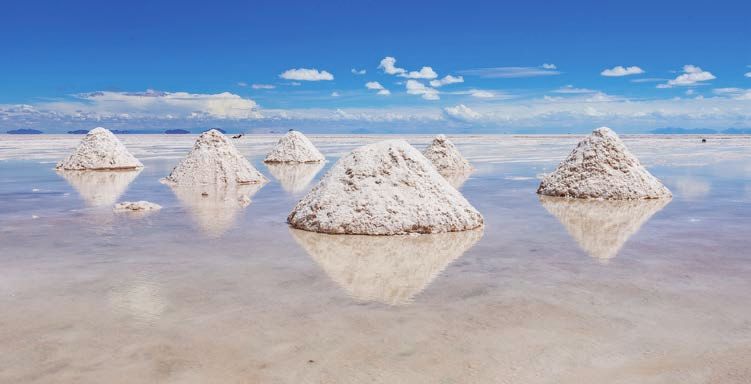
For example, salar-based lithium extraction, which takes place primarily in the “lithium triangle”
(covering the Andean regions of Chile, Argentina, and Bolivia, which as noted earlier is not
currently producing large quantities) uses and discharges significant quantities of water,
which can negatively affect neighboring farms and communities by diminishing and polluting
supplies.33 Cobalt mining in Congo can cause water pollution, air quality impacts, and possible
radioactive exposure, affecting both miners and surrounding communities.34 Nickel mining
operations around the world have been responsible for toxic air pollution and other harms.35
At the same time, the mining industry has invested significant resources to address the
environmental footprint of mining operations, and many mining companies work closely with
public officials and communities to try to manage the local impacts of extraction.36
Oil and gas extraction, meanwhile, has triggered some of the most well-known environmental
disasters in history. In the United States, events like the 1969 Santa Barbara oil spill, the 1989
Exxon Valdez spill, and the 2010 Deepwater Horizon explosion have had significant policy
and social impacts. These offshore oil drilling- and transportation-related spills can destroy
marine species and habitats and damage coastal economies. And even in areas with strong
environmental regulations like California, onshore oil and gas production is associated with
reduced air quality, groundwater contamination, habitat disruption, and human health risks
including asthma and cancers.37 (Onshore spill events are typically lower-profile and less
disastrous than offshore events, but hundred thousand-gallon spills still occur with some
regularity.)38
Given the wide range of mining techniques, host countries, and regulatory regimes applicable
to the extraction of oil and hard minerals, analysts face challenges comparing the direct
local environmental impacts. But as consumers and vehicle manufacturers shift toward more
sustainable transportation options, identifying and addressing these impacts—through both
regulation and voluntary action—will become increasingly important, regardless of vehicle type.
11 BUILDING A SUSTAINABLE ELECTRIC VEHICLE BATTERY SUPPLY CHAIN
CENTER FOR LAW, ENERGY & THE ENVIRONMENT | NATURAL RESOURCE GOVERNANCE INSTITUTEARE COMPANIES AND GOVERNMENTS IN THE EV
BATTERY MATERIALS SUPPLY CHAIN MANAGING
SUSTAINABILITY RISKS?
As governments, companies, and civil society organizations increase their awareness of
sustainability challenges throughout the minerals supply chain—including but not limited to
the EV battery materials supply chain—they have begun to develop a number of initiatives and
regulatory regimes to address key sustainability risks. These requirements overlap substantively
in many cases, with measures relating to human rights and labor, corruption and payments
to government, environmental harms, and more. However, they vary in the entities to which
they pertain and that are responsible for application, as well as the minerals they cover and
the mechanisms for compliance. The result is a patchwork of standards that creates a strong
template for comprehensive supply chain management but may not invite straightforward
compliance. Key standards and initiatives include, but are not limited to:
• The OECD Due Diligence Guidance for Responsible Supply Chains of Minerals from
Conflict-Affected and High-Risk Areas;
• The Extractive Industries Transparency Initiative;
• The Voluntary Principles on Security and Human Rights;
• The Responsible Minerals Initiative’s Responsible Minerals Assurance Process;
• The Initiative for Responsible Mining Assurance’s Standard for Responsible Mining;
• The Cobalt Institute’s Cobalt Industry Responsible Assessment Framework;
• The London Metal Exchange’s Responsible Sourcing Requirements;
• The International Council on Mining and Metals’ Mining Principles; and
• The World Economic Forum’s Global Battery Alliance.
Key legal regimes and regulations include, but are not limited to:
• Section 1502 of the Dodd-Frank Wall Street Reform and Consumer Protection
Act of 2010;
• The EU Conflict Minerals Regulation;
• The DRC Mining Ministry Circular of September 2011;
• The French Devoir de Vigilance;
• The U.S. Foreign Corrupt Practices Act;
• The UK Bribery Act 2010;
• The French Sapin II Law;
• The U.S. Global Magnitsky Act;
• The UK Modern Slavery Act 2015;
• The Canadian Corruption of Foreign Public Officials Act of 1998; and
• The Dutch Child Labor Due Diligence Act.
A structured map or taxonomy defining and classifying these standards would offer actors
throughout the supply chain a streamlined method to determine their most feasible pathway
for comprehensive compliance.
BUILDING A SUSTAINABLE ELECTRIC VEHICLE BATTERY SUPPLY CHAIN 12
CENTER FOR LAW, ENERGY & THE ENVIRONMENT | NATURAL RESOURCE GOVERNANCE INSTITUTECONCLUSION:
EV BATTERY SUPPLY CHAIN SUSTAINABILITY
CHALLENGES AND FURTHER NEEDS
As governments, businesses, and consumers move to increase adoption of EVs, questions
around the sustainability of the supply chain will grow. The resources and information in this
brief may help highlight key areas in need of industry and policy action to increase sustainability.
They may also address some of the biggest challenges of supply chain management and
answer some of the most common questions about EVs in relation to their fossil fuel-powered
alternatives. CLEE and NRGI’s research initiative will offer additional recommendations in a
forthcoming report, building on the facts contained in this brief.
13 BUILDING A SUSTAINABLE ELECTRIC VEHICLE BATTERY SUPPLY CHAIN
CENTER FOR LAW, ENERGY & THE ENVIRONMENT | NATURAL RESOURCE GOVERNANCE INSTITUTEREFERENCES
1. See World Resources Institute, “World Greenhouse Gas “Effects of Battery Manufacturing on Electric Vehicle Life-
Emissions: 2016,” available at https://www.wri.org/resources/ Cycle Greenhouse Gas Emissions.” The relative emissions
data-visualizations/world-greenhouse-gas-emissions-2016; footprint attributable to battery production varies depending
California Air Resources Board, California Greenhouse Gas on both the location of battery production (determining the
Emissions for 2000-2017, available at https://ww3.arb.ca.gov/ battery-specific emissions “numerator”) and the location
cc/inventory/pubs/reports/2000_2017/ghg_inventory_ of vehicle use (the life-cycle “denominator”). Thus, for an
trends_00-17.pdf. EV driven in an average US jurisdiction, the battery could
represent 5-15 percent of life-cycle emissions, while for an EV
2. See World Economic Forum (WEF) and Global Battery
driven in a country like Norway—with an extremely high level
Alliance (GBA), A Vision for a Sustainable Battery Value Chain
of carbon-free electricity—it could be closer to 50 percent,
in 2030 (September 2019), available at http://www3.weforum.
since emissions attributable to vehicle use would be far lower.
org/docs/WEF_A_Vision_for_a_Sustainable_Battery_Value_
In both cases, however, the life-cycle emissions of the EV
Chain_in_2030_Report.pdf.
appear to be lower than those of a comparable ICE vehicle.
3. For a short description of the convening that served as one
9. See, e.g., Hanjiro Ambrose et al., “Driving rural
of the major inputs into this document, see Westenberg et
energy access: a second-life application for electric-
al., “Electric Vehicle Supply Chain Presents Opportunities
vehicle batteries,” Environmental Research Letters 9,
and Risks for Mineral Producers” (December 2019), available
094004 (2014), available at https://iopscience.iop.org/
at https://resourcegovernance.org/blog/electric-vehicle-
article/10.1088/1748-9326/9/9/094004/pdf.
supply-chain-opportunities-risks-mineral-producers.
10. WEF and GBA, A Vision for a Sustainable Battery Value Chain
4. International Council on Clean Transportation (ICCT), “Effects
in 2030, pp. 27-28.
of Battery Manufacturing on Electric Vehicle Life-Cycle
Greenhouse Gas Emissions” (February 2018), available at 11. Id.; Auke Hoekstra, “The Underestimated Potential of Battery
https://theicct.org/sites/default/files/publications/EV-life- Electric Vehicles to Reduce Emissions,” Joule 4, 1404 (June
cycle-GHG_ICCT-Briefing_09022018_vF.pdf; Transport & 2019), available at https://www.sciencedirect.com/science/
Environment (T&E), “Life Cycle Analysis of the Climate Impact article/pii/S2542435119302715.
of Electric Vehicles” (October 2017), available at https://www.
12. See, e.g., S.L. Winkler et al., “Vehicle criteria pollutant (PM,
transportenvironment.org/sites/te/files/publications/TE%20
NOx, CO, HCs) emissions: how low should we go?” npj Climate
-%20draft%20report%20v04.pdf; Union of Concerned
and Atmospheric Science 1, 26 (2018), available at https://
Scientists (UCS), Cleaner Cars from Cradle to Grave
www.nature.com/articles/s41612-018-0037-5.
(November 2015), available at https://www.ucsusa.org/sites/
default/files/attach/2015/11/Cleaner-Cars-from-Cradle-to- 13. See Indra Overland, “The geopolitics of renewable
Grave-full-report.pdf. energy: Debunking four emerging myths,” Energy
Research & Social Science 49 (2019), 36-40, available
5. WEF and GBA, A Vision for a Sustainable Battery Value Chain
at https://www.sciencedirect.com/science/article/pii/
in 2030, p. 20.
S2214629618308636; Benjamin K. Sovacool et al.,
6. UCS, “Are Electric Vehicles Really Better for the Climate? “Sustainable minerals and metals for a low-carbon future,”
Yes. Here’s Why.” (February 11, 2020), available at https:// Science Vol. 367, Issue 6473 (Jan. 3 2020), 30-33, available
blog.ucsusa.org/dave-reichmuth/are-electric-vehicles-really- at https://science.sciencemag.org/content/sci/367/6473/30.
better-for-the-climate-yes-heres-why. full.pdf.
7. Qiang Dai et al., “Life Cycle Analysis of Lithium-Ion Batteries 14. T&E, “Electric vehicle life cycle analysis and raw
for Automotive Applications,” Batteries 2019, 5, 48, available material availability” (Oct. 2017), available at https://
at https://www.mdpi.com/2313-0105/5/2/48/htm; T&E, “Life www.transportenvironment.org/sites/te/files/
Cycle Analysis of the Climate Impact of Electric Vehicles”; publications/2017_10_EV_LCA_briefing_final.pdf.
ICCT, “Effects of Battery Manufacturing on Electric Vehicle
15. United States Geological Survey (USGS), Mineral Commodity
Life-Cycle Greenhouse Gas Emissions”; UCS, Cleaner Cars
Summaries 2019, pp. 50-51, available at https://www.usgs.gov/
from Cradle to Grave.
centers/nmic/mineral-commodity-summaries,
8. Hanjiro Ambrose and Alissa Kendall, “Effects of battery
16. Id. at 98-99.
chemistry and performance on the life cycle greenhouse gas
intensity of electric mobility,” Transportation Research Part 17. See Kostiantyn Turcheniuk et al., “Ten years left to redesign
D 47, 182-194 (2016), available at https://www.sciencedirect. lithium-ion batteries,” Nature (July 25, 2018), available at
com/science/article/pii/S1361920915300390; ICCT, https://www.nature.com/articles/d41586-018-05752-3/.
BUILDING A SUSTAINABLE ELECTRIC VEHICLE BATTERY SUPPLY CHAIN 14
CENTER FOR LAW, ENERGY & THE ENVIRONMENT | NATURAL RESOURCE GOVERNANCE INSTITUTE18. WEF and GBA, A Vision for a Sustainable Battery Value Chain 25. See Amnesty International, This Is What We Die For (2016),
in 2030, p. 29; see Stella Soon, “As electric vehicle production pp. 22-24, available at https://www.amnesty.org/download/
ramps up worldwide, a supply crunch for battery materials is Documents/AFR6231832016ENGLISH.PDF.
looming,” CNBC (July 26, 2019), available at https://www.cnbc.
26. Enough Project, Powering Down Corruption (October 2018),
com/2019/07/26/electric-car-production-rises-supply-
p. 19, available at https://enoughproject.org/wp-content/
crunch-for-battery-metals-looms.html.
uploads/PoweringDownCorruption_Enough_Oct2018-web.
19. Several international initiatives are being developed to pdf; Amnesty International, This Is What We Die For, pp. 34-35;
target governance considerations and reduce potential Organization for Economic Co-operation and Development
supply bottlenecks that could impede the global energy (OECD), Interconnected supply chains: a comprehensive look
transition. See, e.g., U.S. Department of State Bureau of at due diligence challenges and opportunities sourcing cobalt
Energy Resources, Energy Resource Governance Initiative, and copper from the Democratic Republic of the Congo,
2019, https://www.state.gov/wp-content/uploads/2019/06/ available at https://mneguidelines.oecd.org/interconnected-
Energy-Resource-Governance-Initiative-ERGI-Fact-Sheet. supply-chains-a-comprehensive-look-at-due-diligence-
pdf. challenges-and-opportunities-sourcing-cobalt-and-copper-
from-the-drc.htm.
20. See, e.g., Turcheniuk et al.
27. Resource Matters, See No Evil -- Poorly Managed Corruption
21. Benjamin K Sovacool et al.; T&E, “Electric vehicle life cycle
Risks in the Cobalt Supply Chain (2019), available at https://
analysis and raw material availability”; see Gavin Harper et
resourcematters.org/see-evil-speak-evil-poorly-managed-
al., “Recycling lithium-ion batteries from electric vehicles,”
corruption-risks-cobalt-supply-chain; Kadhim Shubber and
Nature 575(7781), 75-86 (November 2019), available at
Neil Hume, “Glencore under investigation by US commodities
https://www.nature.com/articles/s41586-019-1682-5.pdf;
regulator,” Financial Times (Apr. 25, 2019), available at
WEF and GBA, A Vision for a Sustainable Battery Value Chain
https://www.ft.com/content/f73b3906-6781-11e9-9adc-
in 2030, p. 30-31.
98bf1d35a056; Julia Kollewe and Simon Goodley, “Serious
22. See, e.g., Amnesty International, Profits and Loss: Mining Fraud Office investigates Glencore over suspected bribery,”
and Human Rights in Katanga, Democratic Republic of The Guardian (Dec. 5, 2019), available at https://www.
the Congo (2013), available at https://www.amnesty.org/ theguardian.com/business/2019/dec/05/serious-fraud-
download/Documents/12000/afr620012013en.pdf; office-investigates-glencore-over-suspected-bribery.
Amnesty International, Mining in Guatemala: Rights at Risk
28. See, e.g., Eniko Horvath and Amanda Romero Medina,
(2014), available at https://www.amnesty.org/download/
“Indigenous people’s’ livelihoods at risk in scramble for lithium,
Documents/4000/amr340022014en.pdf; Human Rights
the new white gold,” Ethical Corporation (April 9, 2019),
Watch, “What...if Something Went Wrong?”: Hazardous Child
available at http://www.ethicalcorp.com/indigenous-peoples-
Labor in Small-Scale Gold Mining in the Philippines (2015),
livelihoods-risk-scramble-lithium-new-white-gold.
available at https://www.hrw.org/report/2015/09/29/
what-if-something-went-wrong/hazardous-child-labor- 29. See, e.g., Laura Millan Lombrana, “Bolivia’s almost impossible
small-scale-gold-mining; Human Rights Watch, “No lithium dream,” Blomberg (December 3, 2019), available at
Year without Deaths”: A Decade of Deregulation Puts https://www.bloomberg.com/news/features/2018-12-03/
Georgian Miners at Risk (2019), available at https://www. bolivia-s-almost-impossible-lithium-dream.
hrw.org/report/2019/08/22/no-year-without-deaths/
30. For a recent survey of some of the most severe governance
decade-deregulation-puts-georgian-miners-risk.
challenges associated with oil extraction, see Alexandra Gillies,
23. As examples of the mineral industry’s evolving approach to Crude Intentions: How Oil Corruption Contaminates the
human rights and other impacts, The International Council World (2020).
provides several guidance documents for mining companies:
31. OECD, State-owned enterprises and corruption: What are the
on such topics as Understanding Company-Community
risks and what can be done? (2018), p 28, available at https://
Relations, Voluntary Principles on Security and Human Rights:
www.oecd-ilibrary.org/governance/state-owned-enterprises-
Implementation Guidance Tools, Good Practice Guide on
and-corruption_9789264303058-en.
Indigenous Peoples and Mining, and Demonstrating Value:
A Guide to Responsible Sourcing. See https://guidance. 32. See. e.g., USGS, Environmental Considerations Related
miningwithprinciples.com/ for these and other documents. to Mining of Nonfuel Minerals (2017), available at https://
pubs.usgs.gov/pp/1802/b/pp1802b.pdf; Earthworks and
24. For an overview of major governance challenges associated
Oxfam America, Dirty Metals: Mining, Communities and
with extractive industries, see Natural Resource Governance
the Environment (2004), available at https://earthworks.
Institute, Natural Resource Charter (2014), available at https://
org/cms/assets/uploads/archive/files/publications/
resourcegovernance.org/approach/natural-resource-charter.
NDG_DirtyMetalsReport_HR.pdf.
15 BUILDING A SUSTAINABLE ELECTRIC VEHICLE BATTERY SUPPLY CHAIN
CENTER FOR LAW, ENERGY & THE ENVIRONMENT | NATURAL RESOURCE GOVERNANCE INSTITUTE33. See, e.g., Datu Buyung Agusdinata et al., “Socio-environmental
impacts of lithium mineral extraction: towards a research
agenda,” Environmental Research Letters 13(2018), available at
https://doi.org/10.1088/1748-9326/aae9b1; Amit Katwala,
“The spiralling environmental cost of our lithium battery
addiction,” Wired (August 5, 2018), available at https://www.
wired.co.uk/article/lithium-batteries-environment-impact.
34. See, e.g., Lena Mucha et al., “The hidden costs of cobalt mining,”
Washington Post (February 28, 2018), available at https://
www.washingtonpost.com/news/in-sight/wp/2018/02/28/
the-cost-of-cobalt/.
35. See Max Opray, “Nickel Mining: the hidden environmental cost
of electric cars,” The Guardian (August 24, 2017), available at
https://www.theguardian.com/sustainable-business/2017/
aug/24/nickel-mining-hidden-environmental-cost-electric-
cars-batteries.
36. For examples of some initiatives that aim to promote
innovative and responsible environmental management of
mining projects, see the International Council on Mining
& Metals’ Water Stewardship Framework (2014), available
at https://www.icmm.com/website/publications/pdfs/
water/2014_water-stewardship-framework.pdf; Metals
Environmental Risk Assessment Guidance (2016), available at
https://www.icmm.com/website/publications/pdfs/chemicals-
management/merag/merag-overview-2016.pdf; and Good
Practice Guide for Mining and Biodiversity, available at
https://guidance.miningwithprinciples.com/good-practice-
guide-mining-biodiversity/. The Intergovernmental Forum
on Mining, Minerals, Metals and Sustainable Development
provides guidance for governments seeking to enhance their
procedures for mitigating environmental impacts of mineral
projects, see, e.g., Guidance For Governments: Improving
Frameworks for Environmental and Social Impact Assessment
and Management – Consultation Draft (September
2019), available at https://www.iisd.org/sites/default/files/
publications/igf-guidance-for-governments-esia-en.pdf.
37. See, e.g., California Council on Science and Technology (CCST),
An Independent Scientific Assessment of Well Stimulation in
California, Vol. II (July 2015), available at https://ccst.us/wp-
content/uploads/160708-sb4-vol-II.pdf; Los Angeles County
Department of Public Health (LACDPH), Public Health and
Safety Risks of Oil and Gas Facilities in Los Angeles County
(February 2018), available at http://publichealth.lacounty.gov/
eh/docs/PH_OilGasFacilitiesPHSafetyRisks.pdf.
38. See, e.g., Los Angeles Times, “Chevron spills 800,000 gallons
of oil and water in Kern County canyon” (July 12, 2019),
available at https://www.latimes.com/local/lanow/la-me-
california-oil-spill-20190712-story.html.
BUILDING A SUSTAINABLE ELECTRIC VEHICLE BATTERY SUPPLY CHAIN 16
CENTER FOR LAW, ENERGY & THE ENVIRONMENT | NATURAL RESOURCE GOVERNANCE INSTITUTEYou can also read