N-Nitrosodimethylamine Contamination in the Metformin Finished Products - MDPI
←
→
Page content transcription
If your browser does not render page correctly, please read the page content below
molecules
Article
N-Nitrosodimethylamine Contamination in the
Metformin Finished Products
Adam Zmysłowski * , Iza Ksiażek
                            ˛    and Arkadiusz Szterk
 National Medicines Institute, 30/34 Chełmska, 00-725 Warsaw, Poland; i.ksiazek@nil.gov.pl (I.K.);
 a.szterk@nil.gov.pl (A.S.)
 * Correspondence: a.zmyslowski@nil.gov.pl

 Received: 11 September 2020; Accepted: 12 November 2020; Published: 13 November 2020

 Abstract: A GC–MS/MS method with EI ionization was developed and validated to detect and
 quantify N-nitrosodimethylamine (NDMA) and seven other nitrosamines in 105 samples of metformin
 tablets from 13 different manufactures. Good linearity for each compound was demonstrated over
 the calibration range of 0.5–9.5 ng/mL. The assay for all substances was accurate and precise. NDMA
 was not detected in the acquired active pharmaceutical ingredient (API); however, NDMA was
 detected in 64 (85.3%) and 22 (91.7%) of the finished product and prolonged finished product samples,
 respectively. European Medicines Agency recommends the maximum allowed limit of 0.032 ppm in
 the metformin products. Hence, 28 finished products and 7 pronged dosage products were found to
 exceed the acceptable limit of daily intake of NDMA contamination. The implications of our findings
 for the testing of pharmaceutical products are discussed.

 Keywords: NDMA; nitrosamines; GC-MS; metformin

1. Introduction
     In general, N-nitrosamines (NAs) are the products of reactions between a nitrosating agent and
a secondary or tertiary amine; NAs are formed preferentially at elevated temperature. Thus, NAs
are mainly detected in food and drinks after processing [1]. In foods, nitrous anhydride is the
main nitrosating agent formed from nitrite in an acidic aqueous solution. In drinking water,
N-nitrosodimethylamine (NDMA) is the most simple and volatile NA that can form during the
degradation of dimethylhydrazine (a component of rocket fuel) by chloramination of amine-based
precursors or as a byproduct of anion exchange purification of water [2]. NDMA has been shown to
be formed in certain foods due to a direct-fire drying process. International Agency for Research on
Cancer (IARC) has classified NDMA as a probable carcinogen in humans. NDMA is known to be
genotoxic in vivo and in vitro [3,4]. Several case–control studies and a single cohort study of NDMA
in humans supported the assumption that NDMA consumption is positively associated with either
gastric or colorectal cancer [5–7]. Therefore, due to possible contamination of water with NDMA,
the World Health Organization (WHO) and U.S. Environmental Protection Agency (EPA) have set the
drinking water guideline limits to 100 ng/L and 0.4 ng/L in tap water, respectively [8,9]. Only in a few
foods and countries, limits have been set for NAs. In the United States, a limit of 10 µg/kg has been set
for total volatile NAs in cured meat products. In 2005, China introduced a limit of 4 and 7 µg/kg of
NDMA in fish and related products, respectively [10]. There are currently no maximum regulatory
limits for the level of N-nitroso-compounds in food in the European Union [11].
     Recently, NDMA and other NAs, e.g., N-nitrosodiethylamine (NDEA), have been detected in
several pharmaceuticals, including sartans (valsartan, losartan, and candesartan) and raniditine [12,13].
The detection of the NDMA impurity was incidental and happened while performing other tests [14].
Improvement in the analytical techniques enabled the detection of NAs concentrations as low as 1

Molecules 2020, 25, 5304; doi:10.3390/molecules25225304                         www.mdpi.com/journal/molecules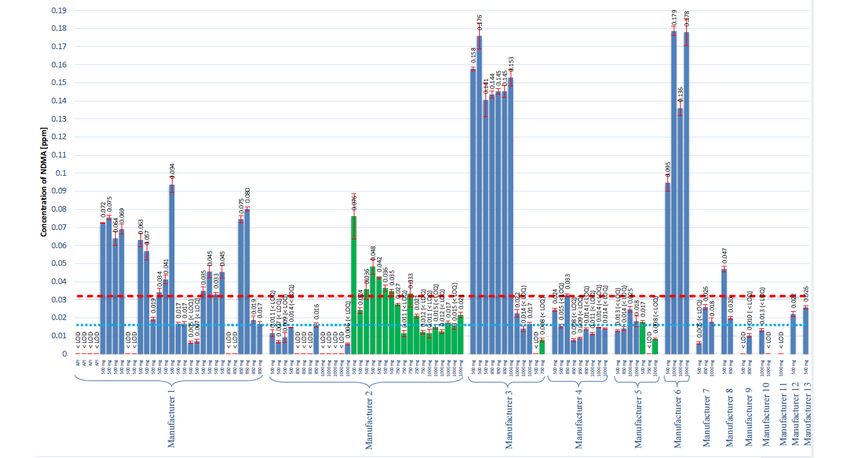
Molecules 2020, 25, 5304                                                                             2 of 15

ng/L [15]. After a thorough investigation, it was discovered that changes in the production process of
the active pharmaceutical ingredient (API) are one of the actual reasons for NDMA contamination of
valsartan. Due to NDMA contamination, 22 countries issued recalls involving 2,300 valsartan batches
from Germany, Norway, Finland, Sweden, Hungary, the Netherlands, Austria, Ireland, Bulgaria, Italy,
Spain, Portugal, Belgium, France, Poland, Croatia, Lithuania, Greece, Canada, Bosnia and Herzegovina,
Bahrain and Malta [16]. However, in addition to sartans and ranitidine, the European Medicines Agency
(EMA) has recently announced that metformin-containing finished products can be contaminated with
NDMA [17].
      Metformin is the most widely used medication around the world for the treatment of type
2 diabetes mellitus [18]. Usually, metformin is the first-line treatment that works by reducing the
production of glucose in the body and reducing glucose absorption from the gut. Metformin is also
effective against various conditions, including prediabetes, polycystic ovarian syndrome, obesity,
gestational diabetes mellitus, and cancer [19]. Metformin has a relatively high allowed dosage up
to 2–3 g/day in Europe and the USA [20]. Therefore, the limit for NDMA and other NAs has been
set according to the maximum daily dosage (3 g/day). Acceptable intake of NDMA according to
EMA is 92 ng/day (the acceptable intake is a daily exposure to a compound, such as NDMA, NDEA,
or N-nitrosomethylbutylamine (NMBA), that approximates a 1:100,000 cancer risk after 70 years of
exposure). Therefore, recommended the maximum allowed limit of NDMA in the metformin products
to be set at 0.032 ppm.
      The main aim of the present study was to assay the NDMA content in the metformin API and
finished products. The gas chromatography-tandem mass spectrometry (GC-MS/MS) method for
quantification of NDMA and seven additional NAs was developed and validated. Additional attempts
that can explain the mechanism of NDMA formation during the manufacturing process were conducted.
The developed method was successfully applied to the analysis of 105 different metformin products of
13 different companies providing detailed insight into various degrees of NDMA contamination in
metformin finished products on the European market.

2. Results

2.1. Validation Results
     The chromatograms of the NAs standards, the sample solution, and the blank solution are
presented in Figure 1. An additional peak at approximately 8 min was observed in the sample
solution depending on the finished product manufacturer. The peak had a single MRM transition
of the NDMA (77 → 44.10) and did not co-elute with NDMA. Additional studies revealed that
the peak can be N,N-dimethylformamide (DMF), which can be used in the synthesis of metformin.
Therefore, DMF appears to be a residual solvent from the synthesis.
     Good linearity for each analyte can be achieved by using linear regression over the 0.5–9.5 ng/mL
calibration range. The coefficients of determination of the calibration curves were ≥0.995 for all analytes.
The results of the precision and accuracy estimates of the calibration standards for each analyte are
summarized in Table 1. The obtained accuracy parameters were ranging from 92.61% to 105.03% for
all analytes. The precision parameters for all NAs in all concentrations were below
Molecules 2020, 25, 5304 3 of 15
Table 1. Validation parameters for GC-MS/MS analysis of NAs.
LOD LOQ Final Concentration
NA Linearity Range Equation R2 (n = 8) after NA Addition Accuracy Precision
[ng/mL] [ng/mL]
1.5 ng/mL 99.60% 6.01%
N-nitrosodimethylamine y = 0.216x − 0.001 2.0 ng/mL 99.52% 3.42%
0.9990 0.33 1.00
NDMA
2.5 ng/mL 100.21% 4.85%
1.5 ng/mL 105.03% 4.76%
N-nitrosomethylethylamine y = 0.301x − 0.068 2.0 ng/mL 104.08% 5.21%
0.9997 0.16 0.49
NMEA
2.5 ng/mL 100.03% 5.48%
1.5 ng/mL 104.11% 6.27%
N-nitrosodiethylamine y = 0.203x − 0.023 2.0 ng/mL 106.13% 3.17%
0.9970 0.32 0.97
NDEA
2.5 ng/mL 103.69% 5.58%
1.5 ng/mL 98.99% 6.91%
N-nitrosodi-n-propylamine y = 0.145x − 0.014 2.0 ng/mL 101.88% 3.23%
0.9992 0.26 0.79
NDPA
2.5 ng/mL 103.09% 5.92%
0.5–9.5 ng/mL
1.5 ng/mL 92.61% 8.10%
N-nitrosodi-n-butylamine y = 0.257x − 0.040 2.0 ng/mL 96.31% 6.79%
0.9960 0.48 1.46
NDBA
2.5 ng/mL 95.17% 2.50%
1.5 ng/mL 98.39% 6.79%
N-nitrosopiperidine
y = 0.172x + 0.002 0.9976 0.45 1.36 2.0 ng/mL 102.99% 8.89%
NPip
2.5 ng/mL 99.04% 4.73%
1.5 ng/mL 97.53% 7.56%
N-nitrosopyrrolidine
y = 0.124x − 0.013 0.9958 0.49 1.48 2.0 ng/mL 103.05% 5.53%
NPyr
2.5 ng/mL 103.22% 5.94%
1.5 ng/mL 101.76% 10.55%
N-nitrosomorpholine y = 0.247x − 0.023 2.0 ng/mL 100.18% 8.07%
0.9981 0.39 1.20
NMor
2.5 ng/mL 98.96% 5.78%Molecules 2020, 25, x FOR PEER REVIEW 4 of 16
Molecules 2020, 25, 5304 4 of 15
Figure 1. The chromatograms of (1) the N-nitrosamines (NAs) standards (1.0 ng/mL); (2) the NAs
standards
Figure 1. (5.0
The ng/mL); (3) the sample
chromatograms of (1) solution; (4) the blank(NAs)
the N-nitrosamines solution.
standards (1.0 ng/mL); (2) the NAs
standards (5.0 ng/mL); (3) the sample solution; (4) the blank solution.
The triplicate analysis of the finished product yielded good precisions for NDMA assay ranging
from The
0.36% to 16.28%,
triplicate thus of
analysis verifying
the finishedthe repeatability
product yielded of the
good assay appliedfor
precisions to the
NDMA finished
assayproducts
ranging
containing various concentrations of the corresponding analytes.
from 0.36% to 16.28%, thus verifying the repeatability of the assay applied to the finished Higher relative standard deviations
products
were obtained
containing in the prolonged
various concentrations dosage offinished products (up to
the corresponding 22.09%),Higher
analytes. probablyrelative
due to hindered
standard
extraction of the formed gel of carboxymethyl cellulose used in the tablet
deviations were obtained in the prolonged dosage finished products (up to 22.09%), probably due to formulations.
The recovery
hindered extractionofofeach spiked gel
the formed solution has been calculated.
of carboxymethyl cellulose used Figure 2 (1)tablet
in the presents the NDMA
formulations.
recoveries of the spiked
The recovery of each samples.
spiked The calculated
solution has beenrecovery was found
calculated. Figureto 2be(1)
outside
presentsof thethe±2 × SD
NDMA
range
recoveries of the spiked samples. The calculated recovery was found to be outside of the ±2 × for
of obtained mean recovery only three times of all tests performed however, the set limit SD
the recovery was 70–130%, meaning that each analysis remains valid. Additionally,
range of obtained mean recovery only three times of all tests performed however, the set limit for the the yield of the
extraction
recovery was of NDMA
70–130%,frommeaning
water solution
that each to CH 2 Cl2 was
analysis controlled
remains the IS − d6 -NDMA
valid.byAdditionally, the yield recovery.
of the
According to Figure 2 (2), the recovery values were from 69.31 to 91.08%.
extraction of NDMA from water solution to CH2Cl2 was controlled by the IS − d6-NDMA recovery.
In eachto
According analysis,
Figure 2the (2),NDMA contentvalues
the recovery was determined
were fromusing69.31 the standard curve. The concentration
to 91.08%.
of theInstandards was the same in every analysis.
each analysis, the NDMA content was determined using the Therefore, the parameters thatstandard
describe the linearity
curve. The
can be compared
concentration of through the whole
the standards was study
the that
sameincluded
in every 105analysis.
samples.Therefore,
Figure 2 (3)the shows the changes
parameters that
in one of the
describe the linearity
most important parameters,
can be compared whichthe
through influences
whole studythe measurement
that included in 105the majority
samples. of the2
Figure
samples, the slope of the calibration curves. The slope value appears
(3) shows the changes in one of the most important parameters, which influences the measurement to have a slight trend towards a
higher value, which
in the majority may
of the be due the
samples, to the
slopeevaporation of the stock
of the calibration standard
curves. solution
The slope (dissolved
value appearsintoMeOH)have a
despite being stored in a freezer.
slight trend towards a higher value, which may be due to the evaporation of the stock standard
The (dissolved
solution main aim in ofMeOH)
the proposed
despite GC-MS/MS
being storedmethod is the determination of NDMA in the
in a freezer.
metformin API or
The main aimfinished
of theproducts.
proposedHowever, GC-MS/MS chromatography
method is the was developed to quantify
determination of NDMA all in
listed
the
NAs. The standard and spike solutions were prepared only with the NAs
metformin API or finished products. However, chromatography was developed to quantify all listed mixture. The chromatography
method
NAs. The wasstandard
developedand to evaluate each prepared
spike solutions were sample
preparedand only estimate
withwhether
the NAs it is contaminated
mixture. The
by
chromatography method was developed to evaluate each prepared sample and estimateapart
mistake at any point in the preparation. If the samples contain any additional NAs whether fromit
NDMA, an investigation should be performed to determine if there
is contaminated by mistake at any point in the preparation. If the samples contain any additional was a mistake in the sample
preparation
NAs apart from or ifNDMA,
metformin is indeed contaminated
an investigation with another
should be performed NA. However,
to determine if theresuchwasan event did
a mistake in
not happen throughout the whole study of 105 samples, and no additional
the sample preparation or if metformin is indeed contaminated with another NA. However, such NAs were detected in the
an
metformin
event did notproducts.
happen throughout the whole study of 105 samples, and no additional NAs were
detected in the metformin products.Molecules 2020, 25, 5304 5 of 15
Molecules 2020, 25, x FOR PEER REVIEW 5 of 16
130
120
110
100
Recovery [%]
90
80
70
60
0 10 20 30 40 50 60 70 80 90 100 110
Analysis number
(a)
95
90
85
IS recovery [%]
80
75
70
65
0 10 20 30 40 50 60 70 80 90 100 110
Analysis number
(b)
0.26
0.25
Slope of caibration curve [ppm]
0.24
0.23
0.22
0.21
0.2
0.19
0 10 20 30
Calibration curve number
(c)
Figure 2. (a) NDMA recovery in the spiked samples estimated in each analysis of the metformin products. (b)
Figure 2. (a) NDMA recovery in the spiked samples estimated in each analysis of the metformin
Internal standard (IS – d6-NDMA) recovery as a percentage of the mean peak area in the standard solutions. (c)
products. (b) Internal standard (IS – d6 -NDMA) recovery as a percentage of the mean peak area in the
Slope of the calibration curves of NDMA calculated in each analysis. Green lines represent ± 2 × SD, red lines
standard solutions. (c) Slope of the calibration curves of NDMA calculated in each analysis. Green lines
represent ±3 × SD.
represent ± 2 × SD, red lines represent ±3 × SD.Molecules 2020, 25, 5304 6 of 15
2.2. Artifact Formation
Possible artifact formation at any point during the sample preparation, and GC analysis is one of
the most important issues of metformin analysis. It is worth mentioning that during the development
of the method, we have experienced issues due to artifact formation in the sample solution. In the
beginning, the sample preparation method was based on the direct extraction of the metformin API
in the CH2 Cl2 solution containing the IS. Various syringe filters were tested to remove undissolved
metformin from the CH2 Cl2 solution. Based on the acquired results, we concluded that an artifact
was experienced when the nylon syringe filters were used. The amount of NDMA formation after the
filtration differed based on the time of the filtration and the brand of the filter used. However, during
the method development, there was no information about the NDMA origin/formation in metformin,
and thus, NDMA could have been entrapped in the metformin crystals; based on the obtained results,
development of the method for direct CH2 Cl2 extraction was discontinued, and the extraction of the
aqueous solution of metformin was pursued.
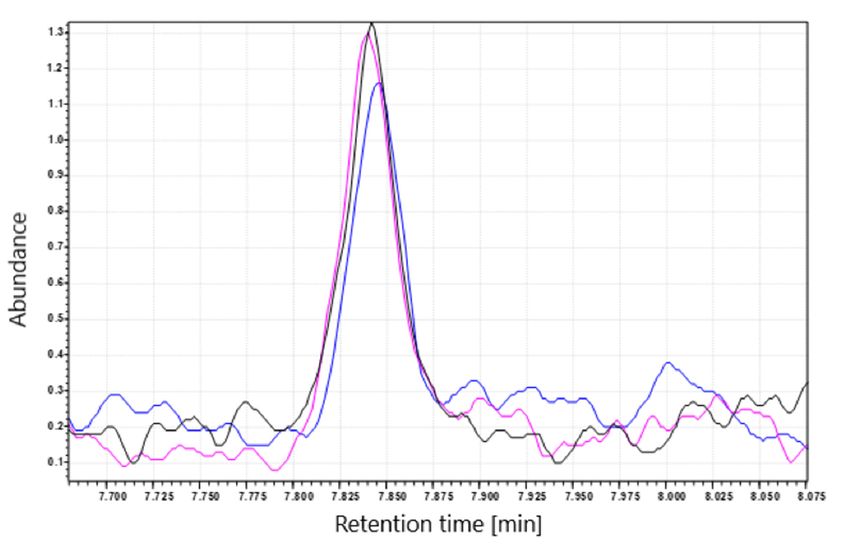
2.3. Results of the Assay of NDMA Concentration
All tested samples met the criteria of the System Suitability Test established in Section 4.5.4;
therefore, it was concluded that all conducted tests were valid. NDMA was found in 86 (81.9%) of
all 105 products tested, including 64 (85.3%) metformin finished products and 22 (91.7%) prolonged
dosage finished products. The average content (range) in the 500, 850, and 1000 mg metformin
finished products was 0.063 ppm (0.017–0.176 ppm), 0.065 ppm (0.016–0.145 ppm), and 0.083 ppm
(0.017–0.179 ppm), respectively. The average content (range) in the 500, 750, and 1000 mg metformin
prolonged dosage finished products was 0.038 ppm (0.017–0.076 ppm), 0.027 ppm (0.021–0.033 ppm),
and 0.019 ppm (0.017–0.021 ppm), respectively. The results of the analyzed products are presented
in Figure 3. Based on the recommendation of the EMA and on our data, 28 finished products and
7 prolonged dosage products were found to exceed the acceptable daily intake limit with regard to the
NDMA contamination.Molecules 2020, 25, 5304 7 of 15
Figure 3. The results of the assay of NDMA concentration in all tested metformin products. Blue bars represent finished products, and the green bars corresponds to
the prolonged finished products. The red dotted line represents the suggested maximum allowed concentration of 0.032 ppm. The blue dotted line represents the LOQ
1
of the method that corresponds to 0.016 ppm.Molecules 2020, 25, x FOR PEER REVIEW 8 of 16
Molecules 2020, 25, 5304 8 of 15
2.4. Study of Possible Formation Routes of NDMA
2.4. Study of Possible Formation Routes of NDMA
To ensure that NDMA does not originate from one of the excipients, the developed and
To ensure that NDMA does not originate from one of the excipients, the developed and
validated method was used to analyze the additional substances. The excipients available for the
validated method was used to analyze the additional substances. The excipients available for
testing included sodium carboxymethyl starch (type A), povidone (K30), colloidal silica
the testing included sodium carboxymethyl starch (type A), povidone (K30), colloidal silica
(anhydrous), corn starch, and magnesium stearate. The recovery of NDMA in each substance was
(anhydrous), corn starch, and magnesium stearate. The recovery of NDMA in each substance
verified. The recovery in the excipient analysis was 87.75%, 108.50%, 98.52%, 80.76%, and 85.58%,
was verified. The recovery in the excipient analysis was 87.75%, 108.50%, 98.52%, 80.76%, and 85.58%,
respectively. Therefore, we concluded that the method can be used to control the excipients.
respectively. Therefore, we concluded that the method can be used to control the excipients.
However, no contamination with NDMA was detected in the analyzed samples.
However, no contamination with NDMA was detected in the analyzed samples.
Additionally, to ensure that NDMA does not form during heating of the tablets in the blistering
Additionally, to ensure that NDMA does not form during heating of the tablets in the blistering
process, we subjected the metformin tablets to a short period (30 s and 2 min) of heating at high
process, we subjected the metformin tablets to a short period (30 s and 2 min) of heating at high
temperature (100 °C). After heating, the concentration of NDMA in the tablets was decreased (Figure
temperature (100 ◦ C). After heating, the concentration of NDMA in the tablets was decreased (Figure 4).
4). The decrease was observed in tablets containing NDMA below and above the recommended
The decrease was observed in tablets containing NDMA below and above the recommended limit.
limit. The decrease in the determined NDMA concentration may be caused by NDMA evaporation
The decrease in the determined NDMA concentration may be caused by NDMA evaporation from the
from the surface of the tablets.
surface of the tablets.
Figure 4. NDMA peak before and after treatment with a short period of high temperature (100 ◦ C).
Figure 4. NDMA peak before and after treatment with a short period of high temperature (100 °C).
The black line (–) corresponds to tablets extracted with CH2 Cl2 (control), (pink line) tablets heated for
The black line (–) corresponds to tablets extracted with CH2Cl2 (control), (pink line) tablets heated for
30 s; (blue line) tables heated for 2 min.
30 s; (blue line) tables heated for 2 min.
Heating the tablets containing the NDMA levels above and below the set limit (0.032 ppm) at
Heating the tablets containing the NDMA levels above and below the set limit (0.032 ppm) at
high temperature (100 ◦ C) did not increase NDMA concentration, and instead decreased it—probably
high temperature (100 °C) did not increase NDMA concentration, and instead decreased
as a result of NDMA evaporation.
it—probably as a result of NDMA evaporation.
3. Discussion
3. Discussion
The gas chromatography and MRM transition method were optimized for eight common NAs.
ThereTheare agas chromatography
number of availableand MRM transition
instrumental methodsmethod
for NAswere optimized
analysis, and for
the eight common
methods of theNAs.
gas
There are a number of available instrumental methods
and liquid chromatography are the most popular choice. for NAs analysis, and the methods of the gas
and The
liquidselection
chromatography are the most
of a column popular
for gas choice.
chromatography can include non-polar columns
The selection of a column for gas chromatography can
(e.g., 5% phenyl-methylpolysiloxane, HP-5MS and DB-5MS), intermediateinclude non-polar polarity
columns columns
(e.g., 5%
phenyl-methylpolysiloxane, HP-5MS and DB-5MS), intermediate polarity columns
(e.g., 35% phenyl-methylpolysiloxane, HP-35MS) and high polarity columns (e.g., polyethylene (e.g., 35%
phenyl-methylpolysiloxane, HP-35MS) and high polarity columns (e.g., polyethylene glycol,Molecules 2020, 25, 5304 9 of 15
glycol, DB-WAX and TG-WAX) [21]. Analysis of NAs requires very low detection limits, and therefore,
the use of mass spectrometry, preferably with the MS/MS mode, is the obvious choice. The ionization
sources previously used in the analysis of NAs include electron impact (EI) with MS/MS mode [22,23]
and high-resolution mass spectrometry (HRMS) [24] with positive chemical ionization (PCI) using
methanol [25], acetonitrile [26], ammonia [27], or methane [21] as the reagent gas. CI has been shown to
yield better specificity than that of EI and CI, thus provides higher sensitivity in the NAs analysis [28].
However, EI remains the most popular choice for GC-MS/MS, due to its ability of simultaneous
identification by comparing the registered spectra with the spectra stored in the mass spectra library.
Alternatively, The NA analysis can be performed using liquid chromatography on a reversed-phase
column (mainly C8 or C18) using a combination of electrospray ionization (ESI) or atmospheric pressure
chemical ionization (APCI) as ionization method used in a mass spectrometer [13]. However, in addition
to chromatography and mass spectrometry, sample preparation is an important part of NAs analysis;
in the case of GC, the injection method is also important. Injection of the samples onto the GC system
for NAs analysis can use classical split/splitless [29], programmed temperature or cold injector [30,31],
thermal desorption (TD), or headspace (HS) injection [32]. Sample preparation can involve distillation,
liquid-liquid extraction, and/or SPE. However, various pitfalls of complex sample preparation steps
have been reported in the analysis of NAs in various matrices. The combination of liquid-liquid
extraction with CH2 Cl2 , which is the most popular extraction solvent for NAs, with splitless injection
in GC appears to be the most frequently used in the case of analysis of sartans by Official Medicines
Control Laboratories (OMCLs) [13]. A similar solution was also already used in the method originated
from Singapore; however, sample preparation requires using 0.1 M solution of hydrochloric acid as a
water phase [33]. In order to minimize the risk of the unwanted reaction between hydrochloric acid or
its impurities, it was decided to use deionized water instead. Nevertheless, using CH2 Cl2 is apparently
the easiest, the fastest, and robust sample preparation; all the properties are required in the quality
control of the medicinal products.
In addition to the studies of NDMA contamination in the metformin finished products, experiments
were conducted to further investigate the NA formation mechanism. The most obvious way to prove
that NDMA originates during the manufacturing process is to measure NDMA in API and in finished
products in which this particular API was used. Figure 3 represents the results (Manufacturer 1),
obtained with four different batches of API and 24 different batches of finished products manufactured
with analyzed API. The content of NDMA in API was always below the LOD; however, in the finished
product, NDMA presence was detected in 22 batches, and 15 batches had NDMA level in excess
of the 0.032 ppm recommended limit. Therefore, the manufacturing process of various batches of
the excipients has an impact on the NDMA content. We received a list of all excipients used in the
manufacturing process from Manufacturer 1 to evaluate possible NDMA contamination. However,
no NDMA was found in all provided substances, and we, thus, conclude that the excipients are not the
source of NDMA.
Another result confirming that NDMA is manufacturing contamination that was obtained in the
batches from Manufacturers 2 and 3. The problem apparently occurs in the manufacturing process of
prolonged dosage products. The manufacturing process and the excipients were different from those
in the finished product. A similar situation occurs in the case of Manufacturer 3; seven batches had
NDMA concentration above 0.140 ppm, and five batches had NDMA concentrations below 0.032 ppm
(two batches with prolonged dosage). After these results were obtained, we have identified that these
five and seven batches were manufactured in different places. Therefore, the manufacturing line and
excipients were probably different, and as a result, the NDMA content was also different.
One of the hypotheses on the mechanism of the NDMA formation during the manufacturing
process is that dimethylamine (DMA, impurity F, according to European Pharmacopeia, 0,05% w/w
allowed) present in the metformin API is reacting with the residual nitrites/nitrates from the excipients
during the wet granulation process. However, heating of the API containing 0.03% DMA mixed
with sodium nitrite and sodium nitrate did not generate NDMA-positive results (data not shown).Molecules 2020, 25, 5304 10 of 15
Despite that heating metformin API with nitrites/nitrates, it is not an actual manufacturing process,
some other factor probably is needed to catalyze the NDMA formation, and this factor is delivered
through one of the excipients; at this point, the factor eludes detection.
Another possible hypothesis is that NDMA is formed during the blistering process of the finished
product (the tablets in blisters are exposed to transient high temperature during film sealing) or is
present as an impurity of the ink, which is used to print on the aluminum foil. However, our study
indicates that NDMA is not a surface impurity, but is rather an impurity that is present in the whole
tablet mass. Heating the tablets at a high temperature (100 ◦ C) with NDMA levels above or below
the set limit (0.032 ppm) does not increase NDMA concentration, and instead decreases it—probably
as a result of NDMA evaporation. However, the is a possibility that during the high-temperature
treatment, the substrates needed to form NDMA have already reacted, and heating the tablets for
the second time does not cause additional NDMA formation. Additionally, we received a batch from
one of the manufacturers sampled before the blistering process (bulk batch); we have assayed the
NDMA concentration in this batch, and it was above the recommended limit of 0.032 ppm. Therefore,
we conclude that increased temperature present during the blistering process is not responsible for the
NDMA formation.
4. Materials and Methods
4.1. Materials
All solvents for analysis were of MS-grade quality. Dichloromethane (CH2 Cl2 ) and methanol
(MeOH) were purchased from Merck Millipore (Germany, Darmstadt). The NAs mix in MeOH was
purchased from Sigma-Aldrich (Poznań, Poland), which contained NDMA, NMEA, NDEA, NDPA,
NDBA, NPip, NPyr, and NMor in a concentration of 2 mg/mL of each component. The deuterated
d6 -NDMA (99.95 atom % D; 1 mg/mL) in CH2 Cl2 was obtained from LGC Standards (Łomianki,
Poland). Finished medicinal products were acquired from several marketing authorizations holders
(MAHs). The API and excipients (sodium carboxymethyl starch (type A), povidone (K30), colloidal
silica (anhydrous), corn starch, and magnesium stearate) available for the testing were delivered by
one of the manufacturers.
4.2. GC-MS Method of Nitrosamine Determination
A Shimadzu GC-2010 Plus system with an Optic-4 autosampler coupled with an MS-TQ8050 mass
spectrometer was used. NAs were separated on a TG-WAXMS column (30 m × 0.25 mm, film thickness
0.5 µm). The carrier gas was helium with a flow rate of 36.2 cm/sec (1 mL/min). The initial column
temperature of 45 ◦ C was held for 3 min and then programmed to increase at 25 ◦ C/min to 130 ◦ C,
at 12 ◦ C/min to 200 ◦ C, and at 20 ◦ C/min to 250 ◦ C, where it was held for 3 min. Injections (2.0 µL) were
made in the splitless program mode. Injector temperature was 250 ◦ C with a high-pressure injection
(300 kPa) for 1 min. The transfer line temperature was 250 ◦ C, ion source temperature was 250 ◦ C,
and the energy of the electron impact ionization was 70 eV. The method parameters are listed in Table 2.
NAs were analyzed using the MRM transition listed in Table 3.Molecules 2020, 25, 5304 11 of 15
Table 2. Parameters of the developed GC-MS method.
GC-Parameters
Column TG-WAXMS 30 m × 0.25 mm; 0.5 µm
Carrier gas Helium
Flow rate 36.2 cm/s (1 mL/min)
Injector port temp. 250 ◦ C
Injection volume 2 µL
Injection mode Splitless, high-pressure injection 300 kPa
45 ◦ C hold time 3 min
130 C rate 25 ◦ C hold time 0 min
◦
Oven program
200 ◦ C rate 12 ◦ C hold time 0 min
250 ◦ C rate 20 ◦ C hold time 3 min
MS-Parameters
Ion Source Temperature 250 ◦ C
Interface Temperature 250 ◦ C
Fixed Electron Energy 70 eV
Acquisition Type MRM
Solvent Delay 5 min
Collision Gas argon 200 kPa
Table 3. MRM transitions for analyzed NAs.
Quantitative Transition Qualitative Transition
Component Precursor Product Ion Precursor Product Ion
CE (V) CE (V)
Ion (m/z) (m/z) Ion (m/z) (m/z)
NDMA 74 44.10 5 74 42.10 14
d6 -NDMA 80 50.10 5 80 46.10 14
NMEA 88 71.10 5 88 73.10 7
NDEA 102 85.10 5 102 56.10 14
NDPA 130 113.20 5 130 88.10 9
NDBA 116 99.10 5 158.15 99.10 7
Npip 114 84.10 8 114 97.10 8
Npyr 100 55.10 7 100 68.10 15
Nmor 116 86.10 3 116 56.10 23
4.3. Standard Solution Preparation
The internal standard (IS) solution (100 ng/mL) was prepared from the commercially available
d6 -NDMA standard (1 mg/mL) and diluted with CH2 Cl2 . The stock standard solution (1 µg/mL) was
prepared from the available standard of NAs in a 50 mL volumetric flask in MeOH. Then, the solution
was diluted to 10 ng/mL with CH2 Cl2 . The calibration curve was prepared at concentrations of 0.5; 1.0;
1.5; 2.0; 2.5; 5.0; 7.5; and 9.5 ng/mL by addition of the internal standard to each solution to the final
concentration of 5 ng/mL d6 -NDMA. The spiking solution was prepared by diluting the prepared NAs
solution in MeOH to 10 ng/mL with deionized water.
4.4. Sample and Spiked Sample Preparation
4.4.1. Active Pharmaceutical Ingredient (API)
For API samples, 500 mg of the active ingredient was weighed into a 15 mL centrifuge tube.
Metformin was dissolved in 7 mL deionized water; 400 µL of IS solution was added, briefly vortexed,
and then shaken well for at least 5 min. CH2 Cl2 (7.6 mL) was added to the solution, briefly vortexed,
and then shaken well for at least 10 min. The suspension was then centrifuged at approximately
10,000× g for at least 10 min. The lower organic phase was transferred to a clean sample vial.
The extraction process was prepared three times from independent weights.Molecules 2020, 25, 5304 12 of 15
For the spiking test solution, the same amount of API was weighed into a 15 mL centrifuge tube;
1.6 mL of the spiking solution was added along with 5.4 mL water, and the tube was mixed and
extracted with CH2 Cl2 as described above.
4.4.2. Finished Product
A representative sample was prepared from approximately 10 ground tablets. The mixed tablet
powder was weighed into a 15 mL centrifuge tube; the weight of the material corresponded to the
amount of active ingredient of approx. Five hundred milligram and specific attention was paid not
to exceed 1.5 g of total weight. The extraction process was prepared three times from independent
weights. The extract and spiked solution were prepared, as described above for the API solution.
4.4.3. Prolonged Dosage Finished Product
A representative sample was prepared from approximately 10 ground tablets. Mixed tablet
powder was weighed into a 15 mL centrifuge tube; the weight of the material corresponded to the
amount of the active ingredient of approx. 500 mg; specific attention was paid not to exceed 1.5 g of
total weight.
The sample powder was mixed with 7 mL water, immediately mixed, and vortexed.
Then, the sample was incubated for at least 10 min to dissolve the whole tablet mass in water.
Then, 400 µL of IS solution and 3.6 mL of CH2 Cl2 were added; the mixture was briefly vortexed,
and shaken well to disperse the formed gel in the organic phase. CH2 Cl2 (4 mL) was added to this
suspension, briefly vortexed and then shaken well for at least 10 min. The suspension was then
centrifuged at approximately 10,000× g for at least 10 min. The lower organic phase was transferred
to a clean sample vial. The extraction process was prepared three times from independent weights.
To prepare the spiking test solution, the same amount of the tablet mass was weighed into a 15 mL
centrifuge tube; 1.6 mL of the spiking solution was added with 5.4 mL water; the solution was mixed,
and extracted with CH2 Cl2 as described above.
4.4.4. Excipient Samples
To prepare the excipient samples, 1000 mg of an excipient (500 mg in case of colloidal silica)
was weighed into a 15 mL centrifuge tube. The substances were dissolved or suspended in 7 mL
deionized water; 400 µL of IS solution was added, vortexed briefly, and then shaken well for at least
5 min. CH2 Cl2 (7.6 mL) was added to the solution, vortexed briefly, and shaken well for at least 10 min.
The suspension was then centrifuged at approximately 10,000× g for at least 10 min. The lower organic
phase was transferred to clean sample vial. The test samples were prepared from three independent
weights. For the spiking test solution, the same amount of the substances was weighed into a 15 mL
centrifuge tube; 1.6 mL of spiking solution was added with 5.4 mL water; the solution was mixed and
extracted with CH2 Cl2 , as described above.
4.4.5. Sample Blank Solution Preparation
The sample blank solution was prepared as described in Section 4.4.1, but without the addition of
the sample.
4.5. Validation of the GC-MS/MS Method
4.5.1. Specificity
The specificity of the method of NA assay was verified by comparing the chromatograms of the
contaminant-free samples (finished and prolonged dosage form products) before and after spiking
with the corresponding analytes. No peaks from the tablet matrix should coelute at the retention times
of any of the NAs.Molecules 2020, 25, 5304 13 of 15
4.5.2. Linearity, Precision and Accuracy, Limits of Detection (LOD) and Limits of Quantification (LOQ)
Analytes were quantified using d6 -NDMA as IS for all NAs. For the determination of linearity of
the NDMA, NDEA, NDPA, NDBA NPip, Npyr, and Nmor assay three eight-point calibration curves
were constructed as described in Section 4.3. The calibration curves were evaluated individually by
linear regression. The slopes, intercepts, and the coefficients of determination of the corresponding
individual curves were calculated. For acceptable linearity, the coefficient of determination of each
calibration curve should be R2 ≥ 0.995.
The acceptable accuracy of six injections of three different concentration, including 1.5 ng/mL,
2.0 ng/mL, and 2.5 ng/mL, expressed as the percentage of the measured concentration versus the
theoretical concentration of the prepared solutions, should be in a range between 90–110%. The precision,
expressed as the relative standard deviation, should not exceed 15% at each concentration level tested.
LODs and LOQs were calculated using the linearity curves based on the standard deviation of the
response (σ) and the slope of the curves (S) using the multiplier suggested by the ICH standard. The LOD
and LOQ were calculated from the following equations: LOD = (3.3 × σ/S) and LOD = (10 × σ/S).
4.5.3. Recovery
In each metformin sample analysis, the spike solution was prepared by spiking NAs solution to
an obtained a final concentration of 2.0 ng/mL NAs in the organic phase. The recovery was calculated
as the ratio of subtracted mean results of the sample from the calculated result of the spiked solution,
to the theoretical spiking concentration. Additionally, the recovery of the IS was calculated as a ratio of
the mean IS peak area in the sample solution to the mean IS peak area in the standard solution.
4.5.4. System Suitability Test
To validate each test, the listed conditions have to be met: No interfering signals in the sample
blank solution; no significant co-elution in the spiked sample solutions; S/N of the spiked test solutions
has to be at least 10 for all spiked NAs signals; correlation of the calibration curves has to be at least
0.995; area of d6 -NDMA in the sample solution has to be at least 60% of the mean area of d6 -NDMA in
the standard solutions; and recovery in the spiked sample solution has to be between 70% and 130%.
5. Conclusions
After the discovery of the presence of NAs in sartans and ranitidine (especially NDMA and NDEA),
the metformin finished products are other medications that have been found to be contaminated with
NDMA. After the sartans and ranitidine event, the scientists should have been more prepared for this
type of crisis. However, the reality seems to be as brutal as always. Resolving the unexpected events in
the case of sartans and ranitidine was achieved by withdrawing the finished product from the market.
On the other hand, the metformin finished products do not have any substitutes, which have a similar
profile of action. The available substitutes for metformin are sulfonylurea derivatives (which possess a
substantially higher possibility of adverse reactions) and insulin (which is a pro-injection drug that
requires control of blood sugar and estimation of the dose by the patient). Therefore, a similar solution
is not applicable in this case.
The GC–MS/MS method developed for the quantitation of eight NAs, including NDMA, NMEA,
NDEA, NDPA, NDBA, NPip, NPyr, and NMor, was found to be suitable for the determination of traces
of the analytes according to the validation results. Almost one-third of all tested samples were found to
contain NDMA levels above the recommended limit based on maximum daily dosage. To the best of our
knowledge, this is the first report that describes the measured concentrations of NDMA in the metformin
medicinal products. The obtained results show the actual seriousness of the situation. Therefore,
manufacturers, regulatory offices, and OMCLs need to cooperate to solve this problem. In our opinion,
the NDMA contamination in the metformin finished products should be considered as an unforeseen
event, which was not influenced by pharmaceutical companies/manufacturers; therefore, it should notMolecules 2020, 25, 5304 14 of 15
jeopardize the reputation of a pharmaceutical company at any point. However, the problem of the
formation of NDMA during the manufacturing process remains unresolved; hence, routine analysis of
the finished products has to be applied to guarantee the quality and safety of available medications.
Author Contributions: A.Z.: Methodology, Validation, Writing—Original Draft; I.K.: Writing—Review & Editing;
A.S.: Supervision. All authors have read and agreed to the published version of the manuscript.
Funding: This research received no external funding.
Conflicts of Interest: The authors declare no conflict of interest.
References
1. Snodin, D.J.; Elder, D.P. Short commentary on NDMA (N-nitrosodimethylamine) contamination of valsartan
products. Regul. Toxicol. Pharmacol. 2019, 103, 325–329. [CrossRef] [PubMed]
2. Shen, R.; Andrews, S.A. NDMA formation from amine-based pharmaceuticals—Impact from prechlorination
and water matrix. Water Res. 2013, 47, 2446–2457. [CrossRef] [PubMed]
3. Brendler, S.Y.; Tompa, A.; Hutter, K.F.; Preussmann, R.; Pool-Zobel, B.L. In vivo and in vitro genotoxicity
of several N-nitrosamines in extrahepatic tissues of the rat. Carcinogenesis 1992, 13, 2435–2441. [CrossRef]
[PubMed]
4. Wang, H.-Y.; Qin, M.; Dong, L.; Lv, J.-Y.; Wang, X. Genotoxicity of a Low-Dose Nitrosamine Mixture as
Drinking Water Disinfection Byproducts in NIH3T3 Cells. Int. J. Med. Sci. 2017, 14, 961–969. [CrossRef]
5. La Vecchia, C.; D’avanzo, B.; Airoldi, L.; Braga, C.; DeCarli, A. Nitrosamine intake and gastric cancer risk.
Eur. J. Cancer Prev. 1995, 4, 469–474. [CrossRef]
6. Knekt, P.; Dich, J.; Hakulinen, T. Risk of colorectal and other gastro-intestinal cancers after exposure to nitrate,
nitrite and N-nitroso compounds: A follow-up study. Int. J. Cancer 1999, 80, 852–856. [CrossRef]
7. Pottegård, A.; Kristensen, K.B.; Ernst, M.T.; Johansen, N.B.; Quartarolo, P.; Hallas, J. Use of
N-nitrosodimethylamine (NDMA) contaminated valsartan products and risk of cancer: Danish nationwide
cohort study. BMJ 2018, 362, k3851. [CrossRef]
8. World Health Organization. Guidelines for Drinking-Water Quality; World Health Organization: Geneva
Switzerland, 1993; ISBN 978-92-4-154535-8.
9. United States Environmental Protection Agency. Technical Fact Sheet—N-Nitroso-dimethylamine (NDMA);
2014. Available online: https://www.epa.gov/sites/production/files/2014-03/documents/ffrrofactsheet_
contaminant_ndma_january2014_final.pdf (accessed on 10 September 2020).
10. Crews, C. The determination of N-nitrosamines in food. Qual. Assur. Saf. Crop. Foods 2010, 2, 2–12. [CrossRef]
11. Herrmann, S.S.; Duedahl-Olesen, L.; Granby, K. Occurrence of volatile and non-volatile N-nitrosamines in
processed meat products and the role of heat treatment. Food Control. 2015, 48, 163–169. [CrossRef]
12. Buckingham, L. Suspension of Ranitidine Medicines in the EU. European Medicines Agency, 2020.
Available online: https://www.ema.europa.eu/en/news/suspension-ranitidine-medicines-eu (accessed on
10 September 2020).
13. Sörgel, P.F.; Kinzig, M.; Abdel-Tawab, M.; Bidmon, C.; Schreiber, A.; Ermel, S.; Wohlfart, J.; Besa, A.;
Scherf-Clavel, O.; Holzgrabe, U. The contamination of valsartan and other sartans, part 1: New findings.
J. Pharm. Biomed. Anal. 2019, 172, 395–405. [CrossRef]
14. Parr, M.; Joseph, J.F. NDMA impurity in valsartan and other pharmaceutical products: Analytical methods
for the determination of N-nitrosamines. J. Pharm. Biomed. Anal. 2019, 164, 536–549. [CrossRef] [PubMed]
15. Munch, J.W.; Bassett, M.V. Determination of Nitrosamines in Drinking Water by Solid Phase Extraction and
Capillary Column Gas Chromatography with Large Volume Injection and Chemical Ionization Tandem
Mass Spectrometry (MS/MS). EPA Report; 2004. Available online: https://cfpub.epa.gov/si/si_public_record_
report.cfm?Lab=NERL&dirEntryId=103912 (accessed on 17 June 2020).
16. Common Heart Drug Recalled in 22 Countries for Possible Cancer Link—CNN. Available online: https:
//edition.cnn.com/2018/07/06/health/valsartan-heart-drug-recall-intl/index.html (accessed on 17 June 2020).
17. Francisco, E.M. EMA Update on Metformin Diabetes Medicines. European Medicines Agency,
2019. Available online: https://www.ema.europa.eu/en/news/ema-update-metformin-diabetes-medicines
(accessed on 20 June 2020).Molecules 2020, 25, 5304 15 of 15
18. Rojas, L.B.A.; Gomes, M.B. Metformin: An old but still the best treatment for type 2 diabetes. Diabetol. Metab.
Syndr. 2013, 5, 6. [CrossRef] [PubMed]
19. Nasri, H.; Rafieian-Kopaei, M. Metformin: Current knowledge. J. Res. Med. Sci. 2014, 19, 658–664.
20. Odawara, M.; Kawamori, R.; Tajima, N.; Iwamoto, Y.; Kageyama, S.; Yodo, Y.; Ueki, F.; Hotta, N. Long-term
treatment study of global standard dose metformin in Japanese patients with type 2 diabetes mellitus.
Diabetol. Int. 2017, 8, 286–295. [CrossRef] [PubMed]
21. Sieira, B.J.; Carpinteiro, I.; Rodil, R.; Quintana, J.B.; Cela, R. Determination of N-Nitrosamines by Gas
Chromatography Coupled to Quadrupole–Time-of-Flight Mass Spectrometry in Water Samples. Separations
2020, 7, 3. [CrossRef]
22. Lim, H.-H.; Oh, Y.-S.; Shin, H.-S. Determination of N-nitrosodimethylamine and N-nitrosomethylethylamine
in drug substances and products of sartans, metformin and ranitidine by precipitation and solid phase
extraction and gas chromatography–tandem mass spectrometry. J. Pharm. Biomed. Anal. 2020, 189, 113460.
[CrossRef]
23. Yahaya, A. Method development for the identification and quantitative analysis of seven nitrosamines using
gas chromatography mass spectrometry. Chem. Data Collect. 2019, 21, 100231. [CrossRef]
24. Planas, C.; Palacios, O.; Ventura, F.; Rivera, J.; Caixach, J. Analysis of nitrosamines in water by automated
SPE and isotope dilution GC/HRMSOccurrence in the different steps of a drinking water treatment plant,
and in chlorinated samples from a reservoir and a sewage treatment plant effluent. Talanta 2008, 76, 906–913.
[CrossRef]
25. Llop, A.; Borrull, F.; Pocurull, E. Pressurised hot water extraction followed by headspace solid-phase
microextraction and gas chromatography–tandem mass spectrometry for the determination of N-nitrosamines
in sewage sludge. Talanta 2012, 88, 284–289. [CrossRef]
26. Munch, J.W.; Bassett, M.V. Method development for the analysis of N-nitrosodimethylamine and other
N-nitrosamines in drinking water at low nanogram/liter concentrations using solid-phase extraction and gas
chromatography with chemical ionization tandem mass spectrometry. J. AOAC Int. 2006, 89, 486–497.
27. Sannino, A.; Bolzoni, L. GC/CI–MS/MS method for the identification and quantification of volatile
N-nitrosamines in meat products. Food Chem. 2013, 141, 3925–3930. [CrossRef] [PubMed]
28. Yoon, S.; Nakada, N.; Tanaka, H. A new method for quantifying N-nitrosamines in wastewater samples by
gas chromatography—Triple quadrupole mass spectrometry. Talanta 2012, 97, 256–261. [CrossRef] [PubMed]
29. Ramezani, H.; Hosseini, H.; Kamankesh, M.; Ghasemzadeh-Mohammadi, V.; Mohammadi, A. Rapid
determination of nitrosamines in sausage and salami using microwave-assisted extraction and dispersive
liquid–liquid microextraction followed by gas chromatography–mass spectrometry. Eur. Food Res. Technol.
2014, 240, 441–450. [CrossRef]
30. Shen, R.; Andrews, S.A. Demonstration of 20 pharmaceuticals and personal care products (PPCPs) as
nitrosamine precursors during chloramine disinfection. Water Res. 2011, 45, 944–952. [CrossRef] [PubMed]
31. Empl, M.T.; Kammeyer, P.; Ulrich, R.; Joseph, J.F.; Parr, M.; Willenberg, I.; Schebb, N.H.; Baumgärtner, W.;
Röhrdanz, E.; Steffen, C.; et al. The influence of chronic l-carnitine supplementation on the formation of
preneoplastic and atherosclerotic lesions in the colon and aorta of male F344 rats. Arch. Toxicol. 2014, 89,
2079–2087. [CrossRef] [PubMed]
32. US Food and Drug Administration. GC/MS Headspace Method for Detection of NDMA in Valsartan
Drug Substance and Drug Products. 2019. Available online: https://www.fda.gov/drugs/drug-safety-and-
availability (accessed on 10 September 2020).
33. Update on Impurities in Metformin Products. Available online: https://www.hsa.gov.sg/announcements/
safety-alert/update-on-impurities-in-metformin-products (accessed on 8 November 2020).
Sample Availability: Samples of the compounds are not available from the authors.
Publisher’s Note: MDPI stays neutral with regard to jurisdictional claims in published maps and institutional
affiliations.
© 2020 by the authors. Licensee MDPI, Basel, Switzerland. This article is an open access
article distributed under the terms and conditions of the Creative Commons Attribution
(CC BY) license (http://creativecommons.org/licenses/by/4.0/).You can also read