Hemodynamic Effects of A Simplified Venturi Conduit for Fontan Circulation: A Pilot, In Silico Analysis - Nature
←
→
Page content transcription
If your browser does not render page correctly, please read the page content below
www.nature.com/scientificreports

            OPEN           Hemodynamic Effects of A
                           Simplified Venturi Conduit for
                           Fontan Circulation: A Pilot, In Silico
                           Analysis
                           Fang Zhu1,3, Guocheng Shi1,3, Chen Wen1, Qian Zhang1, Qihua Fu2, Jinlong Liu1,
                           Zhongqun Zhu1* & Huiwen Chen1*
                           Objectives: To study the effects of a self-powered Fontan circulation in both idealized Fontan models
                           and patient-specific models. Methods: In silico, a conduit with a nozzle was introduced from ascending
                           aorta into the anastomosis of superior vena cava and pulmonary artery. Computational fluid dynamics
                           (CFD) simulation was applied to calculate the fluid fields of models. Three 3-dimentional idealized
                           models with different offsets were reconstructed by computer-aided design to evaluate the effects of
                           the self-powered conduit. Furthermore, to validate the effects in patient-specific models, the conduit
                           was introduced to three reconstructed models with different offsets. Results: The pressures at superior
                           venae cavae and inferior venae cavae were decreased in both idealized models (0.4 mmHg) and patient-
                           specific models (0.7 mmHg). In idealized models, the flows to left lungs were decreased (70%) by the
                           jets from the conduits. However, in patient-specific models, the reductions of blood to the left lungs
                           were relatively limited (30%) comparing to idealized models. Conclusions: CFD simulation was applied
                           to analyze the effectiveness of the Fontan self-powered conduit. This self-powered conduit may help to
                           decrease the venae cavae pressures and increase the flow to pulmonary arteries.

                           The Fontan procedure has evolved over the decades since its first introduction in 19711. Total cavopulmonary
                           connection (TCPC) has been the most widely adopted Fontan procedure, in which an intra-atrial lateral tunnel or
                           an extracardiac conduit is constructed to reroute blood from the inferior vena cava (IVC) to the pulmonary arter-
                           ies2. Despite the accepted early survival rate following the Fontan procedure, bypass of the subpulmonary ventri-
                           cle may inevitably result in long-term complications including protein-losing enteropathy3 and Fontan-associated
                           liver disease4,5 in some survivors, which are partly due to increased systemic venous pressure6.
                               Multiple groups have attempted to provide an adequate preload to optimize the Fontan circulation using
                           biological (contractile properties of the skeletal muscle7, tissue engineering/regenerative medicine devices8)
                           or mechanical assist devices (i.e. the Von Karman impeller pump9, axial flow devices10, and the catheter-based
                           device11). Moreover, though several reports were previously published, in which patients had focused on the use
                           of the Berlin Heart12, the assist devices were large in size and complex in structure. This reflects the great barrier to
                           translating these experimental studies into clinical practice. Thus, pursuit of a desirable, sustainable, and clinically
                           feasible solution to improve late prognosis in the Fontan population is urgently required.
                               Several studies performed computational fluid dynamics (CFD) and aimed to achieve an ideal cavopulmonary
                           connection13,14. A Venturi jet was designed to assist bidirectional Glenn in a previous study, but the increases
                           in pulmonary flow were generally accompanied by increases in superior vena cava (SVC) pressure15,16. Ni and
                           colleagues designed a self-powered Fontan circulation17. However, they did not assess the influence of offsets
                           and different insert positions of the conduit and did not apply the conduit to patient-specific models. Thus, its
                           clinical application requires further investigation. In the present study, we report a feasible and simplified Fontan
                           self-powered conduit based on the Venturi effect and evaluate its role in reducing vena cava pressures and increas-
                           ing pulmonary flow.

                           1
                            Department of Cardiothoracic Surgery, Shanghai Children’s Medical Center, Shanghai Jiao Tong University School of
                           Medicine, Shanghai, China. 2Department of Laboratory Medicine, Shanghai Children’s Medical Center, Shanghai Jiao
                           Tong University School of Medicine, Shanghai, China. 3These authors contributed equally: Fang Zhu and Guocheng
                           Shi. *email: zhuzhongqun@scmc.com.cn; chenhuiwen_scmc@163.com

Scientific Reports |   (2020) 10:817 | https://doi.org/10.1038/s41598-020-57634-2                                                                 1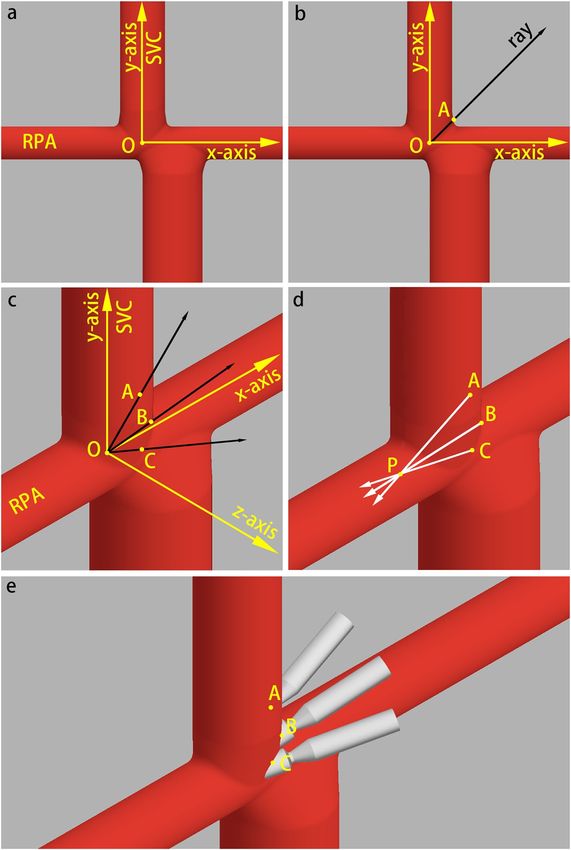
www.nature.com/scientificreports/                                                           www.nature.com/scientificreports

                           Figure 1. The schematic diagram of the assist conduit.

                            Characteristic                         Value
                            Age, y                                 4.64 ± 2.35
                            Male/female, n                         16/12
                            Heart rate at rest, beats per minute   106 ± 14.57
                            Mean arterial pressure, mmHg           65 ± 8
                            Height, cm                             103.71 ± 14.57
                            Weight, kg                             17.16 ± 5.82
                            BSA*, m2                               0.70 ± 0.16

                           Table 1. Patient Characteristics. Continuous variables are presented as mean ± standard deviation. BSA, body
                           surface area.

                           Materials and Methods
                           Ethical approval and informed consent. The Ethics Committee of the Shanghai Children’s Medical
                           Center reviewed and approved this study. All procedures performed in studies involving human participants
                           were in accordance with the ethical standards of the institutional and/or national research committee and with
                           the 1964 Helsinki declaration and its later amendments or comparable ethical standards. Informed consent was
                           obtained from the patients’ parents (patients were under 18 years old).

                           Assist conduit.     According to previous studies15,17, a conduit with a 2-mm nozzle has clinical usability.
                           Therefore, our conduit consists of 3 sections: inflow, constricted, and outflow sections, whose diameters were
                           4 mm, 2 mm, and 4 mm, respectively (Fig. 1).

                           Baseline model.       The extracardiac Fontan post-operative models without assist conduit were set as baseline.
                           Then the assist conduit would be added to the baseline models in silico to build experimental group.

                           Idealized fontan model. To construct an idealized Fontan model, 28 patients who underwent the extra-
                           cardiac Fontan procedure during the second half of 2017 were selected (Table 1). At least one of cardiac com-
                           puted tomography (CT), magnetic resonance imaging (MRI), and catheterization were performed before their
                           discharge. The idealized model was constructed using Autodesk Fusion 360 (Autodesk, San Rafael, CA, US) with
                           average dimensions of the patients (Fig. 2). The diameters of the left pulmonary artery (LPA), right pulmonary
                           artery (RPA), and SVC were 11 mm, 11 mm, and 15 mm, respectively. The diameter of the IVC connection was set
                           to 20 mm18. The different offsets between the SVCs and IVCs were set. The weight and height of all patients were
                           measured to calculate their body surface area.

                           Insert position. According to our clinical experience, the longer the conduit is, the easier it is to bend.
                           Thus, the assist conduit was assumed to introduce the blood from ascending aorta to reduce the risk of bending.
                           Considering the anatomies after the Fontan procedure, we select three insert positions for each Fontan model.
                           The rules for inserting the conduit were formulated as follows:

Scientific Reports |   (2020) 10:817 | https://doi.org/10.1038/s41598-020-57634-2                                                         2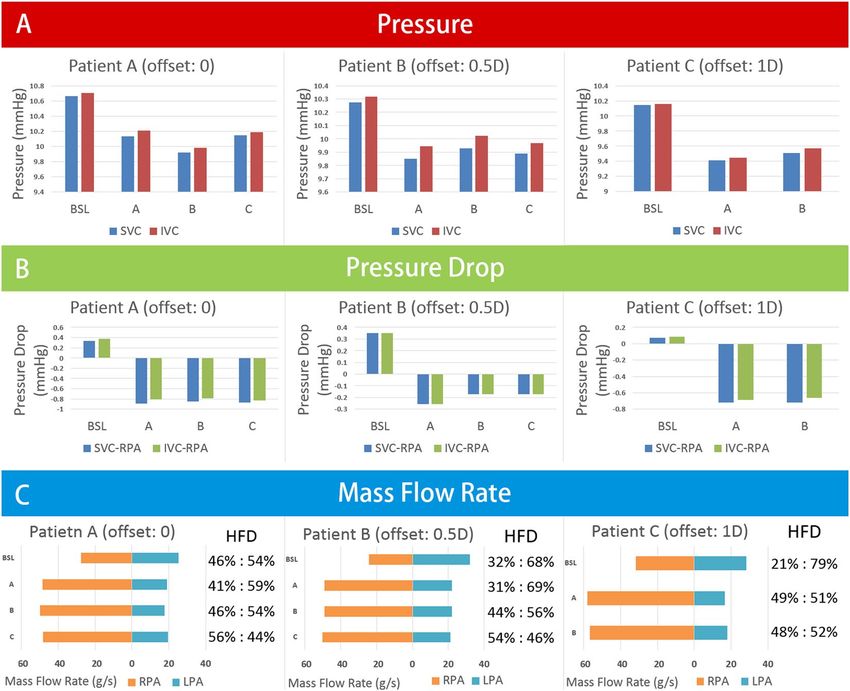
www.nature.com/scientificreports/ www.nature.com/scientificreports
Figure 2. Idealized Fontan Models with different offsets. SVC, superior vane cava; IVC, inferior vena cava; LPA,
left pulmonary artery; RPA, right pulmonary artery; D, diameter of inferior vena cava.
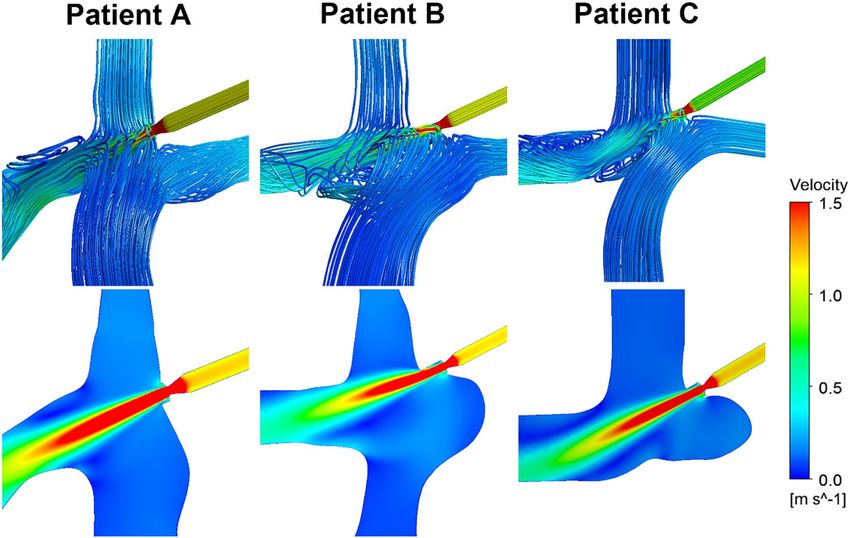
(1) The point of intersection of the centerlines of the RPA and SVC was the origin, which was denoted by the
letter O. The direction along the LPA was the x-axis, the direction along the SVC was the y-axis, and the
direction toward the front was the z-axis (Fig. 3a).
(2) In the x-y plane, a ray was graphed from the origin having a 45° angle with the x- and y-axes. The intersec-
tion of the ray and the wall of the Fontan pathway was set as point A (Fig. 3b).
(3) The ray was rotated 30° toward the positive z-axis. At this time, the intersection of the ray and the wall was
set as point B, and then rotated again to create point C (Fig. 3c).
(4) After setting three insert positions, the self-powered conduits were inserted from each point (A to C) to-
ward point P (midpoint of the entrance of RPA) (Fig. 3d,e). In an idealized situation, 3 baseline models and
9 models with self-powered conduits were constructed.
Patient-specific models. In this computer simulation analysis, we collected the clinical data of three patients
who had underwent the extracardiac Fontan procedure at the age of 5. In the three patients, the offsets between
the SVCs and IVCs were 0, 0.5, and 1 IVC diameters, respectively. The datasets for CFD simulations were col-
lected before their discharge. The three-dimensional (3D) geometries of the Fontan pathway were reconstructed
in Mimics 19.0 (Materialise, Haasrode, Belgium). Then, we used Mimics to draw the centerlines of these models.
All TCPC vessels were cut proximal to the closest branching points. The selection rules of insert positions were
the same as the idealized models, but owing to the specific 3D geometries, not all the insert positions were suitable
for the future operations. Thus, we deleted some insert positions that were impossible to apply intraoperatively.
Fluid domain meshing and computational fluid dynamic solver. All geometries were imported into
ANSYS-ICEM 17.0 (ANSYS Inc., Canonsburg, PA, US) to generate unstructured meshes. All inlets and outlets
were extruded over a sufficient distance to reduce the impact of the uncertainty of the boundary conditions on
the region of interest and to increase the stability of the solver at the outflows19. A tetrahedral mesh was gener-
ated in the central connection area with a base mesh size of 0.6 mm and three boundary-fitted prism layers were
generated at the near-wall regions to improve the resolution of the relevant scales in fluid motion. Mesh density
function in the ANSYS-ICEM was used to increase the density of the grids. Each model grid was refined at the
anastomosis between the conduit and vessel wall. The cell count for each model consisted of approximately 9
million cells.
Scientific Reports | (2020) 10:817 | https://doi.org/10.1038/s41598-020-57634-2 3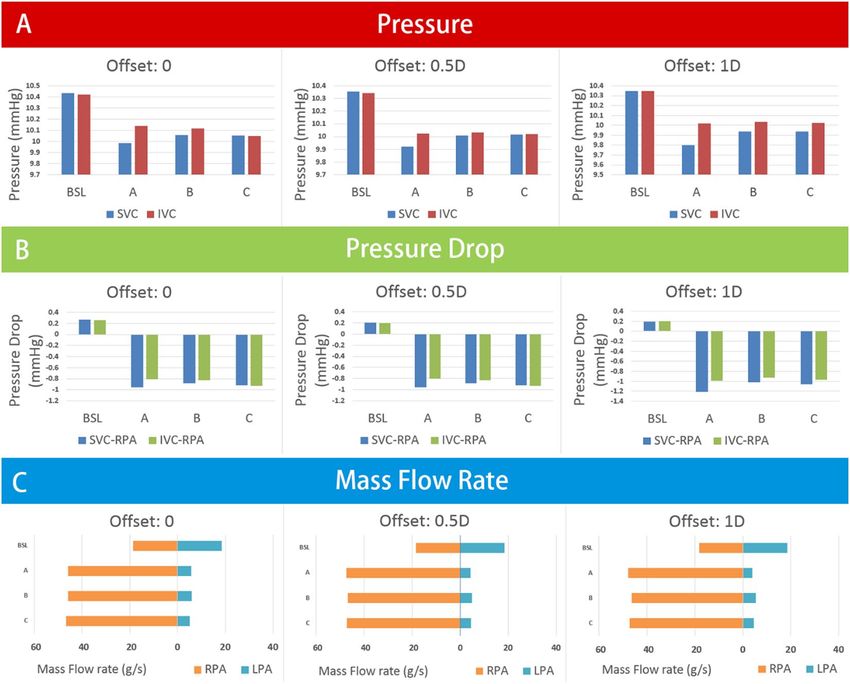
www.nature.com/scientificreports/                                                              www.nature.com/scientificreports

                           Figure 3. Insert positions of the idealized models. (a,b) Are the front views of the model. (c–e) Are the front-
                           right-top view of the model. Point O is the intersection of the centerlines of the RPA and SVC. Point A, B and C
                           are insert positions. Point P is the midpoint of the entrance of RPA. (c) Shows the relationship of point A, B, C
                           and O (∠AOB = ∠BOC = 30°). (d) Shows the insert directions: three insert directions point toward point P. (e)
                           Shows the difference of positions and directions of the three insert points.

                              CFD simulations were performed on Ansys-CFX 17.0. Convergence of simulations was based on the residual
                           mean square (RMS) and the residual target was set as 1 × 10⁻⁵. The conservation target was set as 1 × 10⁻⁴. In
                           idealized models, the flow rates of the venae cavae was 2.1 L/min, which are reasonable estimates of TCPC flow in
                           children20–22. The static pressure at the inlets of the self-powered conduit was mean arterial pressure of patients,
                           while outlets of the extruded LPA and RPA was set as 10 mmHg (1333 Pa). In patient-specific models, the bound-
                           ary conditions of patients were from their clinical data. After induction of general anesthesia, mean SVC pressure,
                           mean IVC pressure, and pulmonary arterial pressures were measured using a catheter inserted via the jugular
                           vein into the pulmonary arteries. Time average flow rates of venae cavae were measured by cardiac MRI. The
                           pressures at the SVC and IVC were measured by the average pressure of their cross sections. The cross sections
                           locate at the closest branching points of each vessels. Pressure drop describes the pressure difference between two

Scientific Reports |   (2020) 10:817 | https://doi.org/10.1038/s41598-020-57634-2                                                            4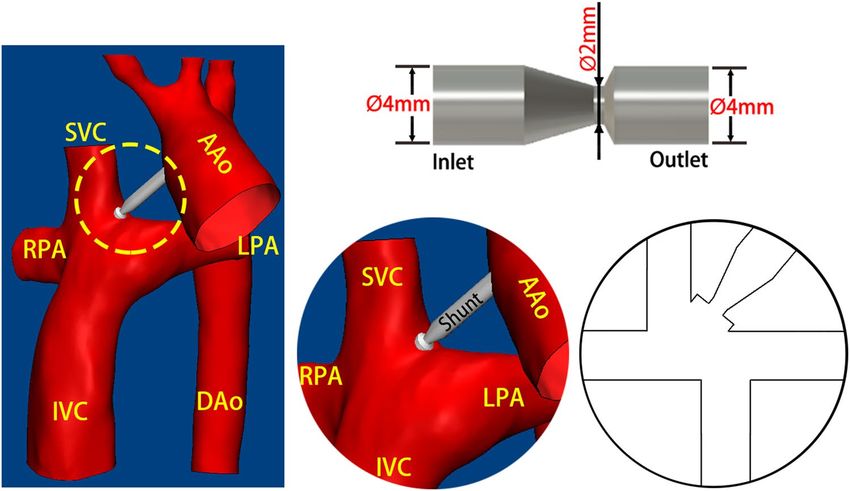
www.nature.com/scientificreports/                                                             www.nature.com/scientificreports

                           Figure 4. Comparing to baseline, the pressures of SVCs and IVCs were lower. Meanwhile, the pressure drops
                           between venae cavae and pulmonary artery turned negative. Section A is the pressures at SVCs and IVCs.
                           Section B is the pressure drops between venae cavae and RPAs. Section C is the mass flow rates at LPAs and
                           RPAs. BSL, baseline; SVC, superior vane cava; IVC, inferior vena cava; LPA, left pulmonary artery; RPA, right
                           pulmonary artery.

                           points. In current study, we used pressure drop to describe changes of the relative pressures between venae cavae
                           and pulmonary arteries. Hepatic flow distribution (HFD) was quantified by examining the percentage of IVC flow
                           entering the LPA and RPA in each patient-specific model.

                           Results
                           Idealized models.        Pressure, pressure drop, and pulmonary flow distribution. The pressures at SVCs and
                           IVCs, the pressure drops between the venae cavae and RPAs, and pulmonary flow rates are shown in Fig. 4. The
                           pressures at the SVCs and IVCs were lower than those at baseline. It was observed that all the conduits inserted
                           from different points could drop the pressures at the SVCs and IVCs by approximately 0.3 mmHg. However, the
                           degrees of reductions were different, and the optimal effect of decreasing the pressure at the SVCs was the conduit
                           from point A. Moreover, the pressure drops between the venae cavae and pulmonary arteries became negative
                           (changed from 0.2 mmHg (baseline) to −0.9 mmHg (experimental group)) after adding the conduits.
                              The pulmonary flow distribution data of the pulmonary arteries are shown in Fig. 4C. Because all the outlet
                           directions of the conduits were pointed to the midpoints of RPA entrances, the mass flow rates of the RPAs were
                           increased. Meanwhile, the Venturi effect also influenced the mass flow rates of the LPAs. Comparing to baseline
                           models, the mass flow rate of LPAs in experimental group decreased to approximately 35%.

                           Patient-specific models. The geometries of patient-specific models. The geometries of the patient-specific
                           models are shown in Fig. 5. All the angles between the IVCs and LPAs were obtuse 117°, 119°, and 128°,
                           respectively.

                           Pressure, pressure drop, and pulmonary flow distribution. Generally, in all patient-specific models, the conduits
                           could drop approximately 0.5 mmHg at the venae cavae (Fig. 6A). The pressure drops between the venae cavae
                           and RPAs in three patients were approximately −0.75 mmHg (Fig. 6B). The pulmonary flow distribution data of
                           the RPAs increased by approximately 20 ml/s, while flow reduction of the LPAs was relatively limited (Fig. 6C).
                           The jet from the conduit significantly changed the flow pattern around it (Fig. 7). The jet had a higher momentum
                           compared to the surrounding blood, and the surrounding blood was carried along with the jet in this process.

Scientific Reports |   (2020) 10:817 | https://doi.org/10.1038/s41598-020-57634-2                                                           5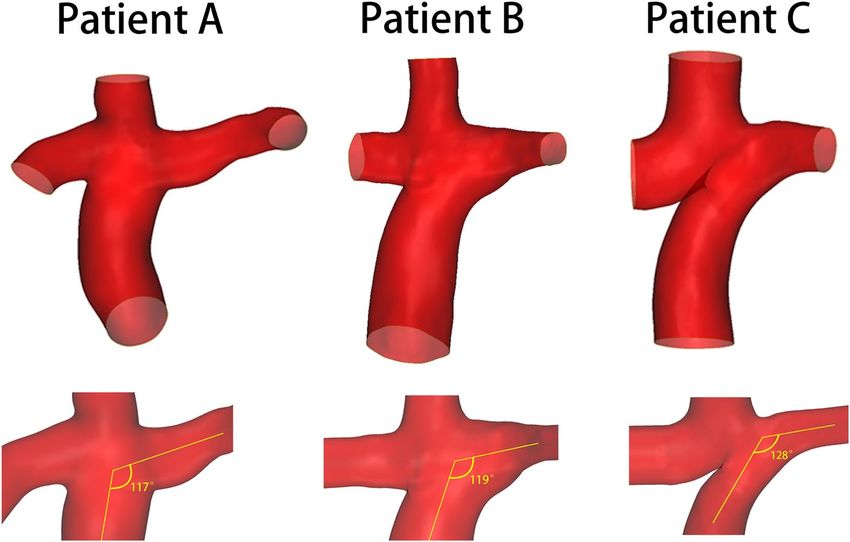
www.nature.com/scientificreports/                                                           www.nature.com/scientificreports

                           Figure 5. The full-range anatomic reconstruction and the angles between IVCs and LPAs of three extracardiac
                           Fontan patients. The angles between IVCs and LPAs in patient-specific models. Patient A: 117°. Patient B: 119°.
                           Patient C: 128°.

                           Figure 6. Section A is the pressures at SVCs and IVCs. Section B is the pressure drops between venae cavae and
                           RPAs. Section C is the mass flow rates at LPAs and RPAs. BSL, baseline; SVC, superior vane cava; IVC, inferior
                           vena cava; LPA, left pulmonary artery; RPA, right pulmonary artery; HFD, hepatic flow distribution.

Scientific Reports |   (2020) 10:817 | https://doi.org/10.1038/s41598-020-57634-2                                                        6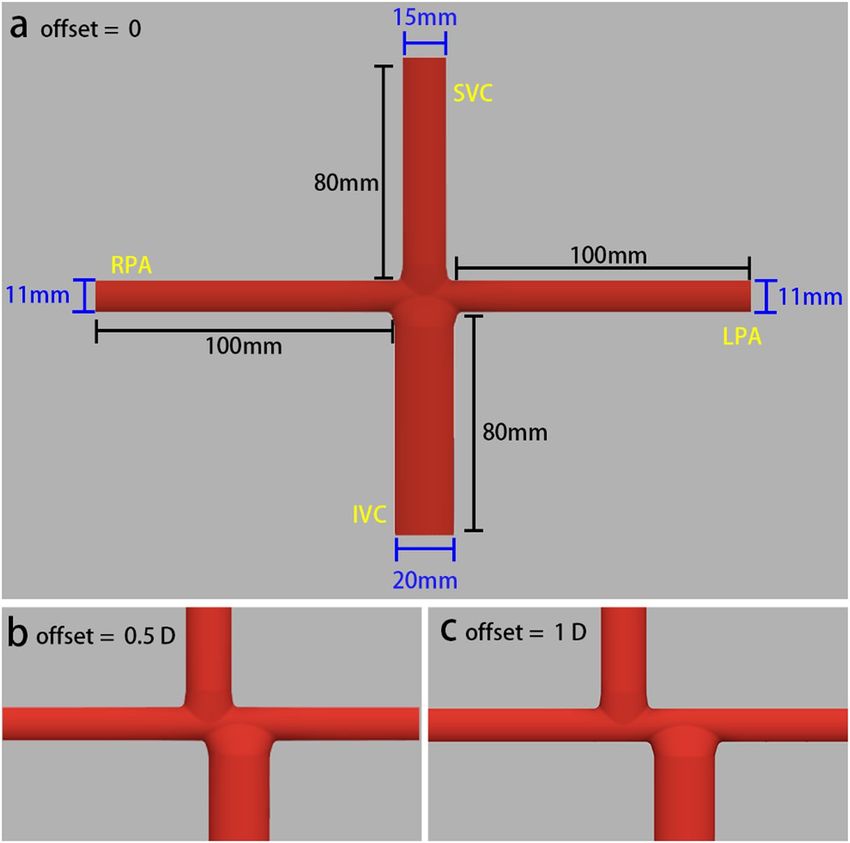
www.nature.com/scientificreports/                                                               www.nature.com/scientificreports

                           Figure 7. This figure shows the optimal results of three patients with the conduit.

                              In patient A, the conduits inserted from three points could decrease 0.49~0.74 mmHg. In the case of insertion
                           point B, a good result is that the pressure of the vena cava is reduced by 0.7 mmHg, and the effect on the LPA
                           blood flow is relatively limited. The HFD of patient A was slightly changed in self-powered models.
                              In patients B and C, the offsets of these two patients were 0.5 D and 1 D, respectively, which accounts for the
                           majority of clinical Fontan patients. In these two patients, the effects of the conduits were consistent and the pres-
                           sure drops between the SVCs and RPAs were approximately 0.7–0.85 mmHg. Moreover, the effects of the conduits
                           on the blood flows to the LPAs were also limited, which were different from the idealized models. The baseline
                           HFDs of patient B (LPA:RPA = 32%:68%) and patient C (LPA:RPA = 21%:79%) were imbalance, but after adding
                           the self-powered conduit, HFD were balanced (patient B, LPA:RPA = 54%:46%; patient C, LPA:RPA = 49%:51%).

                           Discussion
                           In this study, we designed a conduit to provide a self-powered circulation in extracardiac Fontan, which may help
                           to alleviate the chronic elevation in systemic venous pressure following the Fontan procedure. We performed
                           CFD analysis to evaluate different insert position of the shunt graft and calculate the fluid fields under physiologi-
                           cal conditions to determine the optimal position. The features of this study include the following: (1) extracardiac
                           Fontan with different offsets were included; (2) different insert positions were simulated; (3) the conduit could
                           provide kinetic energy for the circulation, reducing the pressure of the venae cavae, which could increase the
                           flow of pulmonary arteries without increasing pressures at the venae cavae; (4) both the spatial structures and
                           feasibility of inserting a single conduit were taken into account, which makes the self-powered Fontan procedure
                           applicable in clinical practice.
                               The decreased pressure in the venae cavae can vary from 0.3 mmHg to 0.8 mmHg according to different mod-
                           els. Given that the original pressure differences exist between the venae cavae and pulmonary arteries, the conduit
                           can provide sufficient energy for the venous blood despite the limited reduction in pressure. Jet from the conduit
                           significantly changed the flow pattern around it (Fig. 7). The jet had higher momentum compared to surrounding
                           blood, and the surrounding blood was carried along with the jet in this process. It not only improved the kinetic
                           energy for the blood but also formed a subpulmonary ventricle function, which meant that pressures at the venae
                           cavae were lower than those of the pulmonary arteries.
                               An analysis of the results from idealized and patient-specific models shows that there are different influences
                           on LPA flows by the conduits. In idealized models, resulting from the Venturi effect from the conduits, LPA
                           flows were obviously decreased in some models. This is considered an unsatisfactory condition, because une-
                           ven distribution of blood from the IVC may cause pulmonary arteriovenous malformations23,24. However, in
                           patient-specific models, there is relatively less influence on the LPA flows caused by the conduits, which may be
                           due to patients’ individualized anatomical morphology. The angles of IVCs and LPAs in idealized models are 90°,
                           whereas those in patient-specific models are larger than 90° (Fig. 5). In most of the Fontan patients, the angles
                           were obtuse, because the artificial tunnels need to cling to the right atriums and then connect to the pulmonary
                           arteries. Thus, blood from the IVC is likely to flow into the LPA, which is also associated with reduced energy loss
                           in the TCPC6. Furthermore, there exists energy loss in the regions between the venae cavae, which may result in
                           less blood from the IVC flowing into the RPA6; nevertheless, the conduit could generate an additional force to
                           assist blood flow into the pulmonary circuit.
                               This inserted conduit could introduce pulsatile flow into pulmonary arteries, which helps to maintain the
                           expression of endothelial nitric oxide synthase25. Moreover, such pulsatile blood flow has an advantage in

Scientific Reports |   (2020) 10:817 | https://doi.org/10.1038/s41598-020-57634-2                                                              7
www.nature.com/scientificreports/ www.nature.com/scientificreports
maintaining endothelial function and preventing steady flow-induced pulmonary hypertension. Lack of pulsa-
tile flow will result in elevation of pulmonary artery pressure, pulmonary vascular resistance26,27, and decreased
endothelial-dependent vasorelaxation response of the pulmonary arteries25, which has a pernicious effect on
Fontan circulation. Although the mass flow rate of RPA was significantly increased in this study, pressure of the
venae cavae would not reach the criterion of pulmonary hypertension even if pulmonary vascular resistance was
relatively high16,17.
While there are several publications quantifying outcomes use similar device to improve single ventricular
circulation, these studies have had inappropriate insert positions16 or ignored the clinical feasibility17. Mahdi and
colleagues used a Venturi jet to assist bidirectional Glenn in a previous study, but the increases in pulmonary flow
were generally accompanied by increases in superior vena cava (SVC) pressure16. The conduit in that study was
connected to SVC rather than the anastomosis of SVC and RPA, which result in increasing pressure of SVC. Ni
and colleagues designed a self-powered Fontan circulation17. However, the nozzles were extended into pulmonary
arteries without supporting structures, where displacement would occur. And they did not assess the influence
of offsets and different insert positions of the conduit and did not apply the conduit to patient-specific models.
Our study selected another connection area and assessed effects of different positions. Although our design is
a shunt pointing to RPA, this structure is a clinically feasible structure and 4 mm diameter conduit is easy for
anastomosing.
In this 3D model study, we mainly focused on hemodynamic phenomena in local vascular regions. However,
3D model cannot sufficiently account for the influence of the downstream vascular systems. Meanwhile, the
hemodynamic performance of Fontan circulation is influenced by cardiovascular properties, such as pulmonary
vascular resistance and left ventricular function28. But most clinical measurement cannot provide parameters of
cardiac function and loading conditions. Liang and colleagues provide a method of patient-specific assessment
to overcome these difficulties29. Therefore, patient-specific multiscale modeling of Fontan circulation could pro-
vide global hemodynamic profile. In our further study, Fontan patient-specific 3D models will be coupled with a
reduced-dimensional model to address the interaction between local and global hemodynamics.
The most notable challenge for the application of the conduit is the prevention of thromboembolism. In this
study, we considered blood as a homogeneous fluid, with fixed values for density and dynamic viscosity, and
the destruction of blood cells was not considered. Disturbed flows occur in the regions of RPAs near the IVCs
in both idealized models and patient-specific models, which may be caused by the rapid blood flow near these
areas (Fig. 7). Furthermore, at the location where the conduit narrows, shear stress of the blood fluid signifi-
cantly increased with velocity. Hellums and colleagues found that platelets experiencing a shear accumulation
of > 3.5 Pa·s will undergo activation with subsequent release of prothrombotic messengers30. Therefore, throm-
boembolic events may be the greatest challenge for application of this pipeline in vivo. The use of aggressive anti-
coagulation measures and biocompatible materials could reduce the risk of thromboembolic events. To say the
least, the circulation could still maintain a normal Fontan circulation irrespective of thrombosis occurring within
the inserted conduit. Clinical application of this conduit-assisted Fontan requires further technical refinements
and investigations (i.e. experimental study in animal models); however, it provides an alternative clinically fea-
sible solution to help the subset of survivors overcome the unavoidable sequelae of Fontan circulation and have
improved quality of life and longevity.
Limitations. The small sample size in this study is one of the limitations; more patient-specific models are
needed to verify the results. Another limitation is that steady inflow rates were imposed on the inlets, which
means that the effects of respiration and exercise were not included. Moreover, outflow boundary conditions were
imposed at the outlets in the CFD models, modeling the immediate perioperative status in the TCPC, and not
the longer-term adaptation of the single ventricle physiology using resistances or lumped parameter networks
in the boundary conditions. Finally, we assumed that the vessel walls were rigid and impermeable, with no-slip
boundary conditions. A fluid-structure-interaction analysis is required in future studies.
Conclusion
Using CFD simulation, we analyzed the effectiveness of a Fontan self-powered conduit. This conduit is a feasible,
economical, and effective solution that could decrease vena cava pressures and increase the flow to the pulmonary
arteries.
Received: 29 September 2019; Accepted: 31 December 2019;
Published: xx xx xxxx
References
1. Fontan, F. & Baudet, E. Surgical repair of tricuspid atresia. Thorax 26, 240–248 (1971).
2. d’Udekem, Y. et al. The Fontan procedure: contemporary techniques have improved long-term outcomes. Circulation 116, I157–164,
https://doi.org/10.1161/CIRCULATIONAHA.106.676445 (2007).
3. Atz, A. M. et al. Longitudinal Outcomes of Patients With Single Ventricle After the Fontan Procedure. J. Am Coll Cardiol. 69,
2735–2744, https://doi.org/10.1016/j.jacc.2017.03.582 (2017).
4. Goldberg, D. J. et al. Hepatic Fibrosis Is Universal Following Fontan Operation, and Severity is Associated With Time From Surgery:
A Liver Biopsy and Hemodynamic Study. J Am Heart Assoc 6, https://doi.org/10.1161/JAHA.116.004809 (2017).
5. Daniels, C. J. et al. Fontan-Associated Liver Disease: Proceedings from the American College of Cardiology Stakeholders Meeting,
October 1 to 2, 2015, Washington DC. J. Am. Coll. Cardiol. 70, 3173–3194, https://doi.org/10.1016/j.jacc.2017.10.045 (2017).
6. Rijnberg, F. M. et al. Energetics of Blood Flow in Cardiovascular Disease: Concept and Clinical Implications of Adverse Energetics
in Patients With a Fontan. Circulation. Circulation 137, 2393–2407, https://doi.org/10.1161/circulationaha.117.033359 (2018).
7. Laohachai, K. et al. Inspiratory Muscle Training Is Associated With Improved Inspiratory Muscle Strength, Resting Cardiac Output,
and the Ventilatory Efficiency of Exercise in Patients With a Fontan Circulation. J. Am Heart Assoc 6, https://doi.org/10.1161/
JAHA.117.005750 (2017).
Scientific Reports | (2020) 10:817 | https://doi.org/10.1038/s41598-020-57634-2 8www.nature.com/scientificreports/ www.nature.com/scientificreports
8. Biermann, D. et al. Towards a Tissue-Engineered Contractile Fontan-Conduit: The Fate of Cardiac Myocytes in the Subpulmonary
Circulation. PLoS one 11, e0166963, https://doi.org/10.1371/journal.pone.0166963 (2016).
9. Rodefeld, M. D. et al. Cavopulmonary assist for the univentricular Fontan circulation: von Karman viscous impeller pump. J. Thorac.
cardiovascular Surg. 140, 529–536, https://doi.org/10.1016/j.jtcvs.2010.04.037 (2010).
10. Throckmorton, A. L. et al. Uniquely shaped cardiovascular stents enhance the pressure generation of intravascular blood pumps. J.
Thorac. cardiovascular Surg. 144, 704–709, https://doi.org/10.1016/j.jtcvs.2011.12.061 (2012).
11. Zhu, J. et al. Cavopulmonary support with a microaxial pump for the failing Fontan physiology. ASAIO J. 61, 49–54, https://doi.
org/10.1097/MAT.0000000000000162 (2015).
12. Carlo, W. F., Villa, C. R., Lal, A. K. & Morales, D. L. Ventricular assist device use in single ventricle congenital heart disease. Pediatr
Transplant 21, https://doi.org/10.1111/petr.13031 (2017).
13. Yang, W. et al. Hepatic blood flow distribution and performance in conventional and novel Y-graft Fontan geometries: a case series
computational fluid dynamics study. J. Thorac. cardiovascular Surg. 143, 1086–1097, https://doi.org/10.1016/j.jtcvs.2011.06.042
(2012).
14. Restrepo, M. et al. Surgical planning of the total cavopulmonary connection: robustness analysis. Ann. Biomed. Eng. 43, 1321–1334,
https://doi.org/10.1007/s10439-014-1149-7 (2015).
15. Verma, A. et al. Optimization of the Assisted Bidirectional Glenn Procedure for First Stage Single Ventricle Repair. World J. Pediatr.
Congenit. Heart Surg. 9, 157–170, https://doi.org/10.1177/2150135117745026 (2018).
16. Esmaily-Moghadam, M., Hsia, T. Y., Marsden, A. L. & Modeling of Congenital Hearts Alliance, I. The assisted bidirectional Glenn:
a novel surgical approach for first-stage single-ventricle heart palliation. J. Thorac. cardiovascular Surg. 149, 699–705, https://doi.
org/10.1016/j.jtcvs.2014.10.035 (2015).
17. Ni, M. W. et al. Computational Investigation of a Self-Powered Fontan Circulation. Cardiovasc. Eng. Technol. 9, 202–216, https://doi.
org/10.1007/s13239-018-0342-5 (2018).
18. Chen, H. et al. Extracardiac Fontan with direct cavopulmonary connections: midterm results. Eur. J. cardio-thoracic surgery: Off. J.
Eur. Assoc. Cardio-thoracic Surg. 43, 318–323, https://doi.org/10.1093/ejcts/ezs288 (2013).
19. Liu, Y., Pekkan, K., Jones, S. C. & Yoganathan, A. P. The effects of different mesh generation methods on computational fluid
dynamic analysis and power loss assessment in total cavopulmonary connection. J. Biomech. Eng. 126, 594–603 (2004).
20. Rosenthal, M., Bush, A., Deanfield, J. & Redington, A. Comparison of cardiopulmonary adaptation during exercise in children after
the atriopulmonary and total cavopulmonary connection Fontan procedures. Circulation 91, 372–378 (1995).
21. Pedersen, E. M. et al. Flow during exercise in the total cavopulmonary connection measured by magnetic resonance velocity
mapping. Heart 87, 554–558 (2002).
22. Whitehead, K. K. et al. Blood flow distribution in a large series of patients having the Fontan operation: a cardiac magnetic resonance
velocity mapping study. J. Thorac. cardiovascular Surg. 138, 96–102, https://doi.org/10.1016/j.jtcvs.2008.11.062 (2009).
23. d’Udekem, Y. et al. Redefining expectations of long-term survival after the Fontan procedure: twenty-five years of follow-up from
the entire population of Australia and New Z ealand. Circulation 130, S32–38, https://doi.org/10.1161/
CIRCULATIONAHA.113.007764 (2014).
24. Dasi, L. P. et al. Pulmonary hepatic flow distribution in total cavopulmonary connections: extracardiac versus intracardiac. J. Thorac.
cardiovascular Surg. 141, 207–214, https://doi.org/10.1016/j.jtcvs.2010.06.009 (2011).
25. Henaine, R. et al. Effects of lack of pulsatility on pulmonary endothelial function in the Fontan circulation. J. Thorac. cardiovascular
Surg. 146, 522–529, https://doi.org/10.1016/j.jtcvs.2012.11.031 (2013).
26. Raj, J. U., Kaapa, P. & Anderson, J. Effect of pulsatile flow on microvascular resistance in adult rabbit lungs. J. Appl. Physiol. (Bethesda,
Md.: 1985) 72, 73–81, https://doi.org/10.1152/jappl.1992.72.1.73 (1992).
27. Taguchi, S., Yozu, R., Iseki, H., Soma, Y. & Inoue, T. Effects of nonpulsatile and pulsatile right ventricular bypass on pulmonary
circulation. ASAIO Trans. 34, 213–221 (1988).
28. Liang, F. et al. Hemodynamic performance of the Fontan circulation compared with a normal biventricular circulation: a
computational model study. Am. J. Physiol. Heart Circ. Physiol 307, H1056–1072, https://doi.org/10.1152/ajpheart.00245.2014
(2014).
29. Liang, F., Sughimoto, K., Matsuo, K., Liu, H. & Takagi, S. Patient-specific assessment of cardiovascular function by combination of
clinical data and computational model with applications to patients undergoing Fontan operation. Int. J. Numer. Method. Biomed.
Eng. 30, 1000–1018, https://doi.org/10.1002/cnm.2641 (2014).
30. Suess, T. et al. Shear accumulation as a means for evaluating risk of thromboembolic events in novel endovascular stent graft designs.
J. Vasc. Surg. 65, 1813–1819, https://doi.org/10.1016/j.jvs.2016.07.108 (2017).
Acknowledgements
This work was supported by Shanghai Municipal Commission of Health and Family Planning [20134026,
2017BR049], Shanghai Science and Technology Commission [16411962700], National Natural Science
Foundation of China [81670464], Shanghai Jiao Tong University [ZH2018ZDA24] and Shanghai Jiao Tong
University School of Medicine [20172027].
Author contributions
F.Z., J.L. and H.C. designed the experiments described in this study; F.Z., G.S. and Q.Z. established 3D geometries
of the models; F.Z. and C.W. executed computational fluid dynamics calculation; Q.F. provided image data; F.Z.
wrote the manuscript; Z.Z. and H.C. edited manuscript drafts.
Competing interests
The authors declare no competing interests.
Additional information
Correspondence and requests for materials should be addressed to Z.Z. or H.C.
Reprints and permissions information is available at www.nature.com/reprints.
Publisher’s note Springer Nature remains neutral with regard to jurisdictional claims in published maps and
institutional affiliations.
Scientific Reports | (2020) 10:817 | https://doi.org/10.1038/s41598-020-57634-2 9www.nature.com/scientificreports/ www.nature.com/scientificreports
Open Access This article is licensed under a Creative Commons Attribution 4.0 International
License, which permits use, sharing, adaptation, distribution and reproduction in any medium or
format, as long as you give appropriate credit to the original author(s) and the source, provide a link to the Cre-
ative Commons license, and indicate if changes were made. The images or other third party material in this
article are included in the article’s Creative Commons license, unless indicated otherwise in a credit line to the
material. If material is not included in the article’s Creative Commons license and your intended use is not per-
mitted by statutory regulation or exceeds the permitted use, you will need to obtain permission directly from the
copyright holder. To view a copy of this license, visit http://creativecommons.org/licenses/by/4.0/.
© The Author(s) 2020
Scientific Reports | (2020) 10:817 | https://doi.org/10.1038/s41598-020-57634-2 10You can also read