Red tide development modeling in Persian Gulf and study nutrient effects on algal bloom
←
→
Page content transcription
If your browser does not render page correctly, please read the page content below
Research in Marine Sciences
                                                                                                      289
Volume 3, Issue 2, 2018
Pages 289 -302

                 Red tide development modeling in Persian Gulf
                   and study nutrient effects on algal bloom

                              Madjid Abbaspour1, and Elahe Zohdi 2,*
                       1
                        Professor, Sharif University of Technology, Tehran, Iran
            2
             MSc of shipping engineering, Sharif University of Technology, Tehran, Iran

                    Received: 2018-02-22                      Accepted: 2018-05-10

Abstract

Red tide or algal bloom occurs in estuarine, marine, or fresh water due to accumulating algae rapidly
in water column and results in water coloration in high concentration and widespread serious effects
on public health, fishing, and even tourism industry. Persian Gulf despite rich reserves of oil and
gas, military strategic location, rich resources and valuable diverse aquatic habitats like coral reefs
has been recently confronted with this phenomenon due to human, industrial and agricultural waste,
oil exploration, permanent ships’ traffic and shallow water, geographical and climate conditions and
limited water exchange with external environment. Due to recent broad steady development of red
tides that have irreparable effects on the ecosystem, economic conditions, and public health of the
coastal residents, society’s need for understanding is more pressing than ever. Among the investigation
methods, numerical modeling has great importance due to low time and cost. MIKE software is used
in this paper, considering physical, chemical and hydrodynamics factors in a zone and biological
aspects of this phenomenon and temperature, salinity and nutrient effects on red tide growth. In fact
predicting HABs’ occurrence minimizes their damage by quick preparation of mitigation activity
and prevents economic losses in aquaculture industry, desalination equipment, and also respiratory
and skin irritation problems for swimmers. In this paper, the effects of pollution outflows and
hydrodynamic currents of Persian Gulf on red tide development in 2008-2009 period and variation
of dissolved oxygen amount to chlorophyll-A was simulated and studied by utilizing MIEK21 and
ECOLAB modules. The simulation results showed that the red tide development direction was
according to the Persian Gulf mainstream direction. In addition, chlorophyll-A concentration was
higher near the sewage outflows and persistent in those areas at all times till nutrients present there. In
addition, by increasing chlorophyll-A concentration, the dissolved oxygen concentration increased.

Keywords: Algal bloom; Chlorophyll-A; HABs; MIKE software; Red tide.

* Corresponding Author: ela.zohdi@alum.sharif.edu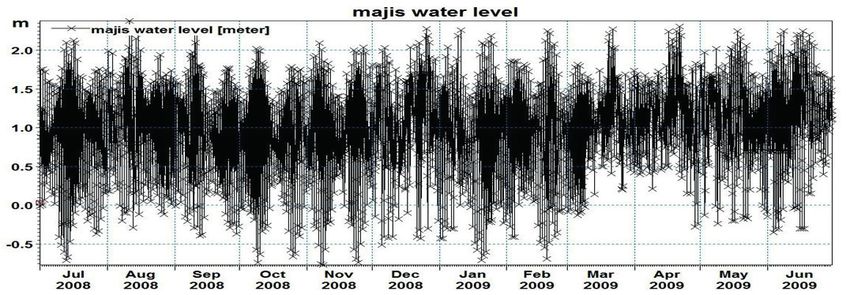
290 Red tide development modeling in Persian Gulf and... / 289 - 302

1. Introduction                                           toxic species have all increased. Indeed, there
                                                          is a conviction among many experts about
Land sourced marine pollution, overexploitation           expanding. Is this expansion real? Is it a global
of living marine resources, destruction of                epidemic? Is it related to human activities? Or is
habitat and introduction of harmful aquatic               it a result of increased scientific awareness and
organisms and pathogens to new environment                improved surveillance or analytical capabilities?
had been identified as the four greatest threats          (Anderson, 1994; Wikipedia, 2014) Of 5000+
to the world’s oceans. Since invasive species             microscopic algae species or phytoplankton
cannot be cleaned or absorbed in the ocean, so,           exist worldwide, about 300 species can cause
their effects on the environment are irreversible.        high concentration of red tides. Only one
Red tide is one of the invasive species and a             fourth of this amount is known to be harmful
colloquial term used to refer to one of a variety         or toxic which include dinoflagellates, diatoms,
of natural phenomena known as algal bloom,                haptophyceae, cyanophyceaes, and some of
in which estuarine, marine, or fresh water algae          cycloflagellate. Studies indicate the presence of
accumulate rapidly in the water column and                21 bloom-former species, are potentially toxic,
resulting in coloration of the surface water,             in Persian Gulf (Malaei Tavana et al., 2008;
varying in color from purple to almost pink,              Wikipedia, 2014). Damage caused by red tides
normally being red or green. These algae are not          is divided into two categories direct poisoning
native to special area, in other word; they have          (death of marine animals, human poisoning,
various species with broad ranges. The first case         respiratory and skin irritation due to producing
of red tide occurred in 1793, British Columbia,           strong toxins like neurotoxin) and indirect
Canada (Mohammadi, 2008; Wikipedia, 2014).                poisoning (marine mortalities by depleting
Whether harmful or harmless kinds of red tide             the oxygen in the water, human poisoning by
has been reported from all over the world such            eating shellfishes contaminated with red tide
as Brazil, Korea, China, Japan, Chile, Canada,            toxin through feeding). A bloom develops
UK, France, Hong Kong, India, the countries               when these single-celled algae photosynthesize
of the Black Sea and the Mediterranean sea and            and multiply; converting dissolved nutrients
recently the Persian Gulf and the Caspian Sea             and sunlight into plant biomass and the
(Malaei Tavana et al., 2008; Seddigh Marvasti,            population of grazing zooplankton and aquatic
2016). Blooms and their environmental                     species is small. It seems that their population
effects in an aquatic ecosystem depend on the             is not affected only by their growth rate, but
species involved, biological and ecological               also wind or ocean currents bring them to the
characteristics of the species, the scale of this         water surface (Anderson, 1994; Malaei Tavana
phenomenon, hydrological and topographical                et al., 2008; Vahedi, 2009). The dominant
status of environment where they are found                mode of reproduction is simple asexual fission.
(Bahrami Rad, 2013). According to scientists              When nutrients are scarce, some species switch
finding, the number of toxic blooms, the scale,           to sexual reproduction, form cysts, and this
and complexity of this natural phenomenon,                transformation facilitates species dispersal
the economic losses from them, the types of               along with currents or the other forces to new
resources affected and the kinds of toxins and            environments. Different phytoplankton species
Research in Marine Sciences 291

have different growth rate. Measures taken           sparse observations. To watch red tides, there
pursuant to which the average daily growth rate      are different methods: field observation and
of dinoflagellates is almost 0.3 per day with a      using sampling data, satellite-based studies,
three-day period for regeneration. Diatoms have      laboratory studies, modeling like complex
a daily growth rate more than dinoflagellates;       numerical models, conceptual models, simple
40% of them have regeneration period less            analytic formulae, semi-empirical models,
than three days (Anderson, 1994; Malaei              aggregated box models or zero-dimensional
Tavana et al., 2008; Taghavi and Abbaspour,          models (McGillicuddy, 2010; Park et al., 2013;
2012). Two major contributing factors in the         Seddigh Marvasti, 2016).
growth of phytoplankton are temperature and
                                                     1.1. Red Tide Occurrence in Persian Gulf
nutrients, especially phosphorus and nitrogen
(Wikipedia, 2014). Some of the studies, such as      Persian Gulf despite rich reserves of oil and gas,
Vollenweider (1992), Hodgkiss and Ho (1997),         military and strategic location, rich resources
Peinert et al. (1982), Glibert et al. (2010),        and important and valuable diverse aquatic
showed eutrophication is a major contributor         habitats such as coral reefs, due to sewage and
to HABs development in their growth period           human waste, oil exploration and extraction
(Wong et al., 2007; McGillicuddy, 2010;              operations, permanent ships’ traffic, massive
Sadeghi Mazidi et al., 2011). Long-term              military operations and wars for several years,
studies at the local or regional level do show       industrial and agricultural waste which led
that red tides are increasing as coastal pollution   to the entry of organic materials like NO3,
worsens. Between 1976 and 1986, as the               NH4, PO4 and the other nutrients to this zone,
pollution around Tolo Harbor in Hong Kong            and shallow water, geographical and climate
grew six fold, red tides increased eightfold         conditions and limited water exchange with the
(Anderson, 1994; Malaei Tavana et al., 2008).        external environment, has been confronted with
According to recent wide spread and persistent       numerous hazards. Therefore the probability of
HABs effects, society’s need for understanding       the presence of non-native species or increasing
these phenomena is more pressing than ever.          nitrification phenomenon in this area is not far-
Technological advances have expanded our             fetched. The red tide occurrence is one of the
capabilities for observing the ocean, providing      major environmental issues raised in Persian
unprecedented opportunities not only for the         Gulf in recent years (Taghavi and Abbaspour,
detection of blooms, but also for the physical,      2012; Ebrahimi, 2015). Related to the red tide
chemical, and biological factors that trigger        occurrence, according to statistics of the Iranian
their initiation, development, and ultimate          Fisheries Science Research Institute, in short,
demise. However, despite these rapidly               from 1991 to 1997, close to 30 algal blooms
expanding observational capabilities, HAB            in the Persian Gulf and Oman Sea waters are
processes will continue to be under sampled          recorded but they are short-term, about 48
for the foreseeable future, owing to the wide        hours (Rezaee and Kabiri, 2009; Shakerzadeh
range of space and time scales relevant to these     et al., 2009). Among the identified algae in this
oceanographic phenomena. As such, we must            area, about 12 species can cause red tide bloom
rely on models to help interpret our necessarily     which the eight species of them, mentioned in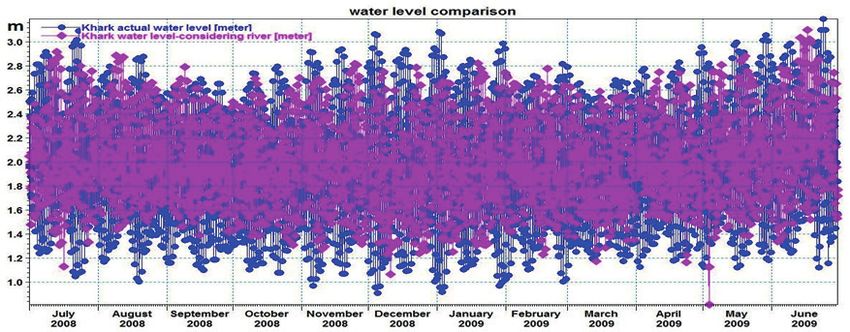
292 Red tide development modeling in Persian Gulf and... / 289 - 302
Figure 1. The dominant species of red tide phenomenon in the Persian Gulf (Taghavi and Abbaspour, 2012)
the following, have further spread (Taghavi and occurrence. Natural environmental conditions
The most extensive
Abbaspour, 2012). red tide bloom in the Persian Gulf happened
during fromfor
the bloom end-August
this type ofto algae,
Marchsalinity
2008
The most
which wasextensive
caused red by tide Persian is from
bloom in thePolykricoides
Cochlodinium between the 25 to 30 ppt and
dinoflagellate water temperature
category From late
Gulf happened
September from end-August
to December 2008, red tide to was
March is between
observed in an area32of to 34 ºCkilometers
several considering fromthat
Sirikthe
2008 which was caused by Cochlodinium proper temperature range for the growth of
port in Oman Sea to Bushehr at the center line of Persian Gulf which was covered approximately
Polykricoides from the dinoflagellate category phytoplankton in the Persian Gulf is in fall and
750 km
From lateof coastline to
September (Rezaee
December and 2008,
Kabiri,red 2009).
tide Restriction
winter, the which stop growing
phenomenon and blooming
occurrences wasinin
was observed
the Oman Seainmainly
an area wasof the
several
lack kilometers that period
of nutrients. Since (Manshouri
in the north and Tabiee
of the Strait of Hormuz, Yeganeh,
the
from Sirik cities
industrial port inlikeOman Sea to
Bandar Bushehr
Abbas and at 2009;andMohammadi
the exist
Qeshm Tahroodi
due to the defects in the et urban
al., 2013;
and
center line of Persian Gulf which was covered Seddigh Marvasti, 2016). According to the
industrial wastewater system, the amount of organic materials in coastal waters is high during the
approximately 750 km of coastline (Rezaee and sampling values by Persian Gulf and Oman
whole of
Kabiri, the year,
2009). and almost
Restriction which algal
stopdensity
growingwas verySeahigh all of theResearch
Ecological 9-month Institute,
period in parameters
this area.
and blooming
In other areas,inthe thealgal
Oman Sea mainly
density reducedwas andthe variations
increased at the
periodically timethese
which of blooming
enhancement wereandin
lack of nutrients.
reduction Since ininthe
were obvious thenorth of theand
northern Strait the regions
southern followingof therange:
Omansalinity (37-39.2
Sea (Hamzei, ppt),
2012).
of Hormuz, the industrial cities like Bandar temperature (20.4-33.9 ºC), PH (7.96-8.6),
Cochlodinium, dinoflagellate with yellowish to brownish green pigment, was able to produce
Abbas and Qeshm exist and due to the defects in Nitrate (0.059-0.707 mg/L), Phosphate (0.035-
spherical
the urban andor oval cysts wastewater
industrial and by releasingsystem, active
the oxygen causes and
1.01 mg/L) oxidative fish gillsmg/L).
DO (3.9-9.8 and increases
Different
amount of organic
the amount materials
of oxygen in coastal
in the area atwaters is ofstudies
the time red tide showed that the
occurrence. amount
Natural of dissolved
environmental
high during during
conditions the whole of the for
the bloom year,this
andtypealmost
of algae,oxygen
salinity(DO) in the25presence
is between to 30 ppt of andalgae
wateris
algal density was very high all of the 9-month increased due to photosynthesis and producing
temperature is between 32 to 34 ºC considering that the proper temperature range for the growth
period in this area. In other areas, the algal oxygen radical by Cochlodinium and salinity
of phytoplankton
density reduced and in theincreased
Persian Gulf is in fall andequal
periodically winter, the phenomenon
to 39.2 occurrences
ppt and temperature abovewas30inºC
which these (Manshouri
that period enhancement andand reduction
Tabiee Yeganeh, were2009;limits the Cochlodinium
Mohammadi Tahroodi et growth (Bahri,
al., 2013; 2009).
Seddigh
obvious in the northern and southern regions of Based on scientific studies and field evidence,
Marvasti, 2016). According to the sampling values by Persian Gulf and Oman Sea Ecological
the Oman Sea (Hamzei, 2012). Cochlodinium, the assumptive reasons in this case are
Research Institute, parameters variations at the time of blooming were in the following range:
dinoflagellate with yellowish to brownish green presented as follows: transport iron-rich
salinity (37-39.2
pigment, was able ppt), temperature
to produce spherical(20.4-33.9
or oval ºC),suspended
PH (7.96-8.6), Nitrate
particles (0.059-0.707
by wind and dustmg/L),
storms
cysts and by
Phosphate releasing mg/L)
(0.035-1.01 activeandoxygen fromDifferent
causes mg/L).
DO (3.9-9.8 the littoral statesshowed
studies around that
the Persian
the amountGulf;
oxidative fish gills and increases the amount Surface disorganization due to sea currents;
of oxygen in the area at the time of red tide Climate changes on a large scale such as El
293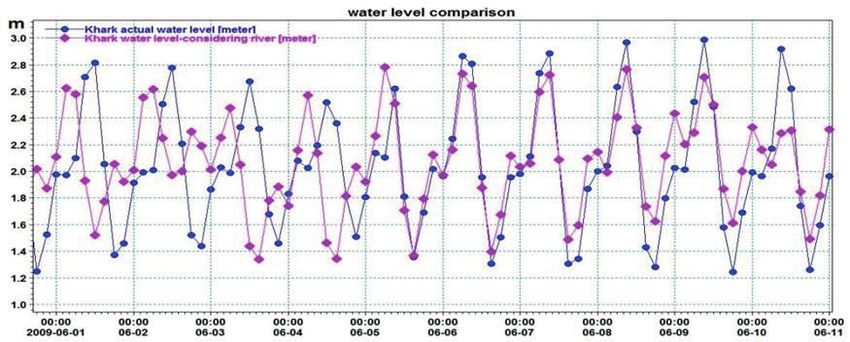
Research in Marine Sciences 293
(a) (b) (c) (d)
Figure 2. (a) Coral reefs mortality due to suffocation and loss of light- the layer of algae covering their
surface, (b) foam (sewage) due to aquatic mortality, (c) Dead fish due to red tide in the Persian Gulf,
Autumn 2008, (d) Water discoloration due to Cochlodinium bloom in north of the strait of Hormuz,
Qeshm in November 2008 (Rezaee and Kabiri, 2009; Taghavi and Abbaspour, 2012)
Niño; transport species through ships ballast the water quality and damage to desalination
In general,
waters; Heavyto decrease
rainfall growth of redtotides
in addition different
raising methodsand
equipment including
systems,physical (likedesalination
especially spraying
the
clay,temperature,
reducing sourcesreducing the amount
of nutrients, of salt
etc.), chemicalequipment (RO) hypochlorite
(using sodium of Qeshm, and ships by
produced and
and increasing
electrolysis the wateretc.)
of seawater, nutrients especially
and biological (usingoffshore facilities,
of zooplankton damage tobacteria,
and anti-algae the seafood
etc.)
vitamin B12; Entering abundant volume of industry, especially aquacultures in Hormozgan
are used. Since prevention methods in comparison to decrease methods is preferable, so it is
nutrients and increased water temperature due and Bushehr (Rezaee and Kabiri, 2009; Taghavi
essential
to geologic to find a method
activities and for predicting
upwelling red tide and
(Qeshm occurrence
Abbaspour,and 2012),
observing the trend
extinction of itshells
of pearl by
earthquake
consideringoccurrence
all factors and
suchyearly upwelling
as salinity, on andprecipitation,
temperature, sea cows of Persian
current Gulf and
velocity (Hormozgan
relative
the east coast
humidity. For ofthisOman Sea abetween
purpose, February
monitoring news, 2011),
network system can besocial andand
created economic
used forproblems
recordingfor
and March); entering abundant volume of lowlander and stop tourism industry in Kish
the required information. An integrated predicting model could be an important goal for research
nutrients, urban and industrial sewage, from and Qeshm, producing foam with fetid smell
programs
coastal on ecology
region and algal
of Bandar Abbas.bloom
The time (Vahedi,caused
southern 2009; byTaghavi
bacteriaanddecomposition
Abbaspour, 2012). which results
cities without treatment plant pour their sewage in lowlander harassment and a sharp decline in
2. 2. Materials
directly into the sea andmore
methodsthan 50 years. commutes (Mohammadi, 2008; Mohammadi
Discharge of Bandar Abbas sewage was equal Tahroodi, 2013).
to 300 2.1.
2.1. lit/s Introduction
in that time (Shakerzadeh
to MIKE software et al., and In governing
general, to theories
decrease growth of red tides
2009; Vahedi, 2009; Seddigh Marvasti, 2016). different methods including physical (like
Consequences
MIKE softwareofisCochlodinium
able to simulate algal in spraying
bloomchemical,
physical, clay, reducing
or biological processessources
in lakes,ofestuaries,
nutrients,
the
bays,Persian
coastalGulfareassummarized
and seas withasthefollows:
highestfish etc.),Forchemical
reliability. (using sodium
red tide modeling in MIKEhypochlorite
software,
mortality due to deposition in the fish gills and produced by electrolysis of seawater, etc.)
the hydrodynamics module-MIKE21 and the biological module-ECOLAB have been used.
suffocation, increase anaerobic respiration and and biological (using of zooplankton and anti-
MIKE21
the depletionis suitable
of DO intool
thefor two-dimension
water and poisoning (2D) simulation of physical,
algae bacteria, etc.) arechemical
used. Since or biological
prevention
aquatic,
processesespecially
in coastalfishorand benthic
marine organisms
areas methods
and it is based on in
thecomparison
numerical to decrease
solution of methods
the two is
who feed planktons
dimensional shallow(Rezaee and Kabiri,
water equations 2009;
- the preferable,incompressible
depth-integrated so it is essentialReynolds
to find a averaged
method for
Farman Ara et al., 2012), injury and severe predicting red tide occurrence and observing
Navier-Stokes equations. Thus, the model consists of continuity, momentum, temperature,
damage to light-dependent aquatic ecosystems, the trend of it by considering all factors such
salinity, and
especially density
coral equations.
reef in Hormozgan In the horizontal
waters due plane an unstructured
as salinity, grid is
temperature, used. The spatial
precipitation, current
to suffocationof and
discretization reduce light
the primitive penetration
equations is performed velocity
using aandcellrelative humidity.
centered For thismethod.
finite volume purpose,
(Mohammadi, 2008; Vahedi,
MIKE 21 has different 2009;
modules Taghavi
which andwater
are for a monitoring
quality andnetwork system
ecological can beECOLAB
modeling, created and
Abbaspour, 2012), discoloration and changing used for recording the required information.
295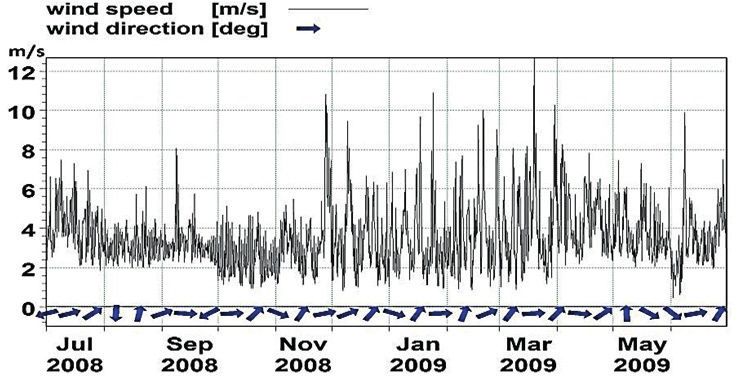
294 Red tide development modeling in Persian Gulf and... / 289 - 302

An integrated predicting model could be                   ecosystem into a reliable numerical model for
an important goal for research programs on                accurate predictions. The predefined ECOLAB
ecology and algal bloom time (Vahedi, 2009;               templates containing the mathematical
Taghavi and Abbaspour, 2012).                             descriptions of ecosystems can be used as a
                                                          basis and edited arbitrarily or the new template
2. Materials and methods                                  can be defined based on processes taking
2.1. Introduction to MIKE software and                    place in the ecosystem. The demand for tailor
governing theories                                        made ecosystem descriptions is great, because
                                                          ecosystems vary. A template is independent
MIKE software is able to simulate physical,               of grid systems and the same template can be
chemical, or biological processes in lakes,               integrated with one, two and three dimensional
estuaries, bays, coastal areas and seas with              or hydrology modeling. The template can
the highest reliability. For red tide modeling            describe dissolved substances, particulate
in MIKE software, the hydrodynamics                       matter of dead or living material, living
module-MIKE21 and the biological module-                  biological organisms and other components.
ECOLAB have been used. MIKE21 is suitable                 State variables included in ECOLAB can
tool for two-dimension (2D) simulation of                 either be transported by advection-dispersion
physical, chemical or biological processes in             processes based on hydrodynamics, or have
coastal or marine areas and it is based on the            a more fixed nature (e.g. rooted vegetation or
numerical solution of the two dimensional                 mussels). The description of the ecosystem
shallow water equations - the depth-integrated            state variables in ECOLAB is formulated as a
incompressible Reynolds averaged Navier-                  set of ordinary coupled differential equations
Stokes equations. Thus, the model consists of             describing the rate of change for each state
continuity, momentum, temperature, salinity,              variable based on processes taking place in the
and density equations. In the horizontal plane            ecosystem. Besides the pure process orientated
an unstructured grid is used. The spatial                 description (Eulerian modeling), this module
discretization of the primitive equations is              also supports the characterization of individual
performed using a cell centered finite volume             spatial entities or particles with associated
method. MIKE 21 has different modules                     attributes (agent based modeling or Lagrangian
which are for water quality and ecological                modeling). After creating or picking an
modeling, ECOLAB module is used.                          ECOLAB template for the ecosystem, the
ECOLAB is a complete numerical laboratory                 ECOLAB model must be set up and run in
for customizing aquatic ecosystem, water                  MIKE 21 FLOW MODEL (FM). In this paper,
quality, and ecological studies by describing             Eutrophication 1 ECOLAB template had
chemical, biological, ecological processes                been used. This template considers dispersion
and interactions between state variables and              in Eulerian framework by default, and in
physical processes. By ECOLAB exactly the                 order to simulate the simultaneous processes
required model for the specific ecosystem can             of transport, dispersion and biological/
be developed and its processes can be described           biochemical processes considers a system of 12
by using standard and transform any aquatic               differential equations describing the variations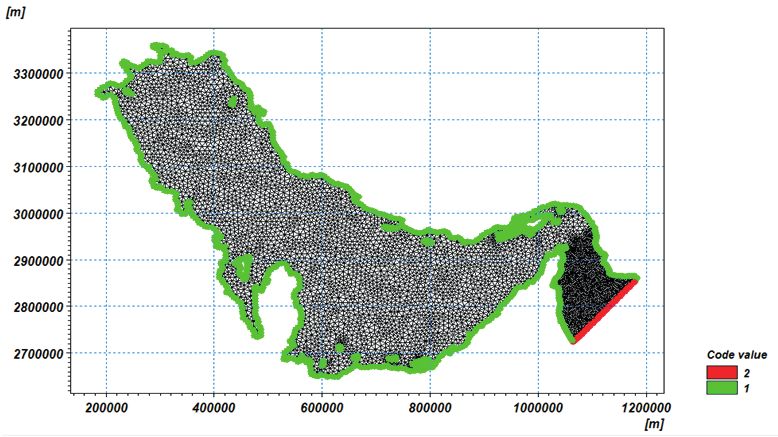
is great, because ecosystems vary. A template is independent of grid systems and the same
template can be integrated with one, two and three dimensional or hydrology modeling. The
template can describe dissolved substances, particulate matter of dead or living material, living
biological organisms and other components. State variables included in ECOLAB can either be
transported by advection-dispersion processes based on hydrodynamics, or have a more fixed
nature (e.g. rooted vegetation or mussels). The description of the ecosystem state variables inResearch in Marine Sciences 295
ECOLAB is formulated as a set of ordinary coupled differential equations describing the rate of
change for each state variable based on processes taking place in the ecosystem. Besides the pure
for
process12 orientated
components (11 movable
description components
(Eulerian modeling), this module Based also on the the
supports above, red tide modeling in
in both hydrodynamic and biological modules Persian Gulf has been done (MIKE manuals,
characterization of individual spatial entities or particles with associated attributes (agent based
modeling or Lagrangian modeling). After creating or picking an ECOLAB template for the
and a fixed nature component belonging to the 2012).
ecosystem, the ECOLAB model must be set up and run in MIKE 21 FLOW MODEL (FM). In
benthic system). The processes describing the
variations of the components in time and space 2.2. Red Tide Modeling Process
this paper, Eutrophication 1 ECOLAB template had been used. This template considers
dispersion in Eulerian framework by default, and in order to simulate the simultaneous processes
are dependent on external factors such as the
of transport, dispersion and biological/ biochemical processes considers Generally,
a systemtheofsteps
12 to carry out an environmental
salinity, water temperature, the light
differential equations describing the variations for 12 components (11project influx,
consist of:
movable components in project analysis (analysis
and the discharges. In this paper, the
both hydrodynamic and biological modules and a fixed nature component variation belonging to of the the ecosystem problem and
and evaluation
of chlorophyll-A,
benthic system). The processes inorganic
describing the phosphorus
variations of the andcomponents in time and space are
solution strategy); collection of data, field
nitrogen
dependent on and alsofactors
external DO are suchstudied. The water
as the salinity, dynamics
temperature, the light influx, and the
measurements, and laboratory analysis; set
of advective
discharges. In this paper, ECOLAB
the variation state variables
of chlorophyll-A, inorganicis phosphorus and nitrogen and
up and run the model; calibration; solution
calculated
also DO are studied. by: The dynamics of advective ECOLAB state variables is calculated by:
(running the production simulations and
డ డ డ డ డమ డమ డమ
ݑ ݒ ݓൌ ܦ௫ మ ܦ௬ మ ܦ௭ మ ܵ ܲ (1) presenting the results). (1) For red tide modeling
డ௧ డ௫ డ௬ డ௭ డ௭ డ௭ డ௭
in MIKE software, the hydrodynamics module-
which C is the concentration of 296 the ECOLAB
MIKE21 and the biological module-ECOLAB
state variable; u, v, w are flow velocity
have been used (MIKE manuals, 2012). Red
components;
which C is the Dx, concentration
Dy, Dz are the of the dispersion
ECOLAB tide statemodeling
variable; process
u, v, winare flow Gulfvelocity
Persian zone is
coefficients; Sc is sources and sinks; and Pc
he ECOLAB components;
state variable; Dx, Du,y, D are
v,zprocesses.
w are the dispersion
flowThe velocitycoefficients;dividedSc isinto four and
sources sections:
sinks; and Pc indicates
indicates ECOLAB mass
which
ECOLAB C isprocesses.
the concentration Thesinks;mass of balance
the ECOLAB 1) Define
state variable;
for chlorophyll-A u, Persian
reads: v, w are Gulf flow topography
velocity by using
rsion coefficients;
balance Sfor
c is chlorophyll-A
sources and reads:and Pc indicates
components; Dx, Dy, Dz are the dispersion coefficients; Sc shoreline is sources and andsinks;
waterand depth data of Persian Gulf in
Pc indicates
e for chlorophyll-A
ௗு reads:
ECOLAB ൌ ݊݅ݐܿݑ݀ݎ
processes. The െ ݄݀݁ܽݐ െ ݊݅ݐܽݐ݊݁݉݅݀݁ݏ
mass balance for chlorophyll-A ൌ ܴܲܪܥ Longitude/Latitude
reads: െ ܪܥܧܦെ ܵܪܥܧprojection ܵܪܥܧିଵbetween (2) 23.7 to
ௗ௧
ܴܲ ܪܥെ ܪܥܧܦെ ܵ ܪܥܧ ܵܪܥܧିଵ
݊ ݊݅ݐܽݐൌ ௗு (2)(2) 33 ºC north and 47.7 to 58 ºC east in xyz format
where
which
ௗ௧
C n-1
ൌ ݊݅ݐܿݑ݀ݎ
is denotes
the the
െ ݄݀݁ܽݐ
concentration input
െ of from
݊݅ݐܽݐ݊݁݉݅݀݁ݏ
the the
ECOLAB above
ൌstate layer
ܴܲܪܥ െ (n>1).
ܪܥܧܦ
variable; െ The
of u,ETOPO-1
v, w chlorophyll-A
ܵܪܥܧ areflow
ܵܪܥܧ ିଵ
velocity
website (2)
production
including amount
Longitude/
where
components; n-1 D denotes
, D , D the
are the input
dispersion from the above
coefficients; S is sources and sinks; and P indicates
above layer is:(n>1).
where n-1 The x
denotes chlorophyll-A
y z
the input fromproduction
the above amount c Latitude position and depth of every point and
c
layer (n>1). The chlorophyll-A production amount
layer
ECOLAB (n>1).
processes. The chlorophyll-A
The mass production
balance for chlorophyll-A reads: generate proper mesh for computational grid:
is:
amount ൌis:ሺ െሻ݄݀݁ܽݐ
ு
ܴܲܪܥ
ௗு
ൌ ݊݅ݐܿݑ݀ݎ
ൈ ሺܨଷ ሺܰǡ ܲሻሻ ൈ ൌܴܲܲܥ
െ ݊݅ݐܽݐ݊݁݉݅݀݁ݏ ܴܲ ܪܥെ ܪܥܧܦെ import
ܵ ܪܥܧ shoreline
ܵܪܥܧିଵ data,
(2) modify boundaries,
(3)
ூ
ௗ௧ ு
ܴܲܲܥ ܴܲ ܪܥൌ ሺ ሻ ൈ ሺܨଷ ሺܰǡ ܲሻሻ ൈ ܴܲܲܥ (3)(3) define specifications of boundaries (3) for2 the area
wheren-1CH
where ூ
denotes is the
the coefficient
input from the of determining
above layer (n>1). the
Theminimum
chlorophyll-A chlorophyll-A
production amount production (E/m /d -1
),
min
by creating closed domain,2 define position of
rmining thewhere
minimum
where
is:
CH max
CH CH
is the
minmin
is the
chlorophyll-A
iscoefficient
the coefficient
coefficient production
of determiningof (E/m
of determining determining
2 -1
/d
the
the ),
minimum
maximum chlorophyll-A
chlorophyll-A production
production
-1
(E/min/dthe
Jask (Lat.=25/63، Long.=57/77) and Majis ), absence of
the
CHmaxminimum
g the maximum is the
chlorophyll-Acoefficient chlorophyll-A
of determining
production in production
the the maximum
absence of(E/chlorophyll-A production in the absence of
nutrient
ܴܲܪܥ
ு
ൌ ሺlimitation, ሻ ൈ ሺand ܨሺܰǡ F3ܲሻሻ (N) is calculated by the following
ൈ ܴܲܲܥ (Lat.=24/518،formula:Long.=56/606) (3) and draw arc,
m /d ),limitation,
2 -1
nutrient CH ூ the Fଷcoefficient
is and (N) is of determining
calculated by the following formula:
lated by the following formula: max 3 and define a unique integer value for boundaries
the
where maximum
CH is the chlorophyll-A
coefficientே of determining production in thechlorophyll-A production (E/m2/d-1),
the minimum
ܨଷ ሺܰሻ ൌminܪܥ௫ ൈே ቄሺ െ ܲܰ ሻȀሺܲܰ௫ െ ܲܰ (open
ሻቅ boundaries and land boundaries mark (4) 2
ܨଷ ሺܰሻ
absence
CH max isൌthe of
ܪܥ nutrient
coefficient limitation,
ൈ ቄሺ of determining
െܲܰ ሻȀሺܲܰ theand F
maximumെ ܲܰ(N) is
ሻቅ
chlorophyll-A production in the absence of (4)
3 (4)
௫ ௫
ܲܰ௫ െ ܲܰ ሻቅ and 1, respectively) to create a mesh, define
calculated
nutrient
SECH and by
limitation,
DECH theand following
F (N)
read:
3 is formula:
calculated by the following formula:
SECH and DECH read: polygons for closed domains and exclude the
ܨଷ ሺܰሻ ൌ ܪܥ௫ ൈ ቄሺு ு
ே
െ ܲܰ ሻȀሺܲܰ௫ െ ܲܰ ሻቅ (4) small islands from the(4)mesh domain, import
ܵܪܥܧ
ܵܪܥܧ ൌൌܵܥܲܧ ܵܥܲܧ ൈൈ ሺ ሺሻ ሻ
(5) (5)
(5) scatter data to interpolate water depths in mesh
SECH
SECH and and DECH DECH read: read:
ு elements, generate depth-independent mesh,
ܪܥܧܦ ൌ
ܪܥܧܦൌ ሺܥܲܧܦ ሺܥܲܧܦ ܥܴܲܩሻ
ܥܴܲܩሻ ൈ ቀ ൈ ቁቀுቁ (6) (6)
ܵ ܪܥܧൌ ܵ ܥܲܧൈ ሺ ሻ
ு (5) then smoothing and refining (5) and analyzing the
(6)
Based on the above, red tide ு modeling in Persian Gulf has been meshdone to (MIKE
ensure manuals,
that the2012).
mesh is optimal, carry
Based
ܪܥܧܦ ൌon the above,
ሺܥܲܧܦ ܥܴܲܩሻ redൈ ቀtideቁ modeling in Persian (6) Gulf has been done (MIKE(6)manuals, 2012).
g in Persian Gulf has been done (MIKE manuals, 2012). out mesh-interpolation by interpolating scatter
2.2. 2.2. Red Tide Modeling Process
Based on the above, red tide modeling in Persian Gulf has been done (MIKE manuals, 2012).
2.2. 2.2. Red Tide Modeling Process
ocess
Generally,
2.2. the Tide
2.2. Red stepsModeling
to carry out an environmental project consist of: project analysis (analysis
Process
2.2. 2.2. Red Tide Modeling Process
Generally,
andproject
the of
evaluation
steps
the
to carry outproblem
ecosystem
an environmental project consist of: project analysis (analysis
and solution strategy); collection of data, field
environmental consist of: project analysis (analysis
Generally, the steps to carry out an environmental project consist of: project analysis (analysis
and evaluation
measurements, andof the ecosystem
laboratory analysis; problem
set up field andthesolution
and run strategy); solution
model; calibration; collection of data, field
(running
roblem andand
solution
evaluationstrategy); collection
of the ecosystem of data,
problem and solution strategy); collection of data, field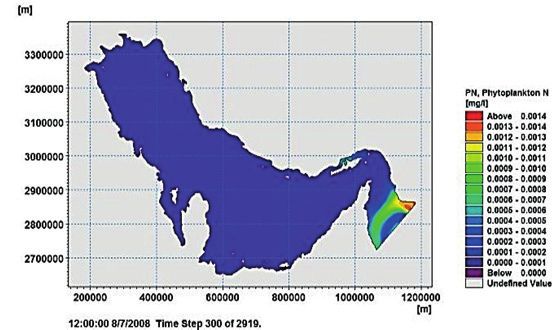
mesh elements, generate depth-independent mesh, then smoothing and refining and analyzing
the mesh to ensure that the mesh is optimal, carry out mesh-interpolation by interpolating
scatter data amounts and represent the bathymetry in mesh nodes according to the input data,
296 and
Redfinally export modeling
tide development the mesh file inGulf
in Persian order
and...to use- 302
/ 289 it in MIKE21 hydrodynamic module.
According to the above steps, the results of this part are shown in Figure 3.
(a)
(b)
Figure 3. (a) Persian Gulf bathymetry, (b) mesh file and the defined boundary codes
data amounts and represent the bathymetry in rose plot for during the year, hydrodynamic
298
mesh nodes according to the input data, and sources data like the average flow of Mond,
finally export the mesh file in order to use it Dalaki, Arvand rivers respectively equal to
in MIKE21 hydrodynamic module. According 4.39, 5.13, 1750 cubic meter per second and
to the above steps, the results of this part are inputting wastewater flow of Bandar Abbas
shown in Figure 3. equal to 300 liter per second: in this modeling
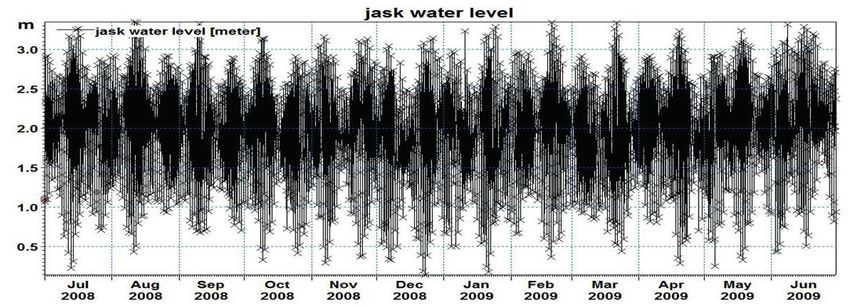
2) Definition of hydrodynamic flow in the Evaporation-precipitation over the Persian
Persian Gulf, according to water level data in Gulf, the dominant wave system and density
the open boundary between Jask and Majis variations based on salinity and temperature
from IOC website in the period of 1 July 2008 are ignored. Thus, time series and wind rose
till 30 June 2009, and prevailing hydrodynamic plot are as Figure 4.
forcing including wind force data in station The wind rose in Figure 5 is in accordance with
(long.=56, lat.=26) from Coastal and Port the studies about winds pattern over the Persian
Engineering Department of Ports and Maritime Gulf that states this area is in the pattern of the
Organization in the form of time series and wind summer monsoon winds (southwest) and winter
sources data like the average flow of Mond, Dalaki, Arvand rivers respectively equal to 4.39,
  5.13, 1750 cubic meter per second and inputting wastewater flow of Bandar Abbas equal to
  300 liter per second: in this modeling Evaporation-precipitation over the Persian Gulf, the
  dominant wave system and density variations based on salinity and temperature
                                                                  Research        areSciences
                                                                           in Marine  ignored.297
  Thus, time series and wind rose plot are as Figure 4.

                                                    (a)

                                                    (b)
Figure 4. Water level time series (m) in (a) Jask and (b) Majis stations

                                                  299

                                 (a)                                                     (b)
Figure 5. (a) Wind time series [speed (m/s) and direction (deg)], (b) wind rose plot in station (Long =56,
Lat = 26)

monsoon  winds
  The wind  rose(northeast)
                  in Figure and
                              5 isthe
                                    in strength of with
                                        accordance     2016).  After defining
                                                          the studies          water
                                                                      about winds      level over
                                                                                    pattern    boundary
                                                                                                  the
winter monsoon
  Persian        winds
          Gulf that     arethis
                    states  mucharealess  than
                                      is in     patterncondition,
                                            thethe                wind monsoon
                                                        of the summer    forcing, winds
                                                                                   rivers,(southwest)
                                                                                             topography
summer monsoon winds (Seddigh Marvasti, and determining initial conditions in MIKE 21
  and winter monsoon winds (northeast) and the strength of winter monsoon winds are much
   less than the summer monsoon winds (Seddigh Marvasti, 2016). After defining water level
   boundary condition, wind forcing, rivers, topography and determining initial conditions in
   MIKE 21 Flow Model (FM), the hydrodynamic model is created and a two-dimensional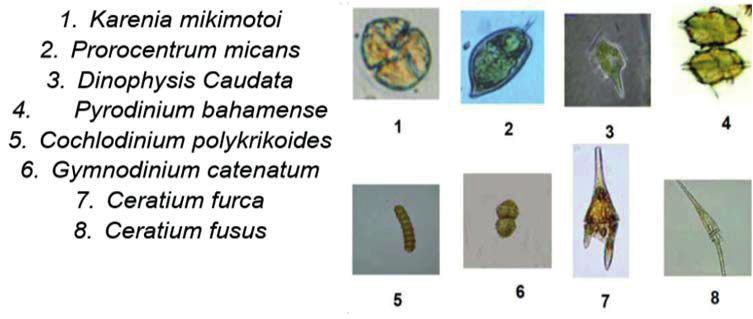
298 Red tide development modeling in Persian Gulf and... / 289 - 302

Figure 6. Comparison of simulated water level (m) with actual water level data in Kharg station (eddy
viscosity=0.34, bed resistance=50)

FlowTheModel
         observed    difference
                 (FM),            in the figures model
                         the hydrodynamic          may be due to to
                                                                  50consider
                                                                      and 0.34only
                                                                                 which   are used
                                                                                     the wind   force.in Inthegeneral,
                                                                                                                ultimate
is created   and are
    four factors   a two-dimensional
                        important in the output
                                             Persianand       hydrodynamic
                                                       Gulf Stream               model
                                                                       circulation:     to define
                                                                                     wind,   tides, red
                                                                                                     water tide.
                                                                                                               density
a point output in Kharg station are defined. In The observed difference in the figures may be
    variation and turbulent diffusion caused by vertical mixing processes. (Taghavi and
order to convergence and stability of the model due to consider only the wind force. In general,
    Abbaspour,
during   solving 2012)
                     partialThis difference equations
                              differential     can be due to     notfactors
                                                              four    considerareother factorsinlike
                                                                                   important      the tides,
                                                                                                          Persianwater
                                                                                                                     Gulf
using   explicit
    density         method, Courant number is Stream circulation: wind, tides, water density
             variation.
defined as 0.5. The simulation time step is variation and turbulent diffusion caused
    4) to4)10800
equal        Defining    trend of
                     seconds,    andalgal
                                       the bloom
                                            numberinofPersian by Gulf     zone
                                                                   vertical      by utilizing
                                                                              mixing            data (Taghavi
                                                                                       processes.      variation in   and
timesalinity, temperature,
      steps due    to cover chlorophyll-A,
                              the year is definednutrient
                                                        as concentration
                                                              Abbaspour,(nitrate
                                                                              2012) and
                                                                                     Thisphosphate)
                                                                                            differenceand   canDO be in
                                                                                                                      due
2919.
    formLow    order method
          of average     monthlyis in
                                    selected                  to not consider
                                                to solve ECOLAB
                                       open boundary,                             other factors
                                                                        forces including           like tides,equal
                                                                                            solar radiation        water
the equations. Two-dimensional            results show density variation.
    to constant value 26.5 E/m2/d, ECOLAB loading concentration including concentration of
counterclockwise flow of the Persian Gulf.                    4) Defining trend of algal bloom in Persian
    Bandar    Abbas   sewage     pollution   equal
3) Persian Gulf hydrodynamic model calibration Gulf  to  300  lit/s inzone
                                                                        eutrophication   1 ECOLAB
                                                                               by utilizing                 template: in
                                                                                                data variation
by Horizontal
     using actual diffusion
                      water coefficients,
                               level data growth
                                              of Kharg and death    rate, temperature,
                                                              salinity,    sedimentationchlorophyll-A,
                                                                                           and grazing rate,        the
                                                                                                                 nutrient
station  which
    growing       received
               rate          fromon
                    dependence      Coastal    and Port
                                        temperature,          concentration
                                                        salinity  and nutrients(nitrate  and phosphate)
                                                                                  are changeable                and DO
                                                                                                     to investigate
Engineering Department of Ports and Maritime in form of average monthly in open boundary,
    the effect and calibrate the model. This template only considers diatoms and green algae. In
Organization: in order to model calibration, ECOLAB forces including solar radiation
bedthis  modeling
     resistance   anddiatoms    growth values
                      eddy viscosity      rate equal   to 0.8 equal
                                                  during       per dayto and  greenvalue
                                                                         constant    algal26.5
                                                                                            growth
                                                                                                 E/mrate
                                                                                                       2
                                                                                                         /d, equal
                                                                                                              ECOLAB to
the 1.4 per day, sedimentation
     simulation                      rate in theFinally,
                    have been changed.             depth of less   than concentration
                                                              loading    2 meters equalincluding
                                                                                           to 0.25 m/day        and in
                                                                                                       concentration
the optimal values of them respectively equal of Bandar Abbas sewage pollution equal to 300
                                                         301
the depth of greater than 2 meters equal to 0.5 m/day and maximum grazing rate equal to 1.5
per day and death rate equal to 0.02 per day are defined. In output part of the simulation, a
Research in Marine Sciences 299
two-dimensional output including chlorophyll-A, inorganic nitrogen and phosphorus, and DO
variation is defined.
lit/s in eutrophication 1 ECOLAB template: the depth of less than 2 meters equal to 0.25 m/
Horizontal diffusion coefficients, growth and day and in the depth of greater than 2 meters
3. 3. Results and Discussion
death rate, sedimentation and grazing rate, equal to 0.5 m/day and maximum grazing
the growing rate dependence on temperature, rate equal to 1.5 per day and death rate equal
Finally, and
salinity the results of simulation
nutrients show that
are changeable to chlorophyll-A
to 0.02 per day concentration
are defined.isIn increased byof
output part
enhancing the amount
investigate of calibrate
effect and nitrate andthephosphate,
model. and
the increasing in chlorophyll-A
simulation, concentration
a two-dimensional output
This
causestemplate onlyin considers
increasing diatoms and
DO concentration. including
Also the chlorophyll-A,
trend of chlorophyll-Ainorganic
developmentnitrogen
is
green algae. In this modeling diatoms growth and phosphorus, and DO variation is defined.
according to Persian Gulf stream circulation as well as increasing growth rate due to nutrient
rate equal to 0.8 per day and green algal growth
concentration.
rate equal to 1.4 per day, sedimentation rate in
302
Figure 7. The trend of chlorophyll-A (mg/l) by utilizing eutrophication 1 template and dominant stream in
Persian Gulf (chlorophyll-A dispersion and diffusion is in accordance with main direction of dominant
stream and also location of contamination sources)300 Red tide development modeling in Persian Gulf and... / 289 - 302
3. Results and Discussion Conclusion
Finally, the results of simulation show that In the recent years, Persian Gulf due to special
chlorophyll-A concentration is increased by geographical and climate conditions has been
enhancing the amount of nitrate and phosphate, confronted with red tide phenomenon and it
and increasing in chlorophyll-A concentration gives seriously impact on ecosystem, public
causes increasing in DO concentration. Also health and economy condition. Due to the facts
the trend of chlorophyll-A development is that through the investigating methods of this
according to Persian Gulf stream circulation as phenomenon, numerical modeling has great
well as increasing growth rate due to nutrient importance because of the need to lower time
concentration. and cost, in this paper, the effects of pollution
Figure 7. The trend of chlorophyll-A (mg/l) by utilizing eutrophication 1 template and dominant stream in
outflows and hydrodynamic currents of Persian
Persian Gulf (chlorophyll-A dispersion and diffusion is in accordance with main direction of dominant
stream and also location of contamination sources)
(a) (b)
Figure 8. Comparison the proceed of (a) chlorophyll-A (mg/l) to (b) nitrogen and phosphorus dispersion
(mg/l)
(a) (b)
Figure 9. Comparison of (a) DO variation (mg/l) to (b) chlorophyll-A concentration (mg/l) by utilizing
eutrophication 1 template
303Research in Marine Sciences 301
Gulf on Red Tide development in 2008-2009 the 10th International Conference on Coasts,
period and variation of amount of DO to Ports and Marine Structures, Tehran, Iran.
chlorophyll-A was simulated and studied by Glibert, P. M., Allen, J.I., Bouwman, A. F.,
utilizing MIEK21 FLOW MODEL (FM) and Brown, C.W., Flynn, K. J., and et al. 2010.
EUTROPHICATION 1 ECOLAB TEMPLATE Modeling of HABs and eutrophication:
modules. The simulation results showed that Status, advances, challenges. Journal of
the direction of red tide development was in Marine Systems, 83(3-4): 262-75.
accordance with the mainstream direction of Hamzei, S. 2012. Field Observation and
Persian Gulf. Considering nitrate concentration numerical modeling of red tide development
(0.059-0.707 mg/l) and phosphate concentration in the north part of Hormoz Strait, Science
(0.035-1.01 mg/l) in hydrodynamic boundary and Technology University, Iran.
and Bandar Abbas swage pollution equal to 300 Hodgkiss, I.J., and Ho, K.C. 1997. Are changes
lit/s, chlorophyll-A concentration was increased in N: P ratios in coastal waters the key to
with increasing nitrate and phosphate as well increased red tide blooms? Hydrobiologia,
as persistent in those areas at all times till the 352: 141e147.
presence of nutrients over there. In addition, Hormozgan news. 2011. Available at http://
due to increasing chlorophyll-A concentration, www.hormozgannews.com/Pages/News-
the dissolved oxygen concentration increased. 2325.html [Accessed on July 2017].
Malaei Tavana, H., Behpoor, S., Changizi,
References M., and Karimi, H. 2008. Investigate the
reinforcing factors in forming and occurrence
Anderson, D. M. 1994. Red tides. Scientific of harmful algal bloom, National Conference
American Journal, 271(2): 52-58. on Human, Environment and Sustainable
Bahrami Rad A. 2013. Algae bloom and its Development, Hamedan, Iran.
importance in aquatic ecosystems, http:// Manshouri, M., and Tabiee Yeganeh, S. 2009.
www.newposeidon.blogfa.com/post-57. Investigate the red tide causes and controlling
aspx. it in Persian Gulf, 12th National Congress
Bahri, A. 2009. Bloom and its importance in on Environmental Health, Shahid Beheshti
aquatic ecosystems, Persian Gulf and Oman University, Tehran, Iran
Sea Ecological Research Institute. Available McGillicuddy, D.J. 2010. Models of harmful
at: http://pgoseri.ac.ir [Accessed on March algal blooms: conceptual, empirical, and
2017]. numerical approaches, Preface to a Special
Ebrahimi, M. 2015. Monitoring algae bloom in Issue of Journal of Marine Systems, DRAFT
coastal waters of Persian Gulf and Oman Sea MANUSCRIPT.
(Hormozgan coastal waters), Persian Gulf MIKE manuals. 2012. ECOLAB Short
and Oman Sea Ecological Research Institute. Scientific Description; MIKE 21 - FLOW
Farman Ara M., Hosseini Balam F., and MODEL FM-Particle Tracking Module;
Hasanzade E. 2012. Numerical simulation MIKE21/3 PARTICLE TRACKING;
of subsurface flow effects on the distribution GEODESY IN MIKE ZERO-Map
of red tide phenomenon in the Persian Gulf, Projection and Datum Conversion; MIKE21302 Red tide development modeling in Persian Gulf and... / 289 - 302 FLOW MODEL FM-ECOLAB/OIL Aquaculture Journal, 5: 13-21. SPILL; MIKE ZERO-PREPROCESSING& Seddigh Marvasti S. 2016. Numerical POSTPROCESSING; MIKE ZERO-Project simulation to study effective factors and Oriented Water Modelling; MIKE ZERO- different mechanisms of red tide in Oman mesh generator; MIKE ZERO-The Common Sea, Physical Oceanography PhD thesis, DHI User Interface for Project Oriented Islamic Azad University, Science and Water Modelling, available at https://www. Research Branch, Tehran, Iran. mikepoweredbydhi.com [Accessed on Shakerzadeh, F., Bavandi, S., Bahmanmanesh, March 2017]. A., and Hedayatifard, M. 2009. Red tide Mohammadi, H. 2008. Red tide, http:// and its destructive effects on the marine hamedmohamadi63.blogfa.com/post-27. environment with emphasis on marine aspx mollusks, The International Conference of Mohammadi Tahroodi, M. Fatemi, S. M., Persian Gulf in Islamic Azad University of Nabavi, S.M., and Kazemi Tabar, S. M. Bushehr, Iran. 2013. Study the occurrence of Cochlodinium Taghavi, L., and Abbaspour, M. 2012. The algal bloom and environmental parameters determinative factors for modeling and in the coastal waters of Qeshm- management of red tide in the Persian Hormozgan, International Congress on Gulf, The First International Conference Environmental Crises and its Solutions, of Environmental and Geopolitical Persian Kish Island, Iran Gulf. Park, S., Lee, Y., and Lee, S.R. 2013. Vahedi, M. 2009. Red tide threat. Port & Sea Forecasting Red Tide using Ensemble magazine, 23: 116-119. Method. International Journal of Software Vollenweider, R.A. 1992. Coastal marine Engineering and Its Applications, 7(5): 145- eutrophication. In: Vollenweider, R.A., 152. Marchetti, R., Viviani, R. (Eds.), Marine Peinert, R., Saure, A., Stegmann, P., Stien, C., Coastal Eutrophication. London: Elsevier. Haardt, H., and Smetacek, V. 1982. Dynamics Wikipedia. 2014. Red tide, https://en.wikipedia. of primary production and sedimentation in org/wiki/Red_tide. a coastal ecosystem. Netherlands Journal of Wong, K.T., Lee, J. H., and Hodgkiss, I. J. 2007. Sea Research 16: 276-289. A simple model for forecast of coastal algal Rezaee, H., and Kabiri, K. 2009. Study red tide bloom. Estuarine, Coastal and Shelf Science, phenomenon tracking in the Bandar Abbas 74(1-2): 175-196. coastal waters and Qeshm and Hormuz Islands, Research Project of National Ocean Graphic Center. Sadeghi Mazidi, S., Ahmadi, M.R., and Taherizadeh, M.R. 2011. The seasonal changes in phytoplankton population and environmental factors in winter and spring in Bandar Abbas coastal waters. Fisheries and
You can also read