Variation in size and shape of toxin glands among cane toads from native range and invasive populations
←
→
Page content transcription
If your browser does not render page correctly, please read the page content below
www.nature.com/scientificreports
OPEN Variation in size and shape
of toxin glands among cane toads
from native‑range and invasive
populations
Cameron M. Hudson1,2,3, Gregory P. Brown1,3, Ryann A. Blennerhassett4 & Richard Shine1,3*
If optimal investment in anti-predator defences depends on predation risk, invading new regions (and
thus, encountering different predators) may favour shifts in that investment. Cane toads offer an ideal
system to test this prediction: expensive anti-predator toxins are stored mainly in parotoid glands
whose dimensions are easy to measure, and toad invasions have changed the suites of predators they
encounter. Although plasticity may influence parotoid morphology, comparisons between parents
and progeny revealed that gland dimensions were highly heritable. That heritability supports the
plausibility of an evolved basis to variation in gland dimensions. Measurements of 3779 adult toads
show that females have larger glands than males, invasive populations have larger glands than in
the native-range, and that parotoid sexual size dimorphism varies strongly among invaded areas.
Geographic variation in parotoid morphology may be driven by predation risk to both adult toads and
offspring (provisioned with toxins by their mother), with toxins allocated to eggs exacerbating the
risk of cannibalism but reducing the risk of interspecific predation. Investment into chemical defences
has evolved rapidly during the cane toad’s international diaspora, consistent with the hypothesis that
organisms flexibly adjust resource allocation to anti-predator tactics in response to novel challenges.
Vertebrates exhibit a variety of anti-predator adaptations1–3, but the costs associated with anti-predator phe-
notypes (e.g. synthesis of chemical defences, weaponry, behaviour) mean that we expect organisms to invest
in those defences only if they provide a net benefit to fitness4–6. This cost–benefit trade-off is affected by local
environmental conditions, such that defensive investments are worthwhile if vulnerability to predation strongly
affects an individual’s survival and/or breeding success, and if that vulnerability can be decreased by greater
investment in anti-predator adaptations2,6,7. If these conditions do not apply, fitness can be enhanced by allocating
fewer resources to costly d efences8 and as a result, anti-predator phenotypes may experience reduced individual
fitness when predators are absent4,9. Thus, models predict dynamic investment into anti-predator defences in
response to environmentally variable factors (such as the effectiveness of defences, and the influence of predation
risk on fitness7,10). Additionally, investment into anti-predator defences may trade off with mobility, such that a
fitness benefit to rapid dispersal may enforce a reduction in weaponry, or favour a shift in the packaging of anti-
predator substances in ways that reduce negative impacts on d ispersal11. To test these ideas, we need a species
for which investment into anti-predator defence is expensive; that is exposed to a range of predator threats that
differ geographically; that differs geographically in rates of dispersal; and in which it is easy to quantify invest-
ment in anti-predator defences.
Cane toads (Rhinella marina) provide an excellent study system in these respects. Like many amphibians,
toads synthesise potent chemical defences in the form of steroidal b ufotoxins12–14 that are energetically expensive
to produce15,16. Quantifying investment into those chemicals is facilitated by the fact that most toad toxins are
produced and stored in parotoid (shoulder) macroglands, whose dimensions can be easily and accurately meas-
ured on live animals17,18 (Fig. 1). Importantly, cane toads have invaded many areas outside their native range,
bringing them into contact with predators that have not co-evolved with bufonids and hence, lack the physi-
ological capacity to tolerate the distinctive toxins produced by these a nurans19,20. That lack of co-evolutionary
1
Department of Biological Sciences, Macquarie University, Sydney, NSW 2109, Australia. 2Department of Fish
Ecology and Evolution, Eawag, Swiss Federal Institute of Aquatic Science and Technology, Center of Ecology,
Evolution and Biochemistry, Seestrasse 79, 6047 Kastanienbaum, Switzerland. 3School of Life and Environmental
Sciences, University of Sydney, Sydney, NSW 2006, Australia. 4Rollins College, Winter Park, FL 32789,
USA. *email: rick.shine@mq.edu.au
Scientific Reports | (2021) 11:936 | https://doi.org/10.1038/s41598-020-80191-7 1
Vol.:(0123456789)www.nature.com/scientificreports/
history may affect optimal levels of investment into chemical defences. For example, a toxic toad in its native
range is likely to be confronted with predators that either are unaffected by its toxic arsenal (small genetic
changes to predator physiology confer many thousandfold r esistance20) or have evolved to exclude large toads
from the d iet21,22. Thus, increased investment into toxin production may confer little benefit to toad fitness in the
native range. In contrast, greater investment into chemical defences may enhance survival in the invaded range,
because toad-naïve predators cannot tolerate bufonid toxins19. In keeping with that hypothesis, interspecific
comparisons within the Bufonidae show that possession of potent chemical defences is a significant correlate
of range e xpansion23.
In the case of the cane toad, the invaded range in Australia contains many predators that are susceptible to
the toxin, and willing to attack adult toads (especially at the invasion front19), favouring increased allocation of
resources to toxin production. Additionally, cane toads in many parts of Australia are highly dispersive, stimu-
lating rapid evolution of morphological traits (such as relative limb lengths) associated with higher m obility24.
25
In contrast, cane toads in Hawai’i are relatively s edentary and the colonized area contains few species that are
predators of adult toads26, favouring reduced investment. However, toxins do not protect only adult (terrestrial-
phase) toads; reproducing female toads allocate toxins to eggs to protect aquatic stages a lso27,28. As a result, the
magnitude of toxin stores in reproductive female toads may comprise two components: that needed for defence
of the adult toad, and that needed to provision her offspring.
Toads can change the magnitude of their investment into defensive chemicals via two mechanisms: adapta-
tion and phenotypic plasticity. Under the former mechanism, the size of parotoid glands is expected to show
significant heritability; gland sizes vary geographically because individuals with specific sizes of glands survive,
and pass that trait on to their progeny. The alternative mechanism, phenotypic plasticity, requires an individual
toad to modify its investment into toxin production based on circumstances that it encounters earlier in life. For
example, a larval cane toad that is exposed to cues predicting high predation risk develops larger parotoid glands
after metamorphosis29. Both canalised adaptation and plasticity can increase individual fitness, and can co-occur.
Phenotypic plasticity in toxin investment is best demonstrated with experimental studies30–33, whereas the likeli-
hood of longer-term selection on parotoid morphology can be clarified by quantifying heritability of this trait.
To test these ideas, we measured the sizes of parotoid glands in field-caught cane toads from the species’
native range in South America, as well as invasive populations on three Hawai’ian Islands and in four regions
of Australia. Because climates diverge between windward and leeward shores within each island, and the two
sides are separated by inhospitable habitat (making it more difficult for toads to move from one side of an island
to another), we treated the “wet” (windward) and “dry” (leeward) sides of each Hawai’ian island as a separate
sampling unit. We also bred and raised toads from three Australian populations under standard (“common
garden”) conditions, to measure heritability of parotoid morphology.
Results
The relationship between ln parotoid area and ln SVL was linear, with SVL explaining 75.4% of the variance
in ln parotoid area (t = 106.52, 1 df, P < 0.0001). Our measure of parotoid shape (width divided by length) was
significantly (P < 0.0001) correlated with our measure of overall relative parotoid size (residual scores from the
linear regression of ln parotoid area to ln SVL) but explained very little variance in the latter trait ( r2 = 0.006).
Thus, we treat relative parotoid size and parotoid shape as separate dependent variables in the analyses below.
Variation in morphology of the parotoid macroglands among field‑collected adult toads. In
seven of the 11 regions that we sampled, female toads had larger parotoid glands than did males at the same
body length. At three other sites dimorphism was minimal, and at one site (Maui wet-side) the dimorphism was
reversed (larger parotoids in males than females: Fig. 2a). The glands of females were rounder in shape (greater
width relative to length) than were those of males, at all sites (Fig. 2b). However, the magnitude of sexual dimor-
phism in parotoid morphology differed significantly among populations (interaction region*sex from ANOVA,
for size F10,3669 = 4.70, P < 0.001; for shape F10,3681 = 3.06, P < 0.001). Thus, we examined geographic patterns sepa-
rately in the two sexes, as well as in the combined dataset.
Parotoid size. Relative to body length, toads from the native range had smaller parotoids than did conspecif-
ics from any of the invasive populations except those on the dry side of the large island of Hawai’i (Fig. 2a).
Parotoids were much larger in other sites within Hawai’i (especially in samples from the wet regions) and in the
coolest-climate population in Australia (NSW: see Fig. 2a). Sexual dimorphism in parotoid size was low in the
native range (2.3% difference in scores), high in Hawai’i (dry-side 9.2% divergence, wet-side 6.1%) and NSW
(9.2%), variable in O’ahu (dry-side < 0.1%, wet-side 7.2%) and low in Maui (dry-side 2.0%, wet-side 3.7%) and in
all tropical populations within Australia (0.2 to 2.2% in QLD, NT, WA: Fig. 2a). Because of the significant inter-
action between sex and region (above), we examined data separately by sex. For females, geographic variation in
relative size of the parotoids was significant (F10,37.63 = 2.29, P < 0.04), but with no significant posthoc Tukey tests
(all comparisons P > 0.05). In males, relative parotoid size also differed significantly among regions (F10,39.7 = 6.98,
P < 0.0001; posthoc tests show that wet-side Maui and dry-side O’ahu toads differed significantly from Hawai’i
dry-side conspecifics).
Parotoid shape. Broadly, sexual dimorphism in shape of the parotoids was low in the native range (6% differ-
ence in scores), variable in Hawai’i (3.3 to 8.3%), high in Queensland (7.4%), and decreased over the course of
the Australian invasion, such that invasion-front populations exhibited similar sexual dimorphism in this trait as
did native-range toads (e.g., 5.9% in NT, 5.2% in WA toads: Fig. 2b). Looking only at female toads (because of the
significant sex*region interaction, see above), we found significant geographic variation in shape of the parotoids
Scientific Reports | (2021) 11:936 | https://doi.org/10.1038/s41598-020-80191-7 2
Vol:.(1234567890)www.nature.com/scientificreports/
(F10,41.24 = 5.53, P < 0.0001; posthoc tests show that parotoids were wider relative to length in toads from French
Guiana than in most other groups (QLD, Hawai’i dry-side, O’ahu and Maui both sides), and Maui dry-side toads
had significantly smaller parotoids than did those from the native range, NT, WA, NSW or Hawai’ian wet-side
conspecifics. Shape variation was also significant in male toads ( F10,44.58 = 9.83, P < 0.0001), with parotoids sig-
nificantly more rounded in French Guianan animals than in those from QLD, both sides of O’ahu and dry sides
of Hawai’i and O’ahu. Toads from the latter three areas also had significantly smaller parotoids than did toads
from WA and the NT.
Across both sexes and in both wild-caught and captive-raised toads, parotoid glands were more rounded in
individuals whose limbs were relatively short compared to the body, based on linear regression comparing our
parotoid shape index to residual scores from the general linear regression of ln limb length vs. ln SVL. Although
limb length explained relatively little variation in parotoid shape in some groups, the relationship was statisti-
cally significant for all comparisons (wild-caught females arm length N = 1804, r 2 = 0.01, P < 0.0001, leg length
N = 1907, r2 = 0.04, P < 0.0001; wild-caught males arm length N = 1907, r2 = 0.04, P < 0.0001, leg length N = 1907,
r2 = 0.05, P < 0.0001; captive-raised females arm length N = 66, r 2 = 0.20, P < 0.0002, leg length N = 65, r2 = 0.29,
P < 0.0001; captive-raised males arm length N = 86, r2 = 0.12, P < 0.0015, leg length N = 86, r2 = 0.10, P < 0.0025).
Effect of toxin expulsion on dimensions of the parotoids. ANCOVA (with SVL as covariate to
remove body size effects) indicated that when measured five days post-manipulation, parotoid size and shape
were indistinguishable between toads from which we had manually expelled toxin from the glands compared to
sham-manipulated controls (both F1,32 < 1.42, both P > 0.24).
Assessment of heritability of parotoid morphology. Data from 61 parents and 317 offspring yielded
heritability estimates of 0.32 (SE = 0.09) for relative parotoid size and 0.26 (SE = 0.09) for parotoid shape. Repeat-
ability estimates for relative parotoid size and parotoid shape (i.e., ontogenetic consistency of individuals meas-
ured at multiple ages) were 0.57 (SE = 0.04) and 0.49 (SE = 0.04), respectively.
Discussion
Cane toads provide an excellent system in which to study the factors influencing investment into anti-predator
defences: the toad’s toxins are expensive to produce16, the magnitude of toxin stores is easily quantified17, and
recent range expansions have modified the toad’s rate of dispersal as well as its exposure to predation in both
aquatic and terrestrial phases of the life-history19. Variation in dimensions of the parotoid macroglands among
individuals is not attributable to recent expulsion of toxins (i.e., as measured over 5 days) and exhibits signifi-
cant heritability (present study), consistent with the hypothesis that geographic variation in gland morphology
reflects adaptive responses to novel challenges. Our sampling design does not allow us to determine whether the
heritability of parotoid dimensions is underpinned by genetic versus epigenetic changes.
The most notable changes in shape of the parotoid glands are the evolution of a more elongated parotoid
in invasive populations (relative to the situation in the native range) and a decrease in the degree of sexual
dimorphism in shape as toads colonized the Australian tropics (Fig. 2b). The former shift might be due either to
founder effects (genetic drift) or to novel selective forces. The latter shift mirrors evolutionary changes in relative
head size (and the decline in sexual dimorphism in that trait) that has taken place in Australia, perhaps as an
adaptation to increased rates of d ispersal34. Consistent with that hypothesis, length of the limbs relative to the
body (a trait that affects dispersal speed, and has evolved rapidly in invasive populations of cane t oads35–37) was
linked to parotoid shape. A large rounded parotoid gland extends well down behind the shoulder, and thus may
interfere with mobility of the forelimbs (see Fig. 1a). Under this interpretation, the evolution of greater mobility
in invasive populations of cane toads was accompanied by elongation of the parotoid glands as part of a suite of
morphological features related to enhanced mobility ( see36,37 for other traits). Such a shift might have evolved
either through adaptation (a fitness benefit to higher rates of d ispersal38) or through spatial sorting (accumula-
tion of dispersal-enhancing genes at an expanding range edge39).
Geographic variation in relative size of the parotoids exhibits more complex patterns (Fig. 2a). Parotoids
were larger in the invaded range than in the native range, and varied in size even among invaded sites within
both Hawai’i and Australia. These results support Phillips and Shine’s40 demonstration of geographic variation
in parotoid size within Australian toads, but do not reveal a strong cline associated with invasion history (contra
the previous analysis).
Variation in parotoid size may be driven at least partly by phenotypic plasticity; exposure to predation cues
during larval life stimulated recently metamorphosed cane toads in Australia to develop larger parotoid g lands29.
However, subsequent work in which we have raised toads to maturity revealed no significant difference in paro-
toid sizes of adult toads as a function of exposure to predation cues during larval life (Sharma et al., unpublished
data), suggesting that impacts of larval experience on parotoid dimensions do not persist through to adulthood.
High repeatability of parotoid measures in our study of captive-raised toads indicate that the morphology (size
and shape) of the glands were consistent across an individual’s lifetime. Additionally, we found significant her-
itability of parotoid sizes and shapes among offspring raised in standardised conditions (above), a result that
would not be expected if gland morphology was sensitive to disruption by environmental factors (although
such effects likely were minimised in our study, because offspring were raised under standardised conditions).
Our estimates of heritability (26 to 32%) are higher than those we have calculated for other morphological traits
of these t oads37, but are similar to published estimates of heritability of morphological traits more g enerally41.
Even if variation in parotoid size is driven by heritable factors, it might not be adaptive. Biological invasions
often involve successive founder effects, increasing the likelihood that gene frequencies will be affected by non-
adaptive processes such as genetic d rift42. In keeping with that scenario, the Hawai’ian populations were founded
Scientific Reports | (2021) 11:936 | https://doi.org/10.1038/s41598-020-80191-7 3
Vol.:(0123456789)www.nature.com/scientificreports/
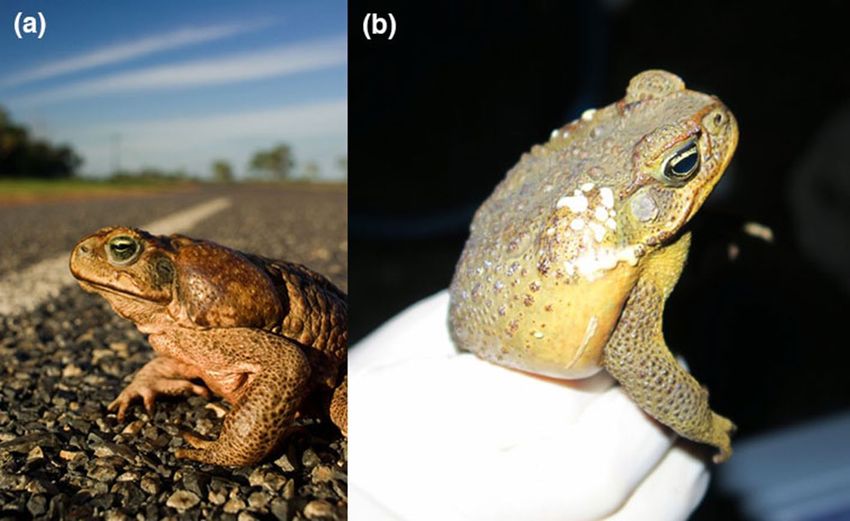
Figure 1. Parotoid macroglands in adult cane toads. (a) An adult female male cane toad showing parotoid
gland, and (b) an adult male cane toad exuding toxin from parotoid glands following capture. Photographs by
Cameron Hudson.
by a maximum of 150 individuals, and the Australian populations by a maximum of 101 animals43. However,
existing populations both in Hawai’i and Australia contain thousands or millions of individuals, reducing the
impact of random effects on gene frequencies. Thus, the consistent pattern for smaller and more rounded paro-
toids in the native range than in the invaded range (see Fig. 2a) suggests that geographic variation in parotoid
size likely is driven at least partly by deterministic processes (i.e., adaptation).
If variation in levels of investment into parotoid macroglands is indeed driven by natural selection, what
selective forces are likely to have been important? The evidence that these glands function to deter predator
attacks is conclusive (see above), but the parotoids might have other functions as well. For example, the glands
contain hydrophilous glycosaminoglycans that could provide a store of water during long dry periods30,44. We
doubt the importance of hydroregulation, however, because the two regions where parotoids were largest (Maui
wet-side and New South Wales; Fig. 2a) experience moister climates than most of the other regions from which
toads were sampled ( see45 for climatic data). Thus, the most likely selective force driving geographic variation in
size of the parotoid glands involves defence against predators.
We first consider the case of males, because their investment into toxins should be driven only by vulner-
ability to predators of adult toads (whereas investment by females reflects the need for additional allocation to
the offspring). The overall pattern for males is straightforward, with low investment in the native range and on
the dry sides of Hawai’ian islands, and higher everywhere else (Fig. 2a). Increased parotoid size in Australian
populations is consistent with the putatively higher predation pressure in these areas (see above), but available
information about predation on cane toads in Hawai’i is too meagre to suggest an explanation for the higher
investment into parotoids on wet-side Maui populations.
A female toad’s investment into toxin stores should incorporate two components: the amount needed for her
own defence against predation, and the toxins that she needs to allocate to her e ggs28. However, the optimal allo-
cation of toxins to eggs is complicated by geographic variation in the incidence of cannibalism, which is frequent
in Australian cane t oads46,47 but is infrequent in the native range (DeVore et al., unpublished data). Cannibalistic
conspecific tadpoles locate eggs by detecting toxins exuded during late stages of egg d evelopment46; and thus, a
higher investment of toxins into the eggs may render a female’s offspring more vulnerable to cannibalistic attack
by conspecifics but less vulnerable to predation by other taxa such as fish and t urtles48,49.
The disparity between parotoid sizes in female versus male cane toads offers an approximate index of the
allocation of toxins to eggs. That disparity is low in the native range (where local predators have evolved to toler-
ate bufonid toxins, reducing the effectiveness of toxins as a defence) and in Queensland (where larvae are highly
cannibalistic, and most clutches are laid in waterbodies that already contain such larvae). However, females
from Maui and the dry side of O’ahu also have relatively small parotoids (Fig. 2a), for no obvious reason. In
contrast, the sexual disparity in favour of females is maximal in New South Wales, where cannibalism may be
infrequent at the invasion front (due to low densities of toads) and embryonic development is slow (due to low
water temperatures), increasing the duration of time for which eggs are vulnerable to other types of predators.
Field studies are needed to identify selective forces on optimal allocation of toxins to eggs, by quantifying rates
of predation (including cannibalism) of toad eggs across the cane toads’ geographic range.
Throughout the manuscript, we have considered cane toad parotoid gland morphology as a proxy for toxin
production, and hence anti-predator defence capabilities. While it is likely that toads with larger glands produce
more toxin by volume (and invest more energy in doing so), it is possible that divergent selective forces are oper-
ating on toxicity or chemical composition of the macrogland secretions as well. For example, in environments
Scientific Reports | (2021) 11:936 | https://doi.org/10.1038/s41598-020-80191-7 4
Vol:.(1234567890)www.nature.com/scientificreports/
0.2 (a) Relative parotoid size Female
Male
0.15
residuals ln parotoid area vs ln SVL
0.1
0.05
0
-0.05
-0.1
-0.15
-0.2
0.9 (b) Parotoid shape
0.85
ratio width/length parotoids
0.8
0.75
0.7
0.65
0.6
FG HI HI MA MA OH OH QLD NSW NT WA
dry wet dry wet dry wet
Australia
native Hawai'i
range
Figure 2. Geographic variation in the size (a) and shape (b) of parotoid macroglands in field-collected cane
toads (Rhinella marina). FG French Guiana, HI Hawai’i, MA Maui, OH O’ahu, QLD Queensland, NSW New
South Wales, NT Northern Territory, WA Western Australia. Statistical tests to calculate means derived using
JMP 14 software (SAS Institute, Cary, NC).
where toads frequently encounter naïve predators (i.e., the invaded range), they may require greater volumes
of toxin if they exude often as a deterrent in response to harassment. Conversely, in habitats where predators
are resistant to toad t oxins20, as is expected with co-evolved predators in the native-range, selection may act to
increase toxicity or alter the composition of parotoid exudate, leading to reciprocal adaptation between predator
and prey. Previous work has shown that local adaptation to predation regime or climatic factors can influence
both the chemical composition of amphibian toxins, and their p otency50,51. Therefore, comparisons of the paro-
toid secretions of cane toads throughout their native and invasive ranges would be an illuminating avenue for
future research, and may provide a more nuanced picture of the evolution of anti-predator investments during
colonization of new habitats.
In summary, invasive species provide excellent models for studying anti-predator adaptations; the invader
arrives with phenotypes that have evolved elsewhere, and may experience different selective forces in colonized
habitats than in their native range. The fitness benefits of investment into anti-predator traits can vary greatly in
novel environments, generating selection to fine-tune levels of investment depending on cost–benefit trade-offs
in local environments. By comparing introduced populations to those within the native range, we can study
phenotypic adaptations to geographically variable predation regimes, and explore rapid evolution in response
to novel selection pressures. Research on invasive species also allows us to explore the impacts of range spread
Scientific Reports | (2021) 11:936 | https://doi.org/10.1038/s41598-020-80191-7 5
Vol.:(0123456789)www.nature.com/scientificreports/
on phenotypic traits, with investment into anti-predator traits likely trading off with dispersal rate as well as
with protection against predators. Overall, strong geographic variation in size, shape and sexual dimorphism of
the parotoid macroglands in cane toads supports the hypothesis that investment into defence against predation
is fashioned by a complex interplay among selective forces, acting across multiple life-history stages, and that
shifts in selective forces can rapidly change investment optima, and thus modify heritable variation in allocation
of resources towards anti-predator adaptations.
Materials and methods
Study system. Many bufonids (“true toads”) possess paired postorbital macroglands known as parotoids18,52
that produce cardiotonic steroids such as bufogenins and b ufotoxins50,53–55. These toxins have cardio-accelera-
tory and vasopressor effects on v ertebrates52,56, such that ingestion can be lethal for p redators57–59. In cane toads
(Rhinella marina), this toxin is contained both within the parotoids and a series of smaller glands that are dis-
tributed on the dorsal surface and limbs17. The cane toad uses the toxin as a passive defence, exuding it when
stressed (Fig. 1); predators also may be poisoned by biting into the glands.
The cane toad was introduced from French Guiana to Puerto Rico in the early 1900s, and from there to
Hawai’i in 1932, and from there to Australia in 1935 (see60 for genetic evidence of this translocation route).
Since these introductions, the cane toad has become widely distributed across Hawai’i25 and Australia43,61,62.
Invertebrate predators of eggs and larvae are common in both countries, but predation on adult toads is higher
in Australia than in Hawai’i19,25.
Specimen capture and collection sites. From August 2013 to September 2016 we collected adult cane
toads (≥ 90 mm snout-vent length, = SVL: s ee36,37) from sites in their native range in French Guiana (N = 302
toads), across their invaded Australian range (QLD, N = 504; NT, N = 929; WA, N = 845; NSW, N = 182) and
the Pacific islands of Hawai’i, O’ahu and Maui. We treated the “wet” and “dry” sides of the Hawai’ian islands as
separate sampling units, because the climatic divergence between windward and leeward shores within an island
is greater than inter-island differences in climatic regimes25,63; sample sizes Hawai’i dry-side N = 286, wet-side
244; Maui dry-side N = 95, wet-side 66; O’ahu dry-side N = 126, wet-side 200). Toads were captured by hand, and
we used Vernier callipers (± 0.1 mm) to measure the SVL of the toad, and the length (PL) and width (PW) of
its right parotoid macrogland. We also measured limb lengths with a plastic ruler ( see36,37 for details). Sex was
determined by secondary sexual characteristics64.
Effect of toxin expulsion on dimensions of the parotoids. If expulsion of toxin alters the size or
shape of the parotoids, measurements of these glands on field-caught toads might be affected by local rates of
predator attack. Such an effect could introduce significant variation into data for any given population, weaken-
ing our ability to detect broader patterns. As part of another study, we manually expressed toxins from the paro-
toid macroglands of 16 toads, and sham-manipulated another 20 animals to serve as controls. The two groups
were matched for overall body sizes. Following toxin removal treatment, toads were radio-tracked for 5 days and
then recaptured and their glands and body size measured (see16 for details).
Assessment of heritability of parotoid morphology. Australian toads captured from the wild were
brought to our field station 66 km southeast of Darwin, NT (12°37′S 131°18′E) where they were bred. We raised
the resultant offspring under standard conditions, to reduce the influence of environmental factors on morphol-
ogy. The adult toads were collected from three sites in north-eastern Queensland (Townsville, 19°26′S 146°82′E,
Innisfail, 17°52′S 146°03′E, and Tully, 17°93′S 145°92′E) and four sites in northern Western Australia (El Ques-
tro, 16°00′S 127°98′E, Purnululu, 17°53′S 128°40′E, Wyndham, 15°46′S 128°10′E, and Oombulgurri, 15°18′S
127°84′E). Toads had been present in all of the QLD sites for > 70 years, but had only recently colonized the WA
sites (< 2 years65). We induced spawning by injection of leuprorelin acetate (Lucrin; Abbott Australasia; using
1 mL of Lucrin diluted 1:20 with saline) and raised the progeny in captivity using the protocols described b y66.
After post-metamorphic toads attained body lengths > 20 mm, we toe-clipped them for identification (a pro-
cedure that causes minimal stress to the a nimals67) and kept them in outdoor enclosures in groups of 30 (with
mixed parental origins). We raised “common garden” toads from 31 egg clutches (16 QLD, 15 WA) totalling 489
offspring (287 QLD, 202 WA). The offspring were measured three times (at approximately 8, 14, and 17 months
of age); 196 animals (132 from QLD, 64 from WA) had reached adult size (> 90 mm SVL) by the end of this study.
Our heritability analyses are based on data from 61 parents and 317 offspring > 60 mm SVL, each measured one
to three times.
Calculations and statistical analyses. Morphology of the parotoid glands. To obtain an estimate
of overall size of the glands, we calculated an approximate area by treating parotoids as rectangular in shape
(length*width). That method slightly overestimates area for rounded shapes but the error is small, and is similar
among all samples (calculating the area as a circle, based on mean radius, yields a score that is almost perfectly
correlated with the rectangular approximation: r2 = 0.997). We then ln-transformed values of parotoid area and
body length to achieve normality, and regressed ln parotoid area against ln body length to obtain residual scores
(deviations from the average parotoid size expected at any given body length) that we used as indices of rela-
tive parotoid size (i.e., a high score represents a larger-than-usual parotoid for an animal of that body length).
To quantify shape of the parotoids, we divided the width measurement by the length measurement; thus, high
scores indicate more rounded shapes. We did not correct for allometry in this measure because our index of
parotoid shape was not strongly related to body length in either sex ( r2 = 0.006 for females, r 2 < 0.0001 for males).
Scientific Reports | (2021) 11:936 | https://doi.org/10.1038/s41598-020-80191-7 6
Vol:.(1234567890)www.nature.com/scientificreports/
Mean Parotoid Mean Parotoid
Sex Location Region Latitude Longitude N Mean SVL ± SE (mm) Length ± SE (mm) Width ± SE (mm)
Fem Border Ranges Australia (NSW) −28.407525 153.08541 33 110.1 ± 2.1 26.7 ± 0.7 19.5 ± 0.5
Fem Borroloola Australia (NSW) −16.6913889 136.2769444 13 104.1 ± 4.0 23.5 ± 1.0 19.0 ± 1.0
Fem Broom’s Head Australia (NSW) −29.608228 153.3358185 19 110.6 ± 2.7 27.1 ± 0.9 21.8 ± 0.9
Fem Cairns Australia (QLD) −16.920334 145.7708595 41 108.2 ± 1.1 25.8 ± 0.4 19.2 ± 0.4
Fem Caroline Pool Australia (WA) −18.226814 127.759649 38 125.3 ± 1.3 30.6 ± 0.6 23.3 ± 0.4
Fem Charters Towers Australia (QLD) −20.050480 146.2538153 12 110.6 ± 2.6 26.4 ± 1.1 20.0 ± 0.8
Fem Darwin Botanic Gardens Australia (NT) −12.444302 130.836995 18 102.3 ± 2.9 24.0 ± 1.1 18.0 ± 0.8
Fem Durack River Crossing Australia (WA) −15.94548429 127.2213364 38 115.6 ± 1.6 27.6 ± 0.6 22.5 ± 0.5
Fem El Questro Station Australia (WA) −16.008438 127.979811 65 113.3 ± 1.4 27.1 ± 0.5 20.0 ± 0.3
Fem Ellenbrae Station Australia (WA) −15.9743433 127.0621375 26 121.3 ± 2.0 28.9 ± 0.6 23.4 ± 0.5
Fem Fogg Dam Australia (NT) −12.568032 131.309507 91 123.3 ± 1.6 29.4 ± 0.5 23.4 ± 0.4
Fem Innisfail Australia (QLD) −17.524681 146.0323287 54 109.2 ± 1.4 25.2 ± 0.5 19.1 ± 0.4
Fem Kakadu Australia (NT) −13.092293 132.393766 72 120.6 ± 1.2 27.7 ± 0.4 22.5 ± 0.3
Fem Katherine Australia (NT) −14.464967 132.2642561 38 114.9 ± 2.8 27.5 ± 0.8 21.2 ± 0.7
Fem Kununurra Australia (WA) −15.773546 128.739196 20 113.8 ± 2.6 26.8 ± 0.7 20.8 ± 0.6
Fem Kyogle Australia (NSW) −28.620356 153.0040612 22 117.3 ± 3.1 29.5 ± 1.2 22.2 ± 0.8
Fem Leaning Tree Lagoon Australia (NT) −12.709088 131.420238 109 115.7 ± 1.7 27.2 ± 0.5 20.9 ± 0.5
Fem Litchfield Australia (NT) −13.293538 130.846388 39 106.0 ± 2.3 24.9 ± 0.7 20.0 ± 0.5
Fem Mount Isa Australia (QLD) −20.7247053 139.4974616 29 122.9 ± 2.5 30.5 ± 0.9 23.5 ± 0.8
Fem Oombulgurri Australia (WA) −15.180417 127.8450389 102 120.2 ± 1.1 28.0 ± 0.3 21.8 ± 0.3
Fem Palm Hand Creek Australia (WA) −18.026354 127.804047 25 118.5 ± 1.7 28.7 ± 0.5 21.9 ± 0.5
Fem Pine Creek Australia (NT) −13.8248434 131.8349128 12 114.5 ± 3.3 27.3 ± 1.0 20.0 ± 0.8
Fem Purnululu Australia (WA) −17.529752 128.400838 59 107.0 ± 1.6 24.9 ± 0.4 18.7 ± 0.4
Fem Timber Creek Australia (NT) −15.6502331 130.4777132 40 112.4 ± 1.6 26.2 ± 0.5 21.3 ± 0.4
Fem Townsville Australia (QLD) −19.257627 146.8178707 85 107.3 ± 0.9 24.6 ± 0.3 19.2 ± 0.2
Fem Tully Australia (QLD) −17.932869 145.9235556 48 105.8 ± 1.8 25.1 ± 0.6 18.7 ± 0.5
Fem Wave Hill Australia (NT) −17.7158333 130.9457445 17 96.6 ± 1.2 21.9 ± 0.6 17.1 ± 0.4
Fem Wyndham Australia (WA) −15.464803 128.1001426 59 114.3 ± 1.9 26.6 ± 0.5 20.6 ± 0.5
Fem Yamba Australia (NSW) −29.437827 153.3602722 23 107.1 ± 2.6 26.0 ± 0.9 20.1 ± 0.5
Male Border Ranges Australia (NSW) −28.407525 153.08541 35 101.7 ± 1.0 23.6 ± 0.4 16.6 ± 0.3
Male Borroloola Australia (NSW) −16.6913889 136.2769444 29 105.5 ± 1.4 25.1 ± 0.5 18.4 ± 0.3
Male Broom’s Head Australia (NSW) −29.608228 153.3358185 17 104.5 ± 1.5 26.2 ± 0.8 18.3 ± 0.5
Male Cairns Australia (QLD) −16.920334 145.7708595 38 102.4 ± 1.0 24.6 ± 0.4 17.3 ± 0.3
Male Caroline Pool Australia (WA) −18.226814 127.759649 55 115.5 ± 0.8 28.8 ± 0.4 20.6 ± 0.3
Male Charters Towers Australia (QLD) −20.050480 146.2538153 15 104.4 ± 1.7 26.3 ± 0.7 17.1 ± 0.4
Male Darwin Botanic Gardens Australia (NT) −12.444302 130.836995 22 107.1 ± 2.0 25.2 ± 0.9 18.2 ± 0.4
Male Durack River Crossing Australia (WA) −15.94548429 127.2213364 43 110.0 ± 0.9 26.7 ± 0.4 19.8 ± 0.3
Male El Questro Station Australia (WA) −16.008438 127.979811 41 106.7 ± 1.4 25.4 ± 0.5 17.9 ± 0.3
Male Ellenbrae Station Australia (WA) −15.9743433 127.0621375 24 114.4 ± 1.6 27.7 ± 0.5 19.9 ± 0.3
Male Fogg Dam Australia (NT) −12.568032 131.309507 65 116.0 ± 1.4 28.0 ± 0.4 20.2 ± 0.3
Male Innisfail Australia (QLD) −17.524681 146.0323287 34 105.1 ± 1.3 26.3 ± 0.6 17.4 ± 0.3
Male Kakadu Australia (NT) −13.092293 132.393766 74 116.9 ± 0.9 27.8 ± 0.3 20.0 ± 0.2
Male Katherine Australia (NT) −14.464967 132.2642561 34 111.5 ± 2.0 26.4 ± 0.5 19.9 ± 0.4
Male Kununurra Australia (WA) −15.773546 128.739196 26 107.3 ± 1.5 24.7 ± 0.6 18.5 ± 0.4
Male Kyogle Australia (NSW) −28.620356 153.0040612 17 103.4 ± 1.3 24.9 ± 0.5 17.0 ± 0.4
Male Leaning Tree Lagoon Australia (NT) −12.709088 131.420238 173 110.8 ± 0.6 27.0 ± 0.2 19.4 ± 0.2
Male Litchfield Australia (NT) −13.293538 130.846388 33 109.2 ± 1.9 25.8 ± 0.5 19.9 ± 0.4
Male Mount Isa Australia (QLD) −20.7247053 139.4974616 37 107.1 ± 1.5 27.5 ± 0.6 18.6 ± 0.5
Male Oombulgurri Australia (WA) −15.180417 127.8450389 85 110.1 ± 0.9 26.8 ± 0.3 19.3 ± 0.2
Male Palm Hand Creek Australia (WA) −18.026354 127.804047 14 109.7 ± 3.1 26.0 ± 1.2 19.4 ± 0.6
Male Pine Creek Australia (NT) −13.8248434 131.8349128 7 105.5 ± 3.5 26.0 ± 1.4 17.8 ± 0.6
Male Purnululu Australia (WA) −17.529752 128.400838 41 104.1 ± 1.2 24.7 ± 0.4 17.2 ± 0.3
Male Timber Creek Australia (NT) −15.6502331 130.4777132 22 109.5 ± 1.2 25.4 ± 0.5 19.6 ± 0.3
Male Townsville Australia (QLD) −19.257627 146.8178707 68 101.4 ± 0.8 24.3 ± 0.3 17.0 ± 0.2
Male Tully Australia (QLD) −17.932869 145.9235556 43 98.8 ± 1.1 23.5 ± 0.4 16.5 ± 0.2
Male Wave Hill Australia (NT) −17.7158333 130.9457445 57 107.3 ± 1.1 25.7 ± 0.4 18.9 ± 0.2
Continued
Scientific Reports | (2021) 11:936 | https://doi.org/10.1038/s41598-020-80191-7 7
Vol.:(0123456789)www.nature.com/scientificreports/
Mean Parotoid Mean Parotoid
Sex Location Region Latitude Longitude N Mean SVL ± SE (mm) Length ± SE (mm) Width ± SE (mm)
Male Wyndham Australia (WA) −15.464803 128.1001426 47 104.8 ± 1.1 24.7 ± 0.4 17.4 ± 0.3
Male Yamba Australia (NSW) −29.437827 153.3602722 17 95.7 ± 1.4 23.1 ± 0.6 15.9 ± 0.5
Fem Kourou Atlantis French Guiana 5.15715438 −52.64640525 12 105.5 ± 2.4 23.5 ± 0.8 18.7 ± 0.7
Fem Remire-Montjoly Beach N French Guiana 4.917072768 −52.26695448 9 120.1 ± 4.1 26.8 ± 0.9 22.0 ± 0.8
Fem Remire-Montjoly Beach S French Guiana 4.890092298 −52.25395113 49 110.0 ± 2.1 24.2 ± 0.7 19.7 ± 0.5
Fem St. Georges French Guiana 3.900456271 −51.80153087 6 110.6 ± 5.8 25.6 ± 2.1 21.9 ± 1.7
Fem Yalimapo Beach French Guiana 5.746320083 −53.94172579 7 135.4 ± 7.5 30.0 ± 1.9 25.9 ± 1.9
Male Kourou Atlantis French Guiana 5.15715438 −52.64640525 48 103.9 ± 1.9 23.3 ± 0.7 17.5 ± 0.6
Male Remire-Montjoly Beach N French Guiana 4.917072768 −52.26695448 36 106.7 ± 1.3 24.0 ± 0.5 18.0 ± 0.3
Male Remire-Montjoly Beach S French Guiana 4.890092298 −52.25395113 88 109.1 ± 1.2 24.6 ± 0.4 18.2 ± 0.3
Male St. Georges French Guiana 3.900456271 −51.80153087 40 125.9 ± 3.2 30.2 ± 1.1 23.5 ± 0.7
Male Yalimapo Beach French Guiana 5.746320083 −53.94172579 7 126.9 ± 4.1 30.1 ± 1.5 23.0 ± 0.9
Fem Hilo Hawai’i (Wet) 19.700250 −155.081687 89 109.3 ± 1.7 25.7 ± 0.6 19.8 ± 0.4
Fem Pahoa Hawai’i (Wet) 19.4975033 −154.9508104 13 99.6 ± 2.1 24.8 ± 0.8 18.8 ± 0.6
Fem Panewa Zoo Hawai’i (Wet) 19.653754 −155.073764 11 99.6 ± 2.5 22.2 ± 0.6 17.9 ± 0.7
Fem Tom’s Volcano Ranch Hawai’i (Wet) 19.5437679 −155.131557 5 101.5 ± 3.7 24.1 ± 1.1 19.4 ± 1.0
Fem Big Island Country Club Hawai’i (Dry) 19.822272 −155.844169 9 108.5 ± 2.8 26.8 ± 1.1 20.3 ± 0.6
Fem King’s Shops Hawai’i (Dry) 19.916323 −155.88209 48 110.8 ± 1.9 26.3 ± 0.7 19.7 ± 0.5
Fem Kona Hawai’i (Dry) 19.5711075 −155.957051 14 125.2 ± 4.6 27.7 ± 1.0 21.2 ± 0.9
Fem Mauna Kea Golf Course Hawai’i (Dry) 20.003944 −155.820113 72 121.1 ± 1.4 27.7 ± 0.5 20.6 ± 0.4
Fem Iao Maui (Wet) 20.91 −156.49 31 113.0 ± 2.6 28.3 ± 0.8 20.5 ± 0.6
Fem Wailua Maui (Wet) 20.8245438 −156.0909414 5 99.3 ± 3.7 24.7 ± 1.3 18.3 ± 1.6
Fem Kaanapali Golf Course Maui (Dry) 20.9159 −156.692446 30 112.2 ± 1.6 27.5 ± 0.5 19.6 ± 0.5
Fem Makena Maui (Dry) 20.65884 −156.437698 18 115.1 ± 3.6 28.7 ± 1.1 19.4 ± 0.8
Fem BYU Campus La’ie O’ahu (Wet) 21.641842 −157.925354 22 117.4 ± 3.2 30.0 ± 0.9 21.5 ± 0.8
Fem Haiku Gardens O’ahu (Wet) 21.4167622 −157.8138132 34 108.8 ± 2.0 26.9 ± 0.7 20.2 ± 0.6
Fem Kailua O’ahu (Wet) 21.372767 −157.7325974 26 114.1 ± 3.3 26.7 ± 1.0 19.5 ± 0.6
Fem Kalaeoio Beach Park O’ahu (Wet) 21.547254 −157.847012 6 130.5 ± 3.4 30.2 ± 1.4 25.4 ± 2.4
Fem Lyon Arboretum O’ahu (Wet) 21.332976 −157.801573 4 124.7 ± 6.9 35.6 ± 2.2 23.2 ± 1.6
Fem Kapolei Regional Park O’ahu (Dry) 21.335617 −158.077933 35 111.2 ± 1.7 27.9 ± 0.5 20.2 ± 0.5
Fem Mililani O’ahu (Dry) 21.46433186 −158.0219578 25 123.3 ± 2.6 31.7 ± 0.9 24.2 ± 0.8
Fem Wahiawa O’ahu (Dry) 21.5010495 −158.029227 7 105.3 ± 3.6 23.8 ± 1.3 17.0 ± 0.9
Male Hilo Hawai’i (Wet) 19.700250 −155.081687 65 98.0 ± 1.0 22.7 ± 0.3 16.3 ± 0.3
Male Pahoa Hawai’i (Wet) 19.4975033 −154.9508104 14 101.8 ± 2.0 25.7 ± 0.9 17.6 ± 0.4
Male Panaewa Zoo Hawai’i (Wet) 19.653754 −155.073764 33 103.4 ± 1.2 25.1 ± 0.4 16.9 ± 0.3
Male Tom’s Volcano Ranch Hawai’i (Wet) 19.5437679 −155.131557 14 95.1 ± 1.4 22.1 ± 0.5 15.8 ± 0.4
Male Big Island Country Club Hawai’i (Dry) 19.822272 −155.844169 30 106.0 ± 1.1 24.8 ± 0.4 16.3 ± 0.3
Male King’s Shops Hawai’i (Dry) 19.916323 −155.88209 30 99.5 ± 1.3 22.6 ± 0.5 15.3 ± 0.3
Male Kona Hawai’i (Dry) 19.5711075 −155.957051 21 108.5 ± 2.8 24.4 ± 0.9 17.3 ± 0.6
Male Mauna Kea Golf Course Hawai’i (Dry) 20.003944 −155.820113 62 110.2 ± 0.9 26.1 ± 0.3 16.5 ± 0.2
Male Iao Maui (Wet) 20.91 −156.49 26 113.0 ± 2.6 28.3 ± 0.8 20.5 ± 0.6
Male Wailua Maui (Wet) 20.8245438 −156.0909414 4 99.3 ± 3.7 24.7 ± 1.3 18.3 ± 1.6
Male Kaanapali Golf Course Maui (Dry) 20.9159 −156.692446 29 108.2 ± 1.8 27.6 ± 0.7 18.4 ± 0.4
Male Makena Maui (Dry) 20.65884 −156.437698 18 104.2 ± 1.9 25.7 ± 0.6 16.8 ± 0.4
Male BYU Campus La’ie O’ahu (Wet) 21.641842 −157.925354 32 107.8 ± 1.7 26.7 ± 0.6 17.3 ± 0.4
Male Haiku Gardens O’ahu (Wet) 21.4167622 −157.8138132 50 105.1 ± 1.0 26.4 ± 0.4 17.7 ± 0.2
Male Kailua O’ahu (Wet) 21.372767 −157.7325974 19 107.6 ± 2.2 26.1 ± 0.8 16.5 ± 0.6
Male Kalaeoio Beach Park O’ahu (Wet) 21.547254 −157.847012 4 116.2 ± 2.9 32.1 ± 2.0 19.8 ± 0.5
Male Lyon Arboretum O’ahu (Wet) 21.332976 −157.801573 3 116.0 ± 2.5 32.0 ± 1.6 21.7 ± 1.0
Male Kapolei Regional Park O’ahu (Dry) 21.335617 −158.077933 27 109.7 ± 1.9 29.6 ± 0.9 19.3 ± 0.5
Male Mililani O’ahu (Dry) 21.46433186 −158.0219578 24 115.1 ± 0.9 30.0 ± 0.7 20.3 ± 0.3
Male Wahiawa O’ahu (Dry) 21.5010495 −158.029227 8 103.3 ± 2.1 24.7 ± 0.7 16.7 ± 0.6
Table 1. Sample sizes, body sizes and parotoid sizes of adult cane toads (Rhinella marina) collected from
the field for the present study. Fem female, SVL snout-vent length, NSW New South Wales, QLD Queensland,
WA Western Australia, NT Northern Territory.
Scientific Reports | (2021) 11:936 | https://doi.org/10.1038/s41598-020-80191-7 8
Vol:.(1234567890)www.nature.com/scientificreports/
For analyses of geographic variation, we recognized 11 major regions (although we retained information on
collection sites within each region, and used this as a random factor in our statistical analyses to avoid pseudorep-
lication): (1) all French Guiana sites; (2) Wet (windward) sides of each of three Hawai’ian islands (Hawai’i, O’ahu,
Maui); (3) Dry (leeward, rain shadow) sides of each of the same three islands; and four states within Australia:
(4) Queensland, (5) New South Wales, (6) Northern Territory, and (7) Western Australia. Table 1 shows sample
sizes and associated information for all 54 collection sites. We compared parotoid dimensions between sexes
and among regions using a two-factor ANOVA with sex and region as factors, and population as a random vari-
able (to avoid treating toads from the same collection site as statistically independent). All other analyses were
performed using JMP 14 software (SAS Institute, Cary, NC). We assessed residuals from all analyses to detect
violations of assumptions.
Common‑garden offspring. We measured the animals in the same way as for field-collected specimens, and cal-
culated the same variables as above to describe parotoid size and shape. We excluded measurements of individu-
als < 60 mm SVL (because of imprecision in measuring such small animals). To estimate heritability and repeat-
ability of size and shape of the parotoids, we used ASREML software (VSN International Ltd., Hemel Hempstead,
UK) to run an animal model68 incorporating individual ID and family ID as random effects.
Ethics statement. All procedures in the current study were approved by the University of Sydney Animal
Care and Ethics Committee (permit numbers 2013/6075, 2017/1195, and 2018/1441), and carried out in accord-
ance with ARRIVE guidelines and with all other relevant guidelines and regulations. Field work in Hawai’i was
conducted with approval from the State of Hawai’i Department of Land and Natural Resources, Division of For-
estry and Wildlife (permit numbers Ex15-15 and Ex15-16). This article does not contain any studies performed
with human participants performed by any of the authors.
Data availability
Data can be found in the Dryad Data Repository at https://doi.org/10.5061/dryad.rn8pk0p8j.
Received: 13 October 2020; Accepted: 14 December 2020
References
1. Caro, T. M. Antipredator Defenses in Birds and Mammals (University of Chicago Press, 2005).
2. Emlen, D. J. The evolution of animal weapons. Annu. Rev. Ecol. Evol. Syst. 39, 387–413 (2008).
3. Toledo, L. F., Sazima, I. & Haddad, C. F. Behavioural defences of anurans: An overview. Ethol. Ecol. Evol. 23, 1–25 (2011).
4. Lima, S. L. & Dill, L. M. Behavioral decisions made under the risk of predation: A review and prospectus. Can. J. Zool. 68, 619–640
(1990).
5. Pettorelli, N., Coulson, T., Durant, S. M. & Gaillard, J. Predation, individual variability and vertebrate population dynamics.
Oecologia 167, 305–314 (2011).
6. Stankowich, T. Armed and dangerous: predicting the presence and function of defensive weaponry in mammals. Adapt. Behav.
20, 32–43 (2011).
7. Longson, C. G. & Joss, J. M. P. Optimal toxicity in animals: Predicting the optimal level of chemical defences. Funct. Ecol. 20,
731–735 (2006).
8. Relyea, R. A. Predators come and predators go: The reversibility of predator-induced traits. Ecology 84, 1840–1848 (2003).
9. Tollrian, R. & Harvell, D. The Ecology and Evolution of Inducible Defenses (Princeton University Press, 1999).
10. Daly, D., Higginson, A. D., Chen, D., Ruxton, G. D. & Speed, M. P. Density-dependent investment in costly anti-predator defenses:
An explanation for the weak survival benefit of group living. Ecol. Lett. 15, 576–583 (2012).
11. Kosmala, G., Brown, G. P. & Shine, R. Thin-skinned invaders: Geographic variation in the structure of the skin among populations
of cane toads (Rhinella marina). Biol. J. Linn. Soc. 131, 611–621 (2020).
12. Duellman, W. E. & Trueb, L. Biology of Amphibians (McGraw-Hill, 1994).
13. Wells, K. The Ecology and Behavior of Amphibians (University of Chicago Press, 2007).
14. König, E., Bininda-Emonds, O. R. P. & Shaw, C. The diversity and evolution of anuran skin peptides. Peptides 63, 96–117 (2014).
15. Hettyey, A., Tóth, Z. & Van Buskirk, J. Inducible chemical defences in animals. Oikos 123, 1025–1028 (2014).
16. Blennerhasset, R., Bell-Anderson, K., Shine, R. & Brown, G. P. The cost of chemical defence: The impact of toxin depletion on
growth and behaviour of cane toads (Rhinella marina). Proc. R. Soc. B. 286, 20190867 (2019).
17. Chen, W., Hudson, C. M., DeVore, J. L. & Shine, R. Sex and weaponry: The distribution of toxin-storage glands on the bodies of
male and female cane toads (Rhinella marina). Ecol. Evol. 7, 8950–8957 (2017).
18. O’Donohoe, M. A. et al. Diversity and evolution of the parotoid macrogland in true toads (Anura: Bufonidae). Zool. J. Linn. Soc.
187, 453–478 (2019).
19. Shine, R. The ecological impact of invasive cane toads (Bufo marinus) in Australia. Q. Rev. Biol. 85, 253–291 (2010).
20. Ujvari, B. et al. Isolation breeds naivety: island living robs Australian varanid lizards of toad-toxin immunity via four-base-pair
mutation. Evolution 67, 289–294 (2013).
21. Pearcy, A. Selective feeding in Keelback snakes Tropidonophis mairii in an Australian wetland. Aust. Zool. 35, 843–845 (2011).
22. Llewelyn, J. et al. Behavioural responses of an Australian colubrid snake (Dendrelaphis punctulatus) to a novel toxic prey item (the
Cane Toad Rhinella marina). Biol. Invasions 20, 2507–2516 (2018).
23. van Bocxlaer, I. et al. Gradual adaptation toward a range-expansion phenotype initiated the global radiation of toads. Science 327,
679–682 (2010).
24. Hudson, C. M., Vidal-García, M., Murray, T. G. & Shine, R. The accelerating anuran: evolution of locomotor performance in cane
toads (Rhinella marina, Bufonidae) at an invasion front. Proc. R. Soc. B 287, 20201964 (2020).
25. Ward-Fear, G., Greenlees, M. J. & Shine, R. Toads on lava: spatial ecology and habitat use of invasive cane toads (Rhinella marina)
in Hawai’i. PLoS ONE 11, e0151700 (2016).
26. Ward-Fear, G., Pearson, D. J., Brown, G. P. & Shine, R. Ecological immunization: in situ training of free-ranging predatory lizards
reduces their vulnerability to invasive toxic prey. Biol. Lett. 12, 20150863 (2016).
27. Crossland, M. R., Brown, G. P., Anstis, M., Shilton, C. & Shine, R. Mass mortality of native anuran tadpoles in tropical Australia
due to the invasive cane toad (Bufo marinus). Biol. Conserv. 141, 2387–2394 (2008).
Scientific Reports | (2021) 11:936 | https://doi.org/10.1038/s41598-020-80191-7 9
Vol.:(0123456789)www.nature.com/scientificreports/
28. Hayes, R. A., Crossland, M. R., Hagman, M., Capon, R. J. & Shine, R. Ontogenetic variation in the chemical defences of cane toads
(Bufo marinus): Toxin profiles and effects on predators. J. Chem. Ecol. 35, 391–399 (2009).
29. Hagman, M., Hayes, R. A., Capon, R. J. & Shine, R. Alarm cues experienced by cane toad tadpoles affect post-metamorphic mor-
phology and chemical defences. Funct. Ecol. 23, 126–132 (2009).
30. Üveges, B. et al. Age-and environment-dependent changes in chemical defences of larval and post-metamorphic toads. BMC Evol.
Biol. 17, 137 (2017).
31. Üveges, B. et al. Chemical defense of toad tadpoles under risk by four predator species. Ecol. Evol. 9, 6287–6299 (2019).
32. Bókony, V., Üveges, B., Verebélyi, V., Ujhegyi, N. & Móricz, Á. M. Toads phenotypically adjust their chemical defences to anthro-
pogenic habitat change. Sci. Rep. 9, 3163 (2019).
33. Hettyey, A. et al. Predator-induced changes in the chemical defence of a vertebrate. J. Anim. Ecol. 88, 1925–1935 (2019).
34. Hudson, C. M, Brown, G. P., Stuart, K. & Shine, R. Sexual and geographic divergence in head widths of invasive cane toads, Rhinella
marina (Anura: Bufonidae) is driven by both rapid evolution and plasticity. Biol. J. Linn. Soc. 124, 188–199 (2018).
35. Phillips, B. L., Brown, G. P., Webb, J. K. & Shine, R. Invasion and the evolution of speed in toads. Nature 439, 803 (2006).
36. Hudson, C. M., McCurry, M. R., Lundgren, P., McHenry, C. R. & Shine, R. Constructing an invasion machine: The rapid evolution
of a dispersal-enhancing phenotype during the cane toad invasion of Australia. PLoS ONE 11, e0156950 (2016).
37. Hudson, C. M., Brown, G. P. & Shine, R. It is lonely at the front: Contrasting evolutionary trajectories in male and female invaders.
R. Soc. Open Sci. 3, 160687 (2016).
38. Brown, G., Kelehear, C. & Shine, R. The early toad gets the worm: Cane toads at an invasion front benefit from higher prey avail-
ability. J. Anim. Ecol. 82, 854–862 (2013).
39. Shine, R., Brown, G. P. & Phillips, B. L. An evolutionary process that assembles phenotypes through space rather than time. Proc.
Natl Acad. Sci. USA 108, 5708–5711 (2011).
40. Phillips, B. & Shine, R. The morphology, and hence impact, of an invasive species (the cane toad, Bufo marinus) changes with time
since colonization. Anim. Conserv. 8, 407–413 (2005).
41. Roff, D. A. Comparing sire and dam estimates of heritability: Jackknife and likelihood approaches. Heredity 100, 32–38 (2008).
42. Kliber, A. & Eckert, C. G. Interaction between founder effect and selection during biological invasion in an aquatic plant. Evolution
59, 1900–1913 (2005).
43. Shine, R. Cane Toad Wars (University of California Press, 2018).
44. Toledo, R. C. & Jared, C. Cutaneous adaptations to water balance in amphibians. Comp. Biochem. Physiol. A 105, 593–608 (1993).
45. Kosmala, G., Brown, G. P., Shine, R. & Christian, K. Skin resistance to water gain and loss has changed in cane toads (Rhinella
marina) during their Australian invasion. Ecol. Evol. 10, 13071–13079 (2020).
46. Crossland, M. R. & Shine, R. Cues for cannibalism: Cane toad tadpoles use chemical signals to locate and consume conspecific
eggs. Oikos 120, 327–332 (2011).
47. DeVore, J. L., Crossland, M. & Shine, R. Tradeoffs affect the adaptive value of plasticity: Stronger cannibal-induced defenses incur
greater costs in toad larvae. Ecol. Monogr. https://doi.org/10.1002/ecm.1426 (2020).
48. Greenlees, M. J. & Shine, R. Impacts of eggs and tadpoles of the invasive cane toad (Bufo marinus) on aquatic predators in tropical
Australia. Austral Ecol. 36, 53–58 (2011).
49. Somaweera, R., Crossland, M. R. & Shine, R. Assessing the potential impact of invasive cane toads on a commercial freshwater
fishery in tropical Australia. Wildl. Res. 38, 380–385 (2011).
50. Cao, Y., Cui, K., Pan, H., Wu, J. & Wang, L. The impact of multiple climatic and geographic factors on the chemical defences of
Asian toads (Bufo gargarizans Cantor). Sci. Rep. 9, 17236 (2019).
51. Hague, M. T. J., Stokes, A. N., Feldman, C. R., Brodie, E. D. Jr. & Brodie, E. D. III. The geographic mosaic of arms race coevolution
is closely matched to prey population structure. Evol. Lett. 4, 317–332 (2020).
52. Jared, C. et al. Parotoid macroglands in toad (Rhinella jimi): Their structure and functioning in passive defence. Toxicon 54, 197–207
(2009).
53. Toledo, R. C. & Jared, C. Cutaneous granular glands and amphibian venoms. Comp. Biochem. Physiol. A 111, 1–29 (1995).
54. Maciel, N. M. et al. Composition of indolealkylamines of Bufo rubescens cutaneous secretions compared to six other Brazilian
bufonids with phylogenetic implications. Comp. Biochem. Physiol. B 134, 641–649 (2003).
55. Sciani, J. M., Angeli, C. B., Antoniazzi, M. M., Jared, C. & Pimenta, D. C. Differences and similarities among parotoid macrogland
secretions in South American toads: A preliminary biochemical delineation. Sci. World J. 2013, 937407 (2013).
56. Habermehl, G. Venomous Animals and Their Toxins (Springer-Verlag, 1981).
57. Garrett, C. M. & Boyer, D. M. Bufo marinus (cane toad) predation. Herpetol. Rev. 24, 148 (1993).
58. Pineau, X. & Romanoff, C. Envenomation of domestic carnivores. Rec. Méd. Vét. 171, 182–192 (1995).
59. Sakate, M. & Lucas de Oliveira, P. C. Toad envenoming in dogs: effects and treatment. J. Venom. Anim. Toxins 6, 52–62 (2000).
60. Slade, R. W. & Moritz, C. Phylogeography of Bufo marinus from its natural and introduced ranges. Proc. R. Soc. B 265, 769–777
(1998).
61. Urban, M. C., Phillips, B. L., Skelly, D. K. & Shine, R. The cane toad’s (Chaunus [Bufo] marinus) increasing ability to invade Australia
is revealed by a dynamically updated range model. Proc. R. Soc. B 274, 1413–1419 (2007).
62. Urban, M., Phillips, B. L., Skelly, D. K. & Shine, R. A toad more traveled: The heterogeneous invasion dynamics of cane toads in
Australia. Am. Nat. 171, 134–148 (2008).
63. Nullet, D., Juvik, J. O. & Wall, A. A Hawaiian mountain climate cross-section. Clim. Res. 5, 131–137 (1995).
64. Kelehear, C. & Shine, R. Non-reproductive male cane toads (Rhinella marina) withhold sex-identifying information from their
rivals. Biol. Lett. 15, 2019046 (2019).
65. Shine, R., Everitt, C., Woods, D. & Pearson, D. J. An evaluation of methods used to cull invasive cane toads in tropical Australia.
J. Pest Sci. 91, 1081–1091 (2018).
66. Phillips, B. L. et al. Parasites and pathogens lag behind their host during periods of host range-advance. Ecology 91, 872–881 (2010).
67. Hudson, C. M., Brown, G. P. & Shine, R. Effects of toe-clipping on growth, body condition, and locomotion of cane toads (Rhinella
marina). Copeia 105, 257–260 (2017).
68. Wilson, A. J. et al. An ecologist’s guide to the animal model. J. Anim. Ecol. 79, 13–26 (2010).
Acknowledgements
We thank Georgia Ward-Fear, Matthew Greenlees, Martin Mayer, Michael Crossland, Jayna DeVore, Samantha
McCann, Simon Ducatez, Chalene Bezzina, Dan Selechnik, Mark Richardson, Lee Ann Rollins, Greg Clarke,
Maddie Sanders, Jodie Gruber, Damian Holden, Georgia Kosmala, Stephen Lougheed, Marta Vidal García, and
Kimberley Lemmen for assistance with toad collection; Melanie Elphick for formatting and editing the manu-
script; William Mautz for information and resources in Hawai’i, and Philippe Gaucher for assisting with field
work in French Guiana. This study was funded by the Australian Research Council with approval from the State
of Hawai’i Department of Land and Natural Resources, Division of Forestry and Wildlife, and the Animal Care
and Ethics Committee of the University of Sydney (2013/6075, 2017/1195, and 2018/1441).
Scientific Reports | (2021) 11:936 | https://doi.org/10.1038/s41598-020-80191-7 10
Vol:.(1234567890)www.nature.com/scientificreports/
Author contributions
R.S., G.P.B., C.M.H., and R.A.B. conceived of the study. C.M.H. and R.A.B. collected data in the field and per-
formed experiments. R.S. and G.P.B. analysed the data and produced figures. C.M.H. and R.S. lead the writing of
the manuscript with assistance from G.P.B. and R.A.B. All authors provided critical feedback and helped shape
the research, analysis, and text of the manuscript.
Funding
This work was funded by the Australian Research Council (FL120100074).
Competing interests
The authors declare no competing interests.
Additional information
Correspondence and requests for materials should be addressed to R.S.
Reprints and permissions information is available at www.nature.com/reprints.
Publisher’s note Springer Nature remains neutral with regard to jurisdictional claims in published maps and
institutional affiliations.
Open Access This article is licensed under a Creative Commons Attribution 4.0 International
License, which permits use, sharing, adaptation, distribution and reproduction in any medium or
format, as long as you give appropriate credit to the original author(s) and the source, provide a link to the
Creative Commons licence, and indicate if changes were made. The images or other third party material in this
article are included in the article’s Creative Commons licence, unless indicated otherwise in a credit line to the
material. If material is not included in the article’s Creative Commons licence and your intended use is not
permitted by statutory regulation or exceeds the permitted use, you will need to obtain permission directly from
the copyright holder. To view a copy of this licence, visit http://creativecommons.org/licenses/by/4.0/.
© The Author(s) 2021
Scientific Reports | (2021) 11:936 | https://doi.org/10.1038/s41598-020-80191-7 11
Vol.:(0123456789)You can also read