IMPACT OF PREVENTION OF HEAT STRESS AND DEHYDRATION ON THE RENAL FUNCTION OF SUGARCANE FIELD WORKERS - Adelante Initiative
←
→
Page content transcription
If your browser does not render page correctly, please read the page content below
T H E A DELANTE I NI TI ATI VE
                BRINGING THE SUGARCANE INDUSTRY FORWARD

 IMPACT OF PREVENTION OF HEAT
S TRESS AND DEHYDRATION ON THE
 RENAL FUNCTION OF SUGARCANE
         FIELD WORKERS
   PR E L I M I N A R Y A N A LY SI S OF 2017-2018 B I OLOGI C AL DATA

                      ZAFRA OCT. 2017 – APR. 2018
                     Ingenio San Antonio, Nicaragua

                       WE-Adelante Research Team

                          SEPTEMBER 2018
Project Overview: Adelante Initiative During the last decades, an epidemic of chronic kidney disease of undetermined cause (CKDu) has been detected among agricultural and other heavy laborers around the world. The cost has been thousands of lives lost with thousands sick and without access to adequate care. This not only has depleted the availability of a healthy workforce to the extent that we now see women in traditionally male dominated jobs, but it has begun to tear at the social fabric of communities where too many households are headed by widows whose sons face the same fate as their father’s. There is a growing body of evidence that labor practices, specifically strenuous work in heat without sufficient rest or hydration, is a driver of the disease. Other factors, such as toxins (e.g., pesticide exposure, particle pollution) and infection, may play a role in the development of the disease. However, ongoing research is needed in the occupational setting. CKDu has no cure, but it is possible to address and further understand the disease by addressing known risk factors in the occupational setting. This allows for improved documentation of events linked to the onset and progression of the illness and make efforts to mitigate risks more effective. The culmination of decades of CKDu research, labor practice assessments by La Isla Network (LIN) and Ingenio San Antonio (ISA), and coordination and collaboration among key stakeholders, has led to a new platform known as “The Adelante Initiative”. This initiative will evaluate work practices and improve them with the best possible data while utilizing the learnings from the Worker Health and Efficiency Program (WE Program) and current practices at ISA. The Adelante Initiative provides what is essentially a dynamic lab at ISA, one of the most logistically competent mills in the Americas. This provides an incubator from which standards for effective occupational safety and health can be honed and then scaled to other industries and geographies. The Adelante Initiative’s partners are: Bonsucro, La Isla Network (LIN), Nicaragua Sugar Estates Limited (NSEL), The Nicaraguan Sugar Producers Association (CNPA) and the German Investment Corporation (DEG). LIN and ISA will provide the lessons learned from our efforts so that all stakeholders may benefit regionally and globally. Phase 1 (2017-18 Harvest) of the project provides the baseline from which we will develop improved interventions in Phase 2 (2018-19 Harvest). Phase 3 (2019-20 Harvest) will entail further refinements and the beginning of validating these efforts. Learnings will help inform the Bonsucro certification and be used to inform policy advocacy for worker protections on the state and international level. Together, Adelante partners will continuously improve sourcing, certification, production and loan provision standards. The outcomes produced from the Adelante Initiative will support all actors along the supply chain looking to ensure their sugarcane is sourced responsibly and in line with their procurement goals and mean tangible improvements for the workforce.
We are assessing risks, improving mitigations and work practices via evaluating and improving organizational
systems, technology, tools, and more. We are validating all we do, and work to create scalable systems that can
aid other large mills as well as smaller land holders and other industries. An essential component will be ensuring
that the practices we create and validate together will become industry standard via interface with certifications,
governments, the International Labour Organization and other bodies that require greater resolution in their
efforts to assure a safe and secure workplace.

Project Deliverables and Timeline

1) Baseline data collection and results
Report on baseline renal function, dehydration markers, work history, and other indicators.
Submission Date: September 15, 2018

2) Assessment report of current work practices and risks, preliminary assessment of machete and current PPE
Submission Date: September 1, 2018

3) Assessment of Occupational Health and Safety Application
Submission Date: September 22, 2018

4) Analysis of baseline and follow-up biological and research data
Preliminary report on current health outcomes and other data from workforce based on Year 1 data collection
Submission Date: September 22, 2018

5) Recommended machete design
Report and work plan for production and assessment
Submission Date: September 15, 2018

6) Preliminary return on investment analysis of NSEL’s occupational safety and health program
Report on return on investment compared to not having intervention
Submission Date: September 30, 2018

7) Recommendations based on findings pursuant to points 1, 2 and 4
Beta educational materials (online/downloadable) for educating relevant stakeholders on progress of project and
relevant findings
Submission Date: September 30, 2018

8) Protocols for phase 2 and 3 health assessment and analysis of tools and improved intervention as well as
community perceptions research
Formal protocols and timelines
Submission Date: September 30, 2018
Glossary
Acute Kidney Injury (AKI) – A recently developed reduction in kidney function, from a baseline level which
may be normal, or already lowered due to chronic kidney disease. May be transient but may develop into a
chronic condition if the kidney function reduction is maintained for > 3 months. AKI is formally defined by
KDIGO as an increase in creatinine by ≥ 0.3 mg/dL within 48 hours; or increase in creatinine to ≥ 1.5 times
baseline, which is known or presumed to have occurred within the prior 7 days; or urine volume < 0.5 ml/kg/h
for 6 hours.

Chronic Kidney Disease (CKD) – When the filtering function of the kidneys is so reduced that it becomes a
health problem, and this condition is maintained for more than three months. CKD is often largely without
symptoms, but there is still an elevated risk of dying.

Creatinine – A substance that emanates from the muscles. It is cleared from the bloodstream by the kidneys and
an increased level is therefore related to decreased filtration function of the kidneys. It is the most commonly
used marker of kidney disease. The creatinine level also depend on age and sex, why eGFR is superior when
comparing individuals.

eGFR (estimated Glomerular Filtration Rate) – An estimate of the volume of blood that the kidneys clear from
residues and toxins per time unit and is a more refined estimate of kidney function than the creatinine level in
itself. In this report it is calculated with the CKD-EPI equation which uses the creatinine level, age and sex. The
reference value: > 90 mL/min/1.73m2 (decreases with age).

ΔeGFRPZ-EZ (delta-eGFRPZ-EZ) – The change in eGFR between pre-zafra (pz) and end-zafra (ez).

KDIGO – Kidney Disease Improving Global Outcomes – A global nonprofit organization developing and
implementing evidence-based clinical practice guidelines in kidney disease

Kidney – The organ responsible for (among other things) clearing the blood from water-soluble residues and
toxins and for regulating blood pressure, water and salt balance.

Odds Ratio (OR) – An odds ratio is a measure of association between an exposure and an outcome. The
OR represents the odds that an outcome will occur given a particular exposure, compared to the odds of the
outcome occurring in the absence of that exposure.

Zafra – The season for sugarcane harvesting in Mesoamerica, typically between November to April.                      1
Executive summary
Background
The epidemic of chronic kidney disease of undetermined causes (CKDu) among agricultural workers in Central
America motivated the WE-Adelante study described in the report, Baseline Data Collection (DEG Report 1).
It is generally accepted that heavy, demanding, physical labor puts workers at risk of heat stress that can harm
the kidneys. In an effort to prevent this, the sugarcane farming and processing company, Ingenio San Antonio
(ISA), has developed an intervention program. LIN was asked to determine if their program is sufficient, if
improvements are needed and to assess whether such improvement are effective at limiting damage to the kidneys
while addressing other occupational risks.

Our initial approach during the harvest season 2017-2018 was to evaluate the sufficiency of the current
intervention program. We have followed several groups of workers during the harvest season primarily to see
how the different degrees of the current intervention relate to reduced incidence of renal dysfunction. At the
same time, we made observations to help understand the occupational risks that may be associated with renal
dysfunction with a special focus on workload (e.g., a burned cane cutter has the highest workload, while an office
administrator has the lowest).

Population and Time Frame
This study was carried out over one harvest and will continue for at least two more. Baseline was collected at
beginning of harvest, mid-harvest data was collected by the mill, and researchers collected data at end of harvest.
The job categories analyzed were divided by workload and included burned cane cutters on the high-end of the
workload spectrum and field supervisors and office administrators on the low-end of the workload spectrum. The
total analyzed was over 550 giving the study relevant statistical power and significant findings.

Project Objectives
The general objective is to evaluate if, given the current occupational health interventions, cane cutters, seed
cutters and irrigation repair workers maintain stable renal function over the course of three harvests. If current
interventions are found to be inadequate for one, or more worker categories, improvements to the present
interventions will be recommended based on field observations and research findings. The efficacy of those
improved mitigations will then be measured. Successful interventions will be standardized and adaptation to other
at-risk groups will follow.

                                                                                                                      2
Key Findings Young men were more likely to have a significant decline in kidney function. This is the opposite of what is expected in the general population where older people are more commonly affected. Workers with the most physically demanding jobs suffered the most frequent and significant decline in kidney function, with 21% of the burned cane cutters (27% when including those lost to follow-up) having a reduction in kidney function from pre- to end of harvest. The threshold for what was considered a significant decline is a magnitude suggesting acute kidney injury. Our preliminary analysis shows burned cane cutters are 12 times more likely than other job categories to have a decline in kidney function. Loss to follow up was an issue in this study as in all studies of this kind. With affected workers more likely to leave, the striking findings from the burned cane cutters are likely to be an underestimate. On average, women and those older than 50 did not show abnormal declines in kidney function. This is likely due to few women and older workers working differently or not performing at-risk job tasks. Findings from mid-harvest data collection at ISA appear to add to understanding the cross-harvest findings and should be coordinated with the research team for effective analysis during Phase 2. A lower kidney function at the beginning of the harvest is associated with decline in kidney function during the harvest. The mill’s creatinine level cut off of 1.3 mg/dl for hiring workers is too high. The kidney function that this creatinine level reflects is that of a fairly unhealthy young man; those with a creatinine near 1.3 mg/dl already have impaired kidney function. Reporting fever, weakness, nausea or headache in the weeks before testing are likely to be associated with incident kidney function reduction at end of zafra. These symptoms can be the result of infection or of heat stress. Further study to determine if one or both are what is occurring in the population is required. Hydration levels are difficult to measure in the current study design. Cross shift studies are required to capture hydration and workload more accurately. Variation was high in the mill’s creatinine testing prior to the introduction of new equipment and a new method after the harvest began. The new approach appears to have addressed the problem successfully. Consumption of anti-inflammatory medication was associated with kidney function decline. Ready access to safer alternatives, along with worker education on how much to take, and the need to be hydrated when taking them, needs to be considered. 3
Conclusion
Recommendations for improvements to the intervention program are based on this report, on DEG Report #2
(Observational Report of Work Practices from January 2018 Visits: Zafra 2017 – 2018) and on a literature review.
These are formally organized in DEG Report 8 (Title Pending). However, findings from this report suggest
some immediate takeaways that can inform plans for research and data collection and the implementation of
interventions.

Research and Data Collection
It is apparent that greater coordination between the mill’s medical and occupational health team and the WE-
Adelante researchers can assure the maximum quality of data collection and therefore more effective analysis
from which to draw conclusions after the coming harvest. Furthermore, improved study participant management
to reduce loss of follow up, while assuring accurate reporting of employment status, is required. Resources
should be dedicated to assuring loss of follow up studies also include biological testing so the findings from the
research are as effective as possible.

Implementations of Interventions
This report demonstrates that the current interventions appear to be insufficient for burned cane cutters. These
may be more effective for less physically demanding jobs, but this needs further follow-up to be confident of
adequacy. Great care should be taken to assure that existing, or improved intervention protocols, are followed
and that these provide sufficient hydration, accessible shade areas, and adequate break times. Implementation of
these interventions must be rigorously assessed in the fields, especially for the burned cane cutters. As of now it
is unclear whether the current intervention solely needs to be implemented with greater rigor, whether it requires
a design overhaul, or whether the high work demands required of manual burned cane cutting are fundamentally
incompatible with human health. Further understanding of this should be considered a priority for Phase 2.

Detailed recommendations for effective continuation of the Adelante Initiative and implementation of the
interventions will be detailed and ready for addressing by all stakeholders in the coming Report 8.

                                                                                                                      4
Background
The epidemic of chronic kidney disease of undetermined causes (CKDu) among agricultural workers in Central
America that motivates the WE-Adelante study has been described previously in Report 1, Baseline Data
Collection. In order to evaluate if the current intervention program to prevent kidney disease in this population
is sufficient, we have followed workers during the harvest season to see if the different degrees of the current
intervention are related to reduced incidence of renal dysfunction while understanding the occupational risks
that may be associated with renal dysfunction.
Chronic kidney disease (CKD) is formally characterized by a maintained reduction in kidney function, requiring
at least three months of observation. Acute kidney injury (AKI) is considered to be a risk factor for CKD;
reductions of renal function at any point in time can be an important outcome to study.
The aim of the present report is to evaluate the current intervention program by assessing how kidney function has
changed among a sample of manual and non-manual workers at the sugarcane farming and processing company,
Ingenio San Antonio (ISA), during the harvest 2017-2018. The results are reported in relation to five broad
categories: demographic factors, occupation, health indicators, liquid intake and symptoms. Before this evaluation,
the data sources, health outcomes, study structure, and flow of participants in the study will be described.
Objectives
The general objective is to evaluate if, with the implementation of occupational health interventions, cane cutters,
seed cutters and irrigation repair workers maintain stable renal function over the course of three harvests. If current
interventions are found to be inadequate for one, or more worker categories, the present interventions will be
improved based on field observations and research findings. The efficacy of those improved mitigations will be
measured. Successful interventions will then be standardized and adaptation to other at-risk groups will follow.
5Method
Data sources
Data collected varied by timing of the measurements (Table 1). Questionnaire data was designed and collected by
the WE-Adelante research team independently of ISA. Three measurements were available for the WE-Adelante
cohort participants over the 2017-2018 zafra:
1) Pre-zafra (Baseline) measurements completed by the end of October 2017 for seasonal field workers
(N=542), non-manual field workers (N=61) and a sample of office staff (N=62). (see table 1 for job-specific
details). The pre-zafra samples were collected at the same time as part of the routine pre-employment
testing done by ISA (as described in Report 1). The WE-Adelante samples were then sent to Sweden and
analysis at Lund University (LU). Individuals with indication of affected kidney function, other health
condition (meaning they were unsuitable for working during the harvest) and individuals that for other
reasons did not start working after pre-employment screening (N=65), were not included in the assessment.
2) At mid-zafra (February 2018) additional measurements (periódicos) were conducted by ISA in order to
monitor worker health. The results were not formally integrated in the WE-Adelante study although the data
was shared with us. The vast majority of those tested at mid-zafra were manual field workers (Table 1).
3) End of zafra measurements (April 2018) were collected by ISA at the request of the WE-Adelante program
and sent to Lund for analysis. Questions were added at end of zafra to assess changes in self-reported
variables during zafra (e.g. liquid intake) and to obtain some information that was not collected at the first
interview. In addition to the pre-zafra participants, another 62 participants were investigated at end of zafra
and thus had no pre-zafra measurements analyzed at LU. These were not included in this assessment.
Health outcomes
Change in eGFR from pre-zafra to end of zafra (ΔeGFRPZ-EZ) is presented as means with 95% confidence intervals (C.I.).
Elevated creatinine is defined as ≥ 1.5 times increase or a ≥ 0.3 mg/dL increase of creatinine compared to pre-
zafra level (an adaptation of the 2012 KDIGO definition of AKI).
Creatinine measurement equipment at ISA changed during the zafra, making comparisons of kidney function
between different time periods complicated. Therefore, it was decided to only use LU measurements for the
main analysis of the report, i.e. only creatinine measurements from before and after zafra and no mid-zafra
measurements. There were some discrepancies between ISA and LU results at pre-zafra, but after change of
laboratory equipment at ISA by the end of the zafra, agreement between analyses improved (Supplement 1).
Except for creatinine all other laboratory variables were measured only at the ISA laboratory. 6Table 1. Data availability by time period
Table 1 Data availability by time period
Pre-zafra Mid-zafra End of zafra
Number of participants1
Burned cane cutters 160 137 128
Seed cutters 195 152 148
Irrigation repair workers 132 97 109
Field support staff 54 19 42
Administrative workers 60 2 49
Total 601 407 476
Measurements
Creatinine (serum) Yes, also at LU Yes, at ISA Yes, also at LU
Hematocrit Yes Yes Yes
Hemoglobin (blood) Yes
Urine pH Yes Yes Yes
Urine density Yes Yes Yes
Urine microscopy and
Yes Yes
dipstick
Uric acid (serum) Yes Yes Yes
Blood pressure Yes Yes
White blood cell count Yes
Questionnaire
Symptoms Yes Yes
Liquid intake Yes Yes
Medication Yes
Pesticide exposure Yes
1.Excluding those that were not hired and those recruited to the cohort at end of zafra.
Also excluded were those that do not have a valid LU creatinine measurement at pre-
or end of zafra measurement (N=8).
Study structure and loss to follow-up
The WE-Adelante study was designed to assess workers before and at the end of zafra (Figure 1). Out of 609
hired workers, 126 (21%) were lost to follow-up during the zafra. As previously mentioned, ISA assessed the
health status of manual field workers (those at risk of reduced kidney function) at mid-zafra, and data from
these measurements were shared with us. Analysis of the ISA mid-zafra data indicated that the risk of being
7lost to follow-up was more than doubled if kidney function was reduced at mid-zafra (data not shown). Loss to
follow-up was highest among seed cutters (24%) and lowest among irrigation repair workers (17%) (Table 4).
The 126 participants lost to follow-up were contacted after end of zafra. Until today, all except 17 have been
located and out of these 41 were actually working at ISA at end of zafra but did not attend assessment at that
time, leaving 85 participants that left ISA during zafra. Out of the 68 for which there is a known cause for
leaving ISA, 19 stated that elevated creatinine or kidney disease was the reason they had quit working (13 burned
cane cutters, 4 seed cutters, 1 irrigation repair worker and 1 field support staff) (Supplement 2).
.
Loss to follow-up was fairly similar between job categories. However, participants were more than twice as likely
to be lost to follow-up at end of zafra if their mid-zafra creatinine value indicated elevated creatinine, and many
individuals that were lost to follow-up stated that concerns over kidney disease was the reason they quit working
during zafra. This will lead to an underestimation of the incidence of elevated creatinine between pre- and end
of zafra measurements.
Figure 1. Participant flow chart
Figure 1 Participant flow chart
8Demographic factors
Table Table
2. Mean
2 change in eGFR in
Mean change andeGFR
incidence
andofincidence
elevated creatinine from creatinine
of elevated pre- to end offrom
zafra pre-
by agetoand
endsex.
of
zafra by age and sex.
eGFRPZ-EZ
Elevated creatinine
N (mL/min/1.73m2)
Mean 95% C.I. N %
Male 344 -5,3 -6,9--3,6 33 10%
Female 132 -1,4 -3,3-0,5 0
Age (years)
18-30 253 -5,2 -7,2--3,1 19 8%
30-40 165 -3,5 -5,2--1,7 11 7%
40-50 44 -2,4 -5,8-1,1 3 7%
50-60 14 -1,4 -5,9-3,1 0
The change in kidney function from pre- to end of zafra differed between men and women and young and old, with
men and younger population having a larger decrease in eGFR than the women and those above 50 (Table 2).
Interpretation of findings
As expected in this setting the risk of elevated creatinine at end of zafra was found to be high in the demographic
groups having the most physically demanding jobs. Decline in kidney function was more severe among the young,
contrary to what might be expected in other populations.
No one over 50 years old and no women had clearly elevated creatinine at end of zafra, something which may be
due to there being only few women and older persons working in at-risk occupations (Report 1). No burned cane
cutters were women, and among the seed cutters, 42 out of 148 were women. Had women had the same risk of
elevated creatinine as the men in this occupation, we would expect to see only 1 woman with elevated creatinine.
Seeing none is therefore very likely to happen by chance. The overall kidney function change (ΔeGFR) pre-
to end of zafra was identical between male and female seed cutters (-4.8 v.s. -4.9 mL/min/1.73m2), further
supporting that women could well be just as affected as men by the same occupational exposure.
Occupation
The occupational groups are defined in the report, Baseline Data Collection. Four jobs were targeted for the
intervention assessment. Burned cane and seed cutters were expected to have the most physically demanding
work. Irrigation repair workers were expected to have moderately physically demanding work. The field support
9workers to have mild physically demanding work although some were required to walk great distances throughout
the day in the sun. Administrative workers did not work in the sun and were engaged in office work although not
always air conditioned.
The number of previous harvests, categorized in four groups, among burned cane cutters and seed cutters was
analyzed as a risk factor to see if elevated creatinine tends to happen early or late in the cane cutter career.
Exposure to potentially nephrotoxic agrochemicals during zafra was considered as a potential risk factor for
elevated creatinine during zafra.
Table
Table 3 Association
3. Association between
between selected selected occupational
occupational factors
factors and kidney and kidney
function change function change
eGFRPZ-EZ
Elevated creatinine
N (mL/min/1.73m2)
mean 95% C.I. N %
Job Category
Burned cane cutter 128 -9.4 -12.6--6.2 27 21%
Previous harvests
0-2 14 -24.2 -41.9--6.6 5 35%
3-6 38 -8.7 -13.5--3.9 8 21%
6-10 32 -7.1 -12.7--1.5 7 22%
> 10 44 -6.9 -11.2--2.7 7 16%
Seed cutter 148 -4.9 -7.2--2.6 5 3%
Previous harvests
0-2 38 -6.9 -10.2--3.6 1 3%
3-6 48 -3.6 -9.4-2.17 2 4%
6-10 41 -4.2 -6.9--1.4 1 2%
> 10 16 -5.6 -9--2.2 1 6%
Irrigation repair 109 0.5 -1.1-2 0 0%
Field support staff 42 -2.2 -4.5-0.2 0 0%
Administrative 49 -0.8 -4.6-3 1 2%
Pesticides
No 461 -4 -5.3--2.7 30 7%
Yes 14 -9.4 -18.7-0 3 21%
Glyphosate 11 -10.2 -23.7-3.4 3 27%
10eGFR decreased by on average -9.4 mL/min/1.73 m2 from pre- to end of zafra among burned cane cutters, less
among seed cutters and changed insignificantly among workers in other job categories (Table 3).
There was a strong tendency towards higher incidence of elevated creatinine with high physical demands.
Burned cane cutters were over-represented among those who suffered from elevated creatinine, with 27 out of
the 33 individuals having clearly elevated creatinine at end of zafra working as a cane cutter. Among burned cane
cutters there was also a tendency towards higher risk of elevated creatinine early on in the career.
Those with elevated creatinine were overrepresented among the few participants reporting exposure to
glyphosate during zafra.
The proportion of workers with a low kidney function was higher among those applying for the heavier manual
job categories. The kidney function of many of the workers in heavier manual jobs decreased over the course of
the zafra, while remaining unchanged for the less physically strenuous job tasks (Table 4).
Table 4 Number of workers by kidney function category and job category at start of
work
Table at ISA,
4. Number of and at end
workers of zafra
by kidney function
1 category and job category at start of work at ISA, and at end of zafra 1
Burned cane Irrigation Field Administrati ve
Seed cutter
Occupation cutter repair support
N N N N N
eGFR category
(mL/min/ Start End Start End Start End Start End Start End
1.73m2)
> 90 91 63 141 91 103 89 48 36 42 35
60-90 62 43 44 46 29 20 5 5 18 14
45-60 7 14 8 9 0 0 1 1 0 0
30-45 0 6 2 1 0 0 0 0 0 0
15-30 0 2 0 1 0 0 0 0 0 0
Total 160 128 195 148 132 109 54 42 60 49
Loss to follow-
up 20% 24% 17% 22% 18%
1 This table displays kidney function according to LU results. Decisions on hiring are based on local
ISA results that may differ from LU results
Interpretation of findings
It is striking that burned cane cutters have a 10.8 (95% C.I. 4.2-28.2) times higher rate of elevated creatinine
compared to other investigated manual field jobs. The large risk difference between burned cane and seed
cutters is surprising considering that both these groups seem to have a very physically demanding job in hot
environments. Differences in cutting tasks between burned cane and seed cutting need to be more systematically
11explored including: differences in heat exposure considering the difference between working close to recently
burned vs. living plants; being coated in and inhaling the ash from the burned sugarcane; cutting older and
generally heavier cane.
Cane cutters were 15% of all manual field workers hired for the 2017-2018 zafra. Most manual workers are seed
cutters and irrigation repair workers (these we included) along with seeders and re-seeders (these we have not
studied). If unstudied manual workers have the same low excess risk as seed cutters and irrigation repair workers,
just bringing burned cane cutters to that lower level of excess risk would eliminate approximately two-thirds1 of
new elevated creatinine cases at ISA during zafra.
Higher risk of elevated creatinine during the first zafras could be due to susceptible individuals being eliminated
from the workforce due to developing kidney disease early on in their career, while more resilient individuals
stay in the workforce longer.
While very few reported use with pesticides during the harvest, the rate of elevated creatinine among those who did
was higher. Glyphosate is used to mature sugar cane six weeks before the harvest, but there is no use of pesticides
during the harvest in process, so all workers used it on their own crops. The three participants with elevated
creatinine reporting pesticide exposure were all burned cane cutters and all reported glyphosate exposure. But the
numbers are small and no conclusions about glyphosate use and creatinine are appropriate at this time.
1. This estimate was derived using the standard epidemiological formula used for estimating what is known as “population attributable fraction”.
Several assumptions were needed to calculate this estimate and more complete information about the entire workforce and risk will improve
confidence in the estimate.
12Symptoms
Participants were asked if they had experienced a set of symptoms over the past two weeks (one week for fever).
Only symptoms that were not present at pre-zafra (henceforth incident symptoms) are considered here in order
to identify symptoms that occur together with development of reduced kidney function.
Table 5 Association between incident symptoms at end of zafra and kidney function
change
Table 5. Association between incident symptoms at end of zafra and kidney function change
Difference in
Incident
eGFRPZ-EZ Odds ratio for elevated
Incident symptoms Symptoms at
symptomatic vs. creatinine among
at end of zafra end of zafra
asymptomatic symptomatic
(mL/min/1.73m2)
N % mean 95%CI OR 95%CI
Dehydration
Little urine 77 15% -3.1 -7.4-1.1 1.73 0.75-4.00
Dark urine 72 14% -4.4 -8.6--0.2 1.62 0.68-3.90
Dysuria 84 17% 0.8 -1.9-3.5 0.29 0.07-1.25
Dry mouth 87 17% -0.4 -4.1-3.3 1.50 0.65-3.44
Thirst 135 27% -2.6 -5.9-0.7 1.56 0.74-3.26
Heat stress
Fever 47 9% -6 -12.3-0.4 4.92 2.17-11.13
Heart racing 77 15% 0.2 -3.2-3.5 0.69 0.23-2.01
Feeling ill after
52 10% -2.5 -6.5-1.6 1.50 0.55-4.08
sun exposure
Headache 115 23% -1.1 -4.2-2 1.93 0.92-4.07
Vomiting 29 6% -0.2 -3.8-3.5 0.45 0.06-3.38
Nausea 67 13% -3.7 -8.9-1.6 2.12 0.91-4.93
Disorientation 21 4% -2 -11.5-7.4 0.66 0.09-5.08
Dizziness 35 7% -0.3 -6.9-6.2 1.24 0.36-4.29
Physical exertion symptoms
Exhaustion 134 27% -1.1 -4-1.7 1.79 0.86-3.71
Weakness 105 21% -3.5 -7.2-0.1 2.48 1.19-5.17
Cramp 50 10% 1.6 -2.5-5.7 0.53 0.12-2.29
Edema of hands
17 3% -0.3 -4.1-3.5 No cases
and feet
Other symptoms
Wheezing 12 2% -1.7 -8.3-4.9 1.23 0.15-9.81
Earache 15 3% -5.3 -12.9-2.4 0.96 0.12-7.52
Abdominal pain 57 11% -0.2 -4.4-3.9 0.72 0.21-2.44Having fever, weakness, nausea or headache in the weeks before testing are likely to be associated with elevated
creatinine at end of zafra (Table 5). Having dark urine was associated with a larger negative ΔeGFRPZ-EZ, but
not with clearly elevated creatinine.
Interpretation of findings
Considering the multitude of symptoms considered as potentially associated with changes in kidney function, it
is to be expected that some will be found to be significantly associated just by random chance. A cluster of recent
symptoms resembling a non-specific inflammatory condition, or a heat stress event (fever, nausea, weakness
and headache) were associated with increased odds of an elevated creatinine. This finding is consistent with
a previous study that showed evidence of elevated creatinine among sugarcane workers presenting with fever,
nausea, vomiting, headache, muscle weakness and back pain2. Fever, headache and weakness were uncommon in
administrative workers, and nausea was rare among field support staff. Apart from these differences, there was no
association between the occurrences of the four symptoms associated with elevated creatinine and occupational
category. This indicates that all outdoor occupations have these symptoms to a similar extent, but it is only when
cutters (especially burned cane) have them that there often is an associated elevated creatinine.
2. Fischer RSB, Mandayam S, Chavarria D, Vangala C, Nolan MS, Garcia LL, et al. Clinical Evidence of Acute Mesoamerican Nephropathy.
The American journal of tropical medicine and hygiene. 2017;97(4):1247-56.
14Liquid intake
Measures of liquid intake before zafra, at the end of zafra, and the change between the two, were considered
based on questions regarding types and amounts of liquids consumed since the morning of the previous
day (prompted by lists of possible drinks and assisted by showing figures of common liquid containers of
different sizes), before the zafra began, and at the end of the zafra. The answers were not normally distributed,
therefore, to deal with extreme values, these variables were categorized to quartiles. Liquid intake and change
in intake were compared by job category and change in liquid intake during zafra; urinary density as a marker of
dehydration was assessed as a predictor of changes in kidney function.
Table 6. Table
Change in liquid in
6 Change intake from
liquid pre- from
intake to endpre-
of zafra by occupational
to end category
of zafra by occupational category
Daily liquid intake Daily liquid intake Change in daily liquid
reported pre-zafra reported end of zafra intake from pre-to end
Job category (L) (L) of zafra (L)
Median IQR Median IQR Median IQR
Burned cane
3.5 2.3-5.5 9 6-11.7 5.4 2.5-8.8
cutter
Seed cutter 3.4 2.3-5.7 8.1 5.3-9.5 3.3 0.2-6.5
Irrigation repair 3.2 2.2-5.0 8.2 6.7-9.8 4.7 2.5-6.4
Field support
3.5 2.4-6.4 7.3 6.3-9.2 3.3 1.3-5.2
staff
Administrative 2.7 1.9-4.2 2.9 1.6-3.7 -0.3 -1.3-0.6
Fluid intake was similar across manual job categories at pre-zafra, increasing most over the zafra among burned
cane cutters and irrigation workers (Table 6). There was also no clear association between the amount of liquid
drunk at end of zafra and urine density among the job categories, nor when comparing within job category (data
not shown).
15Table 7. Association between hydration parameters and kidney function changes
Table 7 Association between hydration parameters and kidney function changes
All except burned cane cutters Burned cane cutters
Change in pre-to eGFRPZ-EZ (mL/ Elevated eGFRPZ-EZ (mL/ Elevated
end of zafra min/1.73m2) creatinine min/1.73m2) creatinine
N N
liquid intake
quartile Mean 95% C.I. N % Mean 95% C.I. N %
1 95 -4 -6--1.9 2 2% 19 -10 -17.4--2.8 4 21%
2 96 -2.8 -4.6--1 2 2% 24 -9 -19.0-0.8 5 21%
3 83 -0.6 -3.3-2.2 0 35 -12.6 -20.4--4.8 8 23%
4 74 -1.4 -5.2-2.4 2 3% 49 -7.1 -11.0—3.2 10 20%
U-density pre-to
end of zafra
-0.010 70 -1.6 -6.0-2.9 1 1% 28 -2.7 -7.1-1.8 2 7%
-0.005 61 -2.7 -5.5-0 2 3% 29 -10.4 -17.6--3.1 8 28%
0 98 -0.4 -2.4-1.7 1 1% 27 -9.8 -17.6--2.1 5 19%
-5.2--1.
0.005 64 -3.3 3
2 3% 31 -10.7 -16.7--4.8 7 23%
-7.5--2.
0.010 52 -5.0 4
0 12 -18.7 -37.7-0.4 5 42%
After splitting the data to burned cane cutters and others, there was no association between change in liquid
intake from pre-to end of zafra and elevated creatinine (Table 7). However, there seemed to be a higher risk of
kidney function decrease among burned cane cutters with a large increase in urine density, as an indicator of
being more dehydrated in the morning at end of zafra than before zafra.
Interpretation of findings
There seemed to be a trend towards increasing risk of elevated creatinine from pre-to end of zafra with
increasing dehydration parameters (ΔU-density) from pre-to end of zafra. In agreement with the hypothesis
that repeated dehydration is a cause of elevated creatinine, there seemed to be a trend towards increasing risk of
elevated creatinine from pre-to end of zafra with increasing dehydration parameters (ΔU-density) from pre-to
end of zafra. Some caution is needed when interpreting these results, because this marker reflects a snapshot of
hydration status in one morning rather than hydration status during repeated workdays.
16Health indicators
A number of health indicators from laboratory tests, or from reported health history, were examined for a
possible relationship to kidney function or change in kidney function.
Indicators from laboratory or clinical tests.
The association between pre-zafra uric acid and change in uric acid levels from pre- to end of zafra, and
ΔeGFRPZ-EZ and risk of elevated creatinine was analyzed.
White Blood Cell (WBC) count can be a sign of infection or a sign of inflammation without infection. When the
WBC counts are > 10-15000 it is more likely due to an infection. WBC values at pre-zafra were assessed as a
predictor of elevated creatinine during zafra, and as a predictor of ΔeGFRPZ-EZ over the zafra.
Pre-zafra creatinine was considered as a predictor of change in kidney function during zafra.
Blood pressure at pre-zafra was considered as a predictor of ΔeGFRPZ-EZ and elevated creatinine. Elevated
blood pressure at pre-zafra was defined as history of hypertension, or a systolic blood pressure > 140 mmHg, or a
diastolic blood pressure > 90 mmHg.
Incident elevated blood pressure at end of zafra may suggest incident elevated creatinine, possibly transient.
Incident elevated blood pressure at end of zafra was defined as systolic blood pressure > 140 mmHg, or a
diastolic blood pressure > 90 mmHg, with absence of elevated blood pressure at pre-zafra.
Mid-zafra urine examinations for epithelial cells, crystals, leukocytes, erythrocytes, protein and bacteria were
analyzed to see if either of these abnormalities were more frequent among those developing elevated creatinine
at end of zafra.
Indicators from reported health history
Urological conditions at pre-zafra (urinary infections in previous year, history of nephrolithiasis) were
considered as potential risk factors for elevated creatinine at end of zafra.
Exposure to potentially nephrotoxic NSAIDs were considered as potential risk factors for elevated creatinine at
end of zafra. Questions were asked only at end of zafra.
Haematocrit reduction was considered either primarily as a possible consequence of elevated creatinine or as a
consequence of an unrelated cause of elevated creatinine.
17A few named, specific infections (leptospirosis, zika, chikungunya and dengue) during zafra were considered risk
factors for elevated creatinine.
There were very few participants with previously diagnosed diabetes (N=3) so no further examination of those
with this health condition was attempted.
17Table 8. Association between health indicators and kidney function changes
Table 8 Association between health indicators and kidney function changes
N eGFRPZ-EZ (mL/min/ Elevated
1.73m2) creatinine
Mean 95% C.I. N %
Pre-zafra creatinine1 (mg/dl)
< 1.05 74 -10.1 15.0--5.3 13 18%
1.05-1.15 17 -6.3 -13.3-0.8 2 12%
1.15-1.25 16 -5.3 -13.8-3.2 3 19%
1.25-1.35 i.e. current cut-off 11 -12.7 -24.2--1.2 5 45%
1.35- 10 -12.2 -21.8--2.7 4 40%
Uric acid at pre-zafra (mg/dl)
2-4 167 -3.8 -6.1--1.6 10 6%
4-6 216 -4.1 -5.6--2.5 10 5%
6-7 50 -5.4 -10.8-0.0 7 14%
7 33 -6.1 -13.3--1.2 6 18%
Uric acid change pre-to end of zafra (mg/dl)
Reduction 72 2.2 -0.7-5.3 1 1%
+ 0-2 307 -3.5 -4.8--2.3 17 6%
+ 2-4 75 -10.2 -14.6-5.8 10 13%
+>4 10 -28.9 -49.7-8.1 5 50%
Pre-zafra WBC (cells/cm3)
4500-6500 88 -3.4 -5.5--1.2 4 5%
6500-8500 267 -3.8 -5.7--2 20 7%
8500-10500 88 -6.8 -10.3--3.3 7 8%
10500- 26 -2.6 -6.7-1.7 2 8%
Pre-zafra blood pressure
Normotensive 455 -4.2 -5.6--2.9 31 7%
Hypertensive 21 -3.1 -8.7-2.5 2 10%
Incident hypertension at end of zafra
No 455 -4.4 -5.7--3 33 7%
Yes 21 -0.8 -6.4-4.8 0
5 percentage point hematocrit reduction pre-to-end of zafra
No 423 -2.7 -3.8--1.6 16 4%
Yes 48 -17.7 -25.5--9.8 17 34%
Urinary tract infections (UTI) in previous year
0 UTI 370 -4.5 -6.1--3 27 7%
1 UTI 106 -3 -5.2--0.8 6 6%
Self-Reported History of nephrolithiasis
No 446 -4.1 -5.4--2.8 32 7%
Yes 7 -5.4 -10.3--0.6 0
Self-Reported NSAID use
No 369 -3.6 -5--2.1 21 6%
Yes 101 -6.2 -9.3--3 11 11%
1
Restricted to burned cane cutters to avoid confounding by job category. The
1.categorization
Restricted to burnedwas
canechosen
cutters toas
avoid
LUconfounding
creatinine by job category.report
analysis The categorization
creatinine wasat
chosen as LU
a higher
creatinine
resolutionanalysis
thanreport
thecreatinine at a higher resolution than the ISA analysis.
ISA analysis.
18A high uric acid level at pre-zafra, and a large increase in uric acid during zafra, was associated with a larger
reduction in kidney function and more frequently elevated creatinine from pre- to end of zafra (Table 8).
Hypertension at pre-zafra did not predict elevated creatinine at end of zafra and incident hypertension at end
of zafra was not more common among those that had developed elevated creatinine during zafra. Reduced
hematocrit was strongly associated with elevated creatinine.
One individual had had leptospirosis and had no elevated creatinine, one had had zika and had elevated
creatinine and two had had chikungunya, one of whom had elevated creatinine. There was no association
between any of the urine microscopy or dipstick findings at mid-zafra and elevated creatinine at end of zafra. No
participants had proteinuria at mid-zafra assessment.
Interpretation of findings
As expected considering that uric acid levels are related to elevated creatinine, high pre-zafra uric acid levels
and a large increase in uric acid during zafra was associated with elevated creatinine. Uric acid is a well-known
marker for reduced kidney function, but it is also considered a potential causal mechanism of CKDu3 by some.
Uric acid increase seems to be independently associated with kidney function decrease also when considering
differences between occupational categories.
Those taking NSAIDs were about twice as likely to have elevated creatinine at end of zafra, which is expected
considering the known nephrotoxicity of these drugs. NSAID use was much more common among those with
manual field jobs, and highest among burned cane cutters (21% vs. 17% in the other manual field jobs).
A slight reduction in hematocrit with incident elevated creatinine was very common, and may be due to elevated
creatinine in itself and/or the inflammatory reaction that seems to coincide with elevated creatinine.
High creatinine at pre-zafra (according to LU measurements) as an indication of pre-existing kidney injury
was a risk factor for further creatinine elevation during zafra. The current creatinine employment cut-off value
translates to a somewhat compromised kidney function (Figure 2) and is associated with an increased risk of
elevated creatinine from pre-to end of zafra, at least among burned cane cutters. The impact of pre-zafra testing
with the improved laboratory procedures at ISA should be tracked during the coming year.
3. Kupferman J, Amador JJ, Lynch KE, Laws RL, Lopez-Pilarte D, Ramirez-Rubio O, et al. Characterization of Mesoamerican Nephropathy
in a Kidney Failure Hotspot in Nicaragua. American journal of kidney diseases: the official journal of the National Kidney Foundation.
2016;68(5):716-25.
19Figure 2. Relationship between creatinine and eGFR at pre-employment screening values
Kidney function (GFR) by age at
pre-employment cut-off values
80
60
eGFR among men with creatinine 1.3 mg/dl
eGFR among women with creatinine 1.2 mg/dl
GFR
40
CKD definition (if repeated after 3 months)
20
0
20 30 40 50 60
Age
Concluding remark
It should be emphasized that the assessment of kidney function reduction so far is based on one measurement,
and as such the chronicity of the condition cannot be determined. Previous studies in similar settings have
shown that kidney function may recover following acute declines4 and cyclical changes in kidney function5.
It remains to be seen until the pre-zafra measurement in October 2018 to what extent kidney function has
recovered among those with elevated creatinine during the 2017-2018 zafra.
4. Kupferman J, Ramirez-Rubio O, Amador JJ, Lopez-Pilarte D, Wilker EH, Laws RL, et al. Acute Kidney Injury in Sugarcane Workers at Risk
for Mesoamerican Nephropathy. American journal of kidney diseases: the official journal of the National Kidney Foundation. 2018.
5. Gonzalez-Quiroz M, Smpokou ET, Silverwood RJ, Camacho A, Faber D, Garcia BR, et al. Decline in Kidney Function among Apparently
Healthy Young Adults at Risk of Mesoamerican Nephropathy. Journal of the American Society of Nephrology : JASN. 2018;29(8):2200-12.
20Supplement 1: Comparison of LU and ISA creatinine results
Temporal trends in ISA creatinine test results were examined by evaluating mean eGFR in pre-, mid- and end of
zafra, and mean ΔeGFRPZ-MZ and ΔeGFRMZ-EZ. Also, the results of LU creatinine analyses, at pre- and end
of zafra were compared to the results obtained from ISA.
Supplementary Table 1 Changes in average eGFR and eGFR by time of testing and
Supplementary Table 1. Changes
place of creatinine in average eGFR and ΔeGFR by time of testing and place of creatinine analysis
analysis
Laboratory
ISA, Nicaragua LU, Sweden
N (%) N (%)
Cross-zafra change in kidney function
Elevated creatinine (creatinine > 1.5 times pre- 48 (10%) 33 (7%)
zafra or > 0.3 mg/dL absolute increase)
Mild elevated creatinine (creatinine 1.2-1.5 45 (9%) 22 (5%)
times pre-zafra, < 0.3 mg/dL absolute
increase)
No change 291 (61%) 416 (87%)
Improved kidney function (creatinine < 0.8 92 (19%) 5 (1%)
times pre-zafra)
mL/min/1.73m2 mL/min/1.73m2
Average eGFR
Pre-zafra (N=669) 96.5 (95.0-98.1) 100.9 (99.3-102.6)
Mid-zafra (N=439) 90.5 (88.6-92.5)
End-zafra (N=545) 100.2 (98.0-102.4) 97.3 (95.3-99.4)
Average ΔeGFR
Pre- to Mid-zafra (N=418) -6.8 (-8.8--4.7)
Mid- to End-zafra (N=375) 9.2 (7.0-11.4)
Pre- to End-zafra (N=479) 2.3 (0.1-4.4) -4.2 (-5.5--2.9)
Comparing the eGFR values within the same individual from one time period to the next (ΔeGFR), there was on
average a strong decrease in eGFR levels from pre-to mid-zafra, and then a strong average improvement in eGFR
from mid- to end of zafra for ISA results (Supplementary Table 1). These trends are in unexpected directions
and of large magnitude. LU results showed the expected average decrease in eGFR during zafra.
ISA results show a large variability in the change in kidney function – with large numbers of individuals with an
estimated large improvement in kidney function (which is unlikely) while many others have large decreases in
kidney function. LU results show a more stable kidney function from pre-to end of zafra for the vast majority,
and a large reduction for a few, as expected.
21Changes in kidney function of the magnitude, direction and frequency indicated by creatinine analyses at ISA are
unlikely on a group level and may be due to temporal variability and low precision of creatinine analyses at ISA,
an issue which has been detected in earlier time periods.
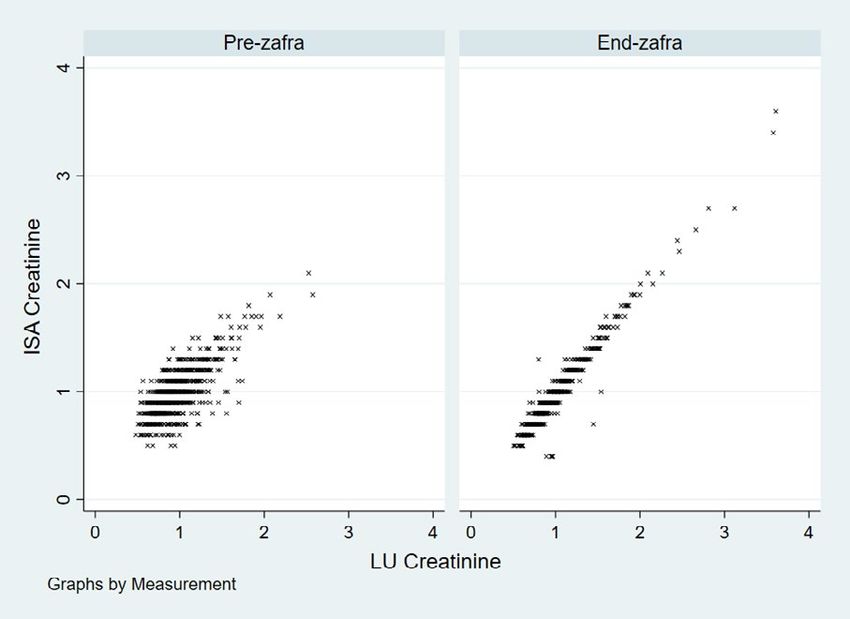
At pre-zafra, LU results were on average 0.024 mg/dL lower than ISA results, and at end of zafra LU results
were 0.031 higher than ISA result, i.e. the absolute difference was larger at end of zafra. However, the standard
deviation of the difference between LU and ISA results is halved from pre-to end of zafra, and when the LU
and ISA results are plotted against each other (Supplementary Figure 1), ISA results are clearly less spread out
compared to LU values at end of zafra than at pre-zafra (R2=0.94 vs 0.55).
Supplementary Figure 1 Correlation between ISA and LU Creatinine measurements at pre-zafra and end of zafra.
Supplementary Figure 1 Correlation between ISA and LU Creatinine measurements at
Summary
pre-zafra and end of zafra.
Creatinine measurements at ISA seems to vary temporally in an artificial way, a pattern that has been seen over
2015-2017, and seem to exist also for the February-April 2018 period (Supplementary Table 1), during which
there is a strong average improvement in kidney function despite analysis machine reportedly being changed in
the end of 2017. This is problematic both from a research and occupational health perspective and efforts should
22be made to ensure optimal functioning of the creatinine analysis at ISA. ISA measurements for end of zafra seem
to be more precise and aligned with LU measurements as compared to pre-zafra measurements where there was
great variability between the two testing sites. This is promising as it suggests the new equipment purchased by
ISA was a good investment and will help them more accurately assess the help of workers and provide a more
reliable back up for samples sent to LU for biobanking. The current 0.03 mg/dL difference in average creatinine
between LU and ISA measurements is an acceptable level of accuracy, as long as it is kept relatively constant and
does not vary temporally.
Supplement 2: Analysis of loss to follow-up database
Efforts were made to contact the 126 participants who were not available for end of zafra testing. One hundred and
nine of these could be contacted in August and September 2018. Of these, 19 had quit due to elevated creatinine,
and a further 12 had been on sick leave due to elevated creatinine. For 6 out of 13, being on sick leave due to
increased creatinine is the likely cause of not being available for testing at end of zafra, and 2 out of 5 participants
who reported they quit working as the job was too hard had also been on sick leave for elevated creatinine.
Henceforth in this supplementary report, both those who quit working due to elevated creatinine and those who
have been on sick leave due to elevated creatinine will be considered as having elevated creatinine.
Elevated creatinine, hospitalization and current creatinine levels
Half of the 31 lost to follow-up who had elevated creatinine had been hospitalized during zafra, as compared to
16% of the 78 without elevated creatinine. The median length of hospital stay was 3 days (interquartile range
(IQR) 2-6 days). Among the 26 participants with elevated creatinine who could recall their last creatinine value
(84%), the median was 1.7 (IQR 1.3-1.9).
Elevated creatinine and sick leave, current activity and intended participation in coming zafra
Among those with elevated creatinine, the vast majority (28/31) stated that they had been or currently were
on sick leave. The median time of sick leave was 30 days (IQR 8-39 days), with two participants still on sick
leave. Two thirds (20/31) of those with elevated creatinine reported that they were currently not working
(“Descansa”), as compared to half (35/71) of those not having elevated creatinine. Two thirds (20/31) of those
with elevated creatinine intended to work in the coming zafra, compared to 86% (60/71) among those who did
not have elevated creatinine.
Association between job category and elevated creatinine
In order to assess if loss to follow-up biased the association between job category and elevated creatinine seen in
the main report (Report 4, Preliminary analysis of 2017-2018 biological data), those who reported they had had
23elevated creatinine in this study of those lost to follow-up are added to those that were known to have elevated
creatinine at end of zafra measurements (Table 1).
Supplementary Table 2:1. Association between job category and elevated creatinine, considering also those lost to follow-up
Other observations from loss to follow-up study
Four participants reported being on sick-leave due to heat stress symptoms, and one participant was on sick leave
due to both creatinine elevation and heat stress symptoms. When combining those identified at end of zafra with
those lost to follow-up, 4/64 with kidney function reduction and 5/521 without, reported chikungunya.
Interpretation and summary
Considering evidence from this follow-up assessment that many not present at end of zafra probably were on
sick leave due to elevated creatinine, suspected kidney disease is even more wide-spread than suggested by the
findings in the main report.
Elevated creatinine was associated with hospitalization, sick leave, inactivity and avoiding work in the up-coming
zafra, indicating that aside from the human suffering, there is substantial economic costs from kidney disease.
As suspected, loss to follow-up led to an underestimation of creatinine elevation incidence in all outdoor
occupational groups. Relatively more seed cutters and irrigation repair workers with elevated kidney function
were lost to follow-up (Table 2:1), exaggerating the difference between these occupational groups and burned
cane cutters in the main report.
While interesting and statistically significant, the excess risk of elevated creatinine associated with chikungunya
fever should not be over interpreted at this stage.
24You can also read