Environmental Science - Processes & Impacts
←
→
Page content transcription
If your browser does not render page correctly, please read the page content below
Volume 17 Number 9 September 2015 Pages 1505–1700

Environmental
Science
Processes & Impacts
rsc.li/process-impacts

                         ISSN 2050-7887

                         PAPER
                         R. D. Webster et al.
                         Annual air pollution caused by the Hungry Ghost Festival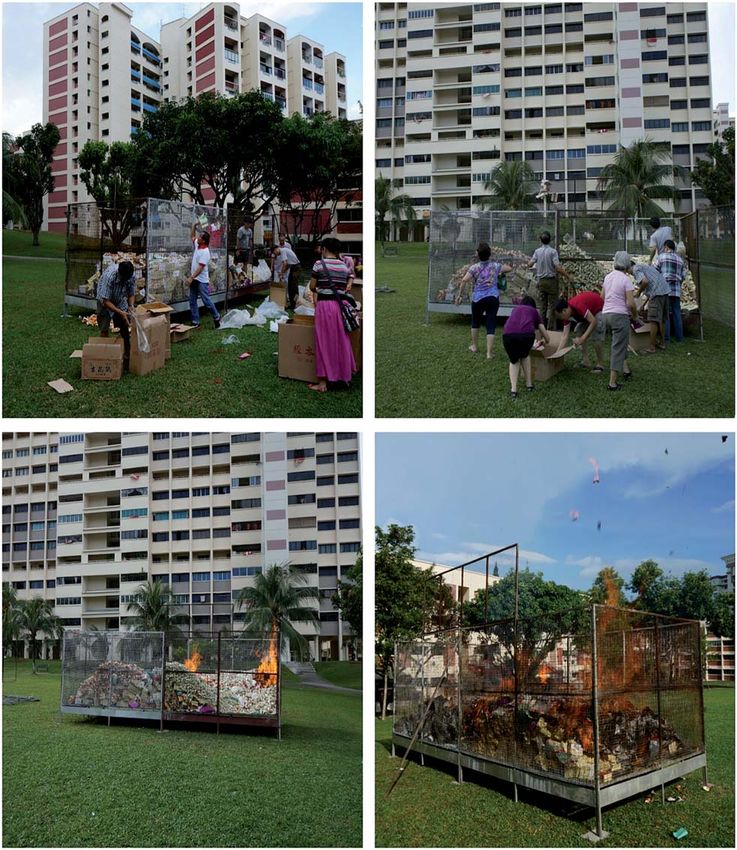
Environmental
Science
Processes & Impacts
View Article Online
PAPER View Journal | View Issue
Annual air pollution caused by the Hungry Ghost
This article is licensed under a Creative Commons Attribution 3.0 Unported Licence.
Festival†
Cite this: Environ. Sci.: Processes
Open Access Article. Published on 16 July 2015. Downloaded on 5/3/2021 10:02:49 AM.
Impacts, 2015, 17, 1578
B. Khezri,ab Y. Y. Chan,ac L. Y. D. Tionga and R. D. Webster*abc
Burning of joss paper and incense is still a very common traditional custom in countries with a majority
Chinese population. The Hungry Ghost Festival which is celebrated in the 7 month of the Chinese
calendar is one of the events where joss paper and incense are burned as offerings. This study
investigates the impact of the Ghost Month Festival (open burning event) on air quality by analysis of the
chemical composition of particulate matter (PM) and rainwater samples collected during this event,
compared with data collected throughout the year, as well as bottom ash samples from burning the
original joss paper and incense. The results showed that the change in the chemical composition of the
rainwater and PM2.5 (PM # 2.5 mm) atmospheric samples could be correlated directly with burning
events during this festival, with many elements increasing between 18% and 60% during August and
September compared to the yearly mean concentrations. The order of percentage increase in elemental
Received 5th July 2015
Accepted 16th July 2015
composition (in rain water and PM2.5) during the Hungry Ghost Festival is as follows: Zn > Ca > K > Mg >
Fe > Al > Na Mn Ti V > Cu > As > Ni > Co > Cd > Cr > Pb. The chemical composition of the
DOI: 10.1039/c5em00312a
original source materials (joss paper and incense for combustion) and their associated bottom ash were
rsc.li/process-impacts analysed to explain the impact of burning on air quality.
Environmental impact
Uncontrolled outdoor burning of paper objects and incense is commonly conducted in countries with Chinese populations as part of religious ceremonies. In
this study, we have identied a signicant source of atmospheric pollution above normal background levels that occurs in August/September each year, due to
the Hungry Ghost Festival. The pollution takes the form of an increase in the metallic composition of particulate matter # 2.5 mm (PM2.5) released into the
atmosphere as well as a measurable contamination of rainwater. The compositions of the PM2.5 and rain water were compared with the chemical composition of
a range of common materials that are burnt as offerings (Joss paper, incense and papier-mâché) for source apportionment.
Rain plays a role in the removal of gases and particulate
1 Introduction matter from the atmosphere, therefore, the study of the chem-
Knowledge of the concentrations of trace elements in particu- ical composition of rainwater can also aid in understanding the
late matter is an essential primary step in identifying the source contribution of the different sources of atmospheric pollut-
characteristics of air pollution for the development of air quality ants.2 The rainwater composition is oen inuenced by
control strategies and evaluating possible implications for anthropogenic activities releasing acidic (such as SOx and NOx)
public health. Several epidemiological studies have identied a or basic (such as NH3) gases into the atmosphere. Acidic rain-
correlation between the exposure to airborne particles and water aids the dissolution of many trace metals, which
increased health risk such as mortality, respiratory or cardio- enhances their bioavailability, thus, the study of trace metals in
vascular diseases, and respiratory symptoms.1 rainwater has increased because of their adverse environmental
and human health effects.
a
An ongoing study was conducted commencing in 2009 to
Division of Chemistry and Biological Chemistry, School of Physical and Mathematical
Sciences, Nanyang Technological University, Singapore 637371, Singapore. E-mail: monitor rainwater and airborne particulate matter in a
webster@ntu.edu.sg; Fax: +65-6791-1961 sampling site in western Singapore. One of the interesting
b
Cambridge Centre for Carbon Reduction in Chemical Technology, features uncovered in this dataset is a local event (common in
CARESCAM.CREATE, Nanyang Technological University, 62 Nanyang Drive, all countries with a Chinese population), called the Ghost
Singapore 637459, Singapore
Month, that surprisingly substantially changed the chemical
c
NEWRI-ECMG, Nanyang Environment and Water Research Institute (NEWRI), 1
composition of rainwater and particulate matter by increasing
Cleantech Loop, Clean Tech One, #06-08, Singapore 637141, Singapore
† Electronic supplementary information (ESI) available: Full tables of elemental
the concentrations of a large number of the elements. The
data, maps of sampling locations, instrumental parameters used for analysis Hungry Ghost Month is a traditional festival celebrated by the
and photographs of materials for burning. See DOI: 10.1039/c5em00312a Chinese in the seventh month of the lunar calendar. They
1578 | Environ. Sci.: Processes Impacts, 2015, 17, 1578–1586 This journal is © The Royal Society of Chemistry 2015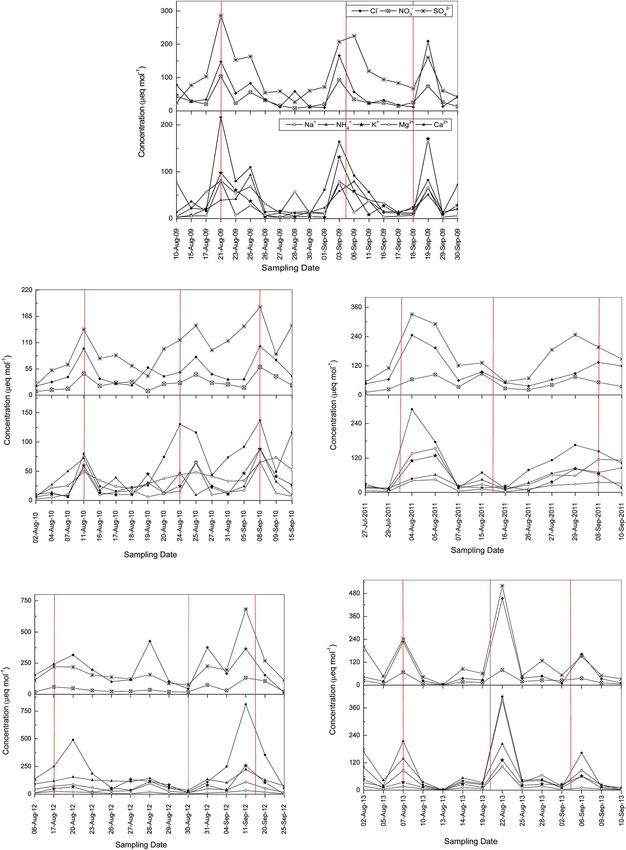
View Article Online
Paper Environmental Science: Processes & Impacts
believe that the gates of Hell are opened to allow ghosts and Large scale burning of joss paper and incense oen occurs
spirits access to the world of the living on the rst day of the during important outside festivals, although previous studies
month. The spirits visit their families, feast and look for victims on joss paper and incense burning have concentrated mainly on
during this month. The eenth day of the seventh month in assessing the air quality of the indoor/outdoor environments of
the lunar calendar is called the Hungry Ghost Festival (Ghost temples.4a,e,5c,d,6 To the best of the author's knowledge, only one
Day/Lu Yan). Ghosts are in a heightened state and it is impor- study has been performed on characterizing the ambient air
tant to hold a large feast to please them and bring luck to the PAH concentrations emitted during a massive joss paper open-
family. In the last day of this month the ghosts and spirits leave burning event held at a suburban site,4c while the elemental
the earth and the gates of Hell nally close. These three compositions emitted from open air burning of joss paper have
This article is licensed under a Creative Commons Attribution 3.0 Unported Licence.
important days are celebrated and family members pray to God never been investigated. Consequently, this study was aimed at
and for their ancestors, make offerings of food and drink and investigating the impact of outdoor burning of joss paper and
Open Access Article. Published on 16 July 2015. Downloaded on 5/3/2021 10:02:49 AM.
burn a signicant amount of joss paper, hell bank notes and incense during the Hungry Ghost Festival on air quality in
incense throughout Singapore (and other countries with a urban areas. In order to differentiate between the background
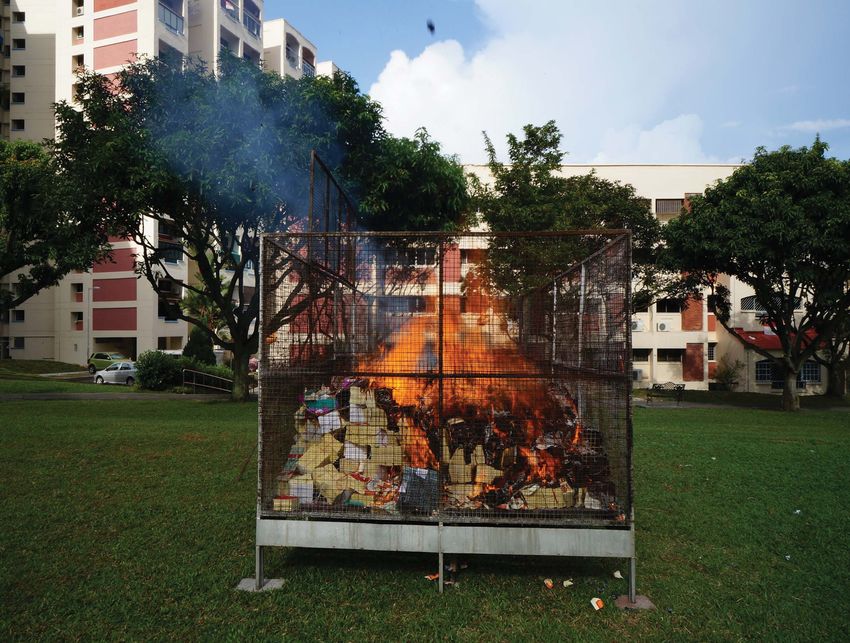
Chinese population). Fig. 1 illustrates the large scale burning of air pollution of Singapore and the concurrency of the Ghost
joss paper in the aernoon of the 15th day of the Ghost Month. month with haze events brought about by transboundary air
Fig. S1 (Groups A, B and C) and Video S1 in the ESI† provide pollution (due to biomass burning in Indonesia), the Ghost
more details about Ghost Month celebrations. In recent years, Month data were compared with long-term environmental
new “luxury goods” made from joss paper, cardboard or papier- sampling collected over a 5 year period at a site at Nanyang
mâché have been introduced into the market for burning, with Technological University (NTU). The average PM10 value in
the items ranging from representations of clothing, computers, Singapore is 40 mg m 3. PM10 values above 60 mg m 3 are typi-
cars, houses, jewelry, watches, beer cans and even models of cally associated with the transboundary air pollution from
servants. biomass burning events (“haze”) from nearby Indonesia. In
Despite the high number of burning events, relatively few order to remove uncertainty in the pollution originating from
studies have been performed regarding pollutants released the Ghost festival with coincident pollution from trans-
from joss paper and incense which are known to generate large boundary biomass burning, data from days with PM10 > 60
quantities of particulates.3 The burning process has also been values were excluded from the comparisons.
shown to release polychlorinated dibenzo-p-dioxin/dibenzo- The atmospheric PM detected due to the Ghost Month
furan (PCDD/F), polycyclic aromatic hydrocarbons (PAH)4 and burning events will naturally increase as the sampling device
metals.5 is placed closer to the point of burning. In this study, the
sampling site was located away from residential areas so that
there was no burning associated with the Hungry Ghost
Festival within a 2 km radius (the sampling site location and
the closest burning site locations are provided in Fig. S2(b) in
the ESI†). We were interested in determining how the Hungry
Ghost Festival affected the background pollution levels in
airborne particulate matter and rainwater, which required a
comparison with data collected from a high volume PM2.5
sampler and rain collection system over a long period. Since
no long-term background data are available at the sites used
for burning, the NTU site provided the best measure of how
background levels varied due to the Hungry Ghost Festival.
The increase in elements in the PM2.5 and rainwater observed
over the Hungry Ghost Month indicated that the burnt mate-
rial was dispersed readily into the atmosphere. The environ-
mental data were compared with data collected from unburnt
and burnt (ash) samples of commercial joss paper, incense
and papier-mâché offerings.
2 Materials and methods
2.1 Sampling
Rainwater (using an autosampler, New Star Environmental
LCC, US) and particulate matter (using Ecotech air sampler
HiVol-3000, Australia) samples were collected within the
campus of Nanyang Technological University, in Singapore,
Fig. 1 (Upper) Preparing, and (lower) burning of joss paper on the from August 2009 onward. Airborne particulate matter samples
Ghost Day (15th day). were collected on Emfab lters (Borosilicate glass microbers
This journal is © The Royal Society of Chemistry 2015 Environ. Sci.: Processes Impacts, 2015, 17, 1578–1586 | 1579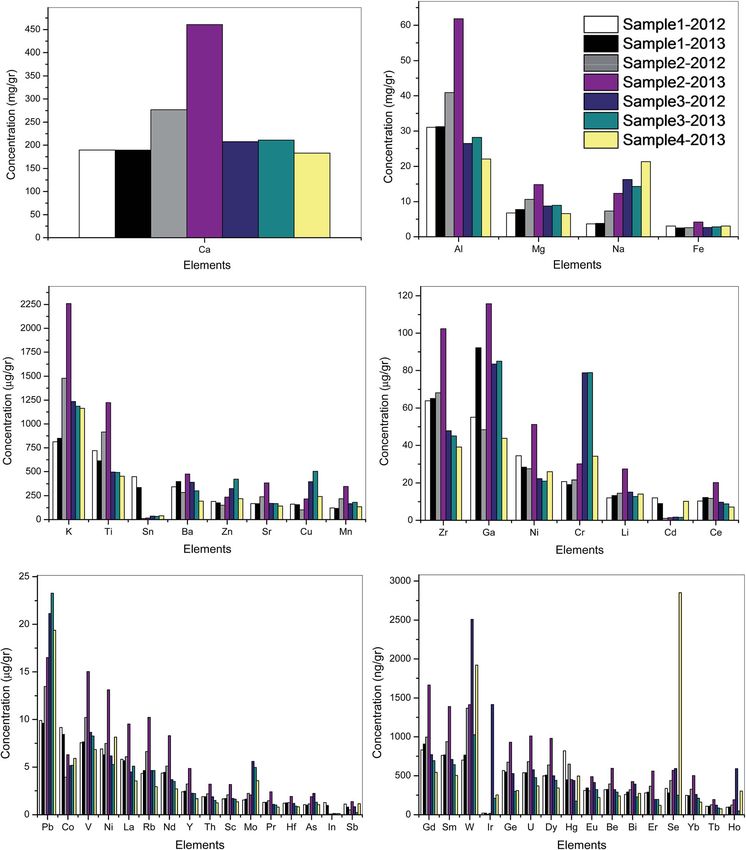
View Article Online
Environmental Science: Processes & Impacts Paper
reinforced with woven glass cloth and bonded with PTFE, size: consisted of 20 mM methanesulfonic acid and the chemical
8 10 inch, Pallex, Emfab TX40HI20-WW, Pal, USA). This regenerant consisted of 100 mM tetrabutylammonium
location encompasses different potential sources of anthropo- hydroxide. Anion IC experiments were performed with a
genic activities as it is located approximately 8 km north of the Dionex ICS-1100 utilizing an Ion Pac AS22 4 mm 250 mm
Tuas and Jurong Island districts which are the most industri- analytical column. For anion IC, the eluent consisted of
alized areas of the country, and also lies within 300 m of the Pan 4.5 mM sodium carbonate and 1.4 mM sodium bicarbonate
Island Expressway (PIE), a major motorway with heavy truck and an electrochemical suppressor was used.
traffic (Fig. S2(c) in the ESI†). The air pollutants encountered in Inductively coupled plasma. Both inductively coupled
the region are expected to be of both particulate and gaseous in plasma-optical emission spectroscopy (ICP-OES) and induc-
This article is licensed under a Creative Commons Attribution 3.0 Unported Licence.
nature, coming from vehicle emissions and industrial activities. tively coupled plasma-mass spectrometry (ICP-MS) were used to
Bottom ash samples from burning joss paper and incense were analyze acidied samples for trace elements. In the rst two
Open Access Article. Published on 16 July 2015. Downloaded on 5/3/2021 10:02:49 AM.
collected immediately aer each event in different residential years of this study elemental measurements were performed
locations in 2012 and 2013 during the Ghost month. with a Thermo Scientic iCAP 6500 spectrometer in both axial
and radical modes. Since the concentration of some trace
2.2 Sample preparation elements in samples was not detected by ICP-OES, samples were
analyzed using an Agilent 7700 series ICP-MS (Japan) equipped
Rainwater samples. Samples were collected immediately
with a 3rd generation He reaction/collision cell (ORS3) to
aer the rain event or in the early morning following night
minimize interference from January 2011. Final optimized
precipitation events. The samples were separated into two
instrumental operating parameters for this application are
aliquots. An unltered aliquot was used for pH (using Metrohm
summarized in Table S2 in the ESI.† The analysis of samples
826 pH meter) and electrical conductivity (EC, using IONcheck
using both ICP-MS and ICP-OES helped to test the possibilities
30 Conductivity Meter) measurements while the remaining
of potential interference, since the two techniques suffer from
aliquot was ltered through a 0.22 mm cellulose acetate
different interference effects.
membrane for ion chromatography and inductively coupled
Data analysis. Data were processed using a Windows based
plasma (ICP) measurements.
application written in the C# programming language in the .Net
PM2.5, joss paper, incense and bottom ash samples.
platform. All the statistical tests (arithmetic means, maximum
Collected samples were placed in microwave (MW) digestion
and minimum values, standard deviations, percentiles and
vessels, and appropriate reagents (Table S1 in the ESI†) were
medians) were run with the same application prior to using the
added sequentially. The vessels were capped, placed in the MW
data in graphical plots.
system, and digested. Aer cooling to room temperature,
extracts were diluted using ultrapure water, ltered through 0.2
mm syringe lters and carefully transferred to ICP sample vials 3 Results and discussion
for elemental analysis. The Emfab lters used to collect PM2.5 3.1 Phase I
samples were tested to check for the presence of any impurities.
Phase I of this study involved the continuous collection of
The concentrations of target elements were measured by ICP-
rainwater and atmospheric PM2.5 samples between August 2009
MS in solutions of the lter that were digested the same way as
and December 2013 at the NTU sampling site (551 PM2.5 and
the samples. It was found that the lter materials contributed
574 rainwater samples).
negligible interference to the analysis.
Particulate matter. The impact of the Ghost Month on
Microwave digestion. Two programmable microwaves
particulate matter was evaluated by measuring the changes of
(MARS 5, CEM Corp., Matthews, NC, USA and Anton Paar
the monthly mean concentrations compared to yearly means for
Multiwave PRO, Austria) were used as the closed vessel diges-
each element. High haze period data (data from days with PM10
tion systems. Effective digestions were achieved by setting the
> 60 values) and special events (such as industrial res) that
microwave program and power settings and optimizing the
were considered as known pollution sources for a short period
nature and amount of acids. Standard reference material 2783
were excluded from the dataset except for a few days in year
(SRM 2783) of Urban Particulate Matter samples was used to
2012 because of coincidence of the ghost month with the haze
validate the method. The extraction efficiencies (determined by
period. Statistical data (Table S3 in the ESI†) collected from year
the % recoveries) were >80% for all of the elements present in
2010 to 2013 for PM2.5 showed an increase in concentrations for
the reference material. Spiked samples were used to evaluate
most of the elements during August and September (7th month
the MW method for bottom ash samples and original joss paper
of Chinese New Year) suggesting a strong contribution of
and incense. The PM and bottom ash samples were digested
burning events to release particulate matter during the Hungry
using the protocols summarized in the ESI document (Table S1
Ghost Festival. Table 1 lists dates of the Hungry Ghost Festival
in the ESI†).
and Ghost Day that occurred during this study.
For PM2.5, the major elements (Na, Ca, Zn, K, Al, and Mg)
2.3 Analysis appeared in concentrations ranging from 5 ng m 3 to a
Ion chromatography (IC). Cation IC experiments were per- maximum of approximately 50 000 ng m 3 (50 mg m 3). The
formed with a Dionex ISC-900 utilizing an Ion Pac CS12A 4 mm concentrations of trace elements were found to vary from values
250 mm analytical column. For cation IC, the eluent less than the detection limit to a maximum of 1 mg m 3.
1580 | Environ. Sci.: Processes Impacts, 2015, 17, 1578–1586 This journal is © The Royal Society of Chemistry 2015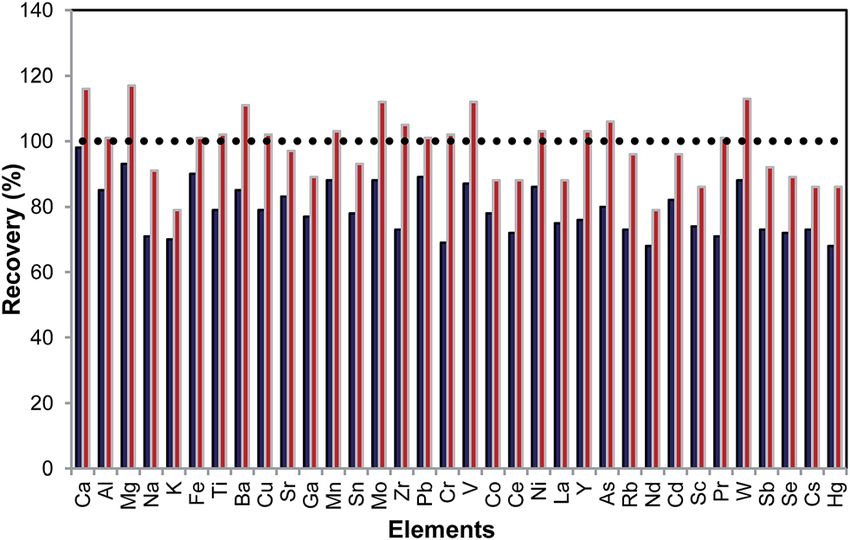
View Article Online
Paper Environmental Science: Processes & Impacts
Table 1 Ghost Festival and Ghost Day from 2009 to 2013
Year Hungry Ghost Festival Ghost Day
2009 20 Aug–18 Sep 2 Sep
2010 10 Aug–7 Sep 24 Aug
2011 31 July–28 Aug 14 Aug
2012 17 Aug–15 Sep 30 Aug
2013 7 Aug–4 Sep 20 Aug
This article is licensed under a Creative Commons Attribution 3.0 Unported Licence.
Concentration time series graphs were examined to nd out the
Open Access Article. Published on 16 July 2015. Downloaded on 5/3/2021 10:02:49 AM.
impact of different industrial and local events on the compo-
sition of airborne particulate matter at the NTU sampling site. It
was notable that the percentage concentrations of a large
number of the elements (listed in Table S3 in the ESI†)
increased during August and September and this nding was in
agreement with rainwater results (see discussion below).
The PM2.5 elemental composition data indicated that the
average concentration of many elements during the Ghost
Month was higher than their monthly and annual averages.
Table S4 in the ESI† contains a comparison of the absolute
chemical composition of PM2.5 (mg m 3) during August and
September (Ghost Month Festival) and the yearly monthly
average.
Fig. 2 presents data for 9 metals that are listed among the
188 hazardous air pollutant substances (“HAPS” or “air toxics”)
dened under the Clean Air Act Amendments of 1990 (ref. 7)
(Fig. S3 and Tables S3 and S4 in the ESI† include the full list of Fig. 2 Percentage increase in the elemental chemical composition of
the analyzed elements). Fig. 2 shows that there is a signicant PM during August and September (Ghost month festival).
increase during the Ghost Month from 2010 to 2013 (data for
2009 have not been included since the yearly average is not
available). It can be seen in Fig. 2 that the majority of the individual rainwater events ranged from 3.22 to 6.24), with the
increase in the elemental composition occurred in August, acidity mainly originating from sulfuric acid levels (45%), and
except for the year 2012 where the commencement of the Ghost with a smaller contribution from nitric acid (19%).12 The ionic
month was late. September 2011 experienced the lowest impact concentration of rainwater samples measured by ion chroma-
since the ghost month ended in August for this year. tography (IC) for the ve years followed a trend of SO42 > Cl >
In general, the results indicated that Zn, Ca, K, Mg, Fe and Al NO3 for anions and Ca2+ > Na+ > K+ > NH4+ > Mg2+ for cations.
followed by Zr > Ba > Sn > V > Na Ti Mn Cu showed the The ions were found in their highest values mostly during
greatest percentage increase in their concentrations (34–60%) August and September. It is noteworthy that the concentration
while As > W > Sr > Ni > Co > Rb > Cd > Cr > Pb > Mo > Ce > Sb of Mg2+ increased signicantly and the cation order changed
varied between 18 and 40%. The major health related effects of to Ca2+ > K+ > Na+ Mg2+> NH4+ for the August/September
inhalation of many of the listed elements (Na, Al, Pb, Cd, Ni and period. Elemental analysis of the rainwater samples by ICP-OES
Cr) to the lungs, kidney and heart are well known and poten- and ICP-MS showed the same trend for the August/September
tially of concern.8 periods. Zn, Ca, K, Mg, Fe and Al were the major elements fol-
According to the few studies that have been performed lowed by Sn > V > Na Mn Ti Cu > As > W > Ni > Co > Cd >
regarding the elemental and organic constituents of incense Cr > Pb.
smoke produced through burning, it was found that the major The results indicated that substantial increase in the
components are inorganic compounds with some carcinogenic concentration of ions and elements in rainwater samples was
elements.5c,9 The Lau and Luk study in 2001 was the only liter- observed in the beginning, mid and at the end of Ghost month
ature source that showed joss paper burning released a signif- for all years which can be assigned as due to burning large
icant source of elements such as Fe, Cu, Zn and Pb.10 amount of joss paper and incense throughout Singapore (a
Rain. Rainwater that falls in Singapore is collected in local strong fragrant smoke smell pervades during these days).
catchment areas (which comprise two thirds of Singapore's total Fig. 3 displays the uctuation of concentration of the major
land area) and makes up approximately 20% of Singapore's ionic components of rainwater samples collected during the
water needs.11 Analysis of the rainwater showed that the average Ghost month. The red vertical lines in Fig. 3 correspond to the
pH value over the sampling period was 4.34 0.52 (pH of 1st, 15th and nal day of the Ghost month for each year as
This journal is © The Royal Society of Chemistry 2015 Environ. Sci.: Processes Impacts, 2015, 17, 1578–1586 | 1581
View Article Online

                                                                                                 Environmental Science: Processes & Impacts                                                                                                Paper
           This article is licensed under a Creative Commons Attribution 3.0 Unported Licence.
Open Access Article. Published on 16 July 2015. Downloaded on 5/3/2021 10:02:49 AM.

                                                                                                 Fig. 3   Concentration profiles of rainwater chemical composition during the Ghost Month Festival.

                                                                                                 1582 | Environ. Sci.: Processes Impacts, 2015, 17, 1578–1586                                This journal is © The Royal Society of Chemistry 2015
View Article Online
Paper Environmental Science: Processes & Impacts
indicated in Table 1. The highest concentration was observed in K > Al/Fe > Mg > Na > Mn > Ba > Ti > Sr > Zn > Rb > Ga > Cu > Pb >
rain events aer the 1st, 15th and end day of the Ghost month Cr > V > Ce > Ni > W > As > Nd > Y > Co > Cs > Hg > Sn > Cd > Sc >
due to massive burning of joss paper and incense in those Se > Sb. These results indicate that aer Ca, K has the higher
special days. However, the relationship between precipitation average composition in incenses while Al has the higher average
events and the Hungry Ghost Festival is complicated because, composition in joss paper.
unlike the PM2.5 data which are collected continuously, the rain Hsueh et al.13 studied the composition (Na, Ca, Mg, Al, K, Fe,
frequency does not necessarily perfectly match the days with the Cu, Pb, Sr, Mn and Zn) and the distribution of the emitted
highest burning. Nevertheless, the high frequency of rain events particles (aerodynamic diameter 0.01–100 mm) during the
in Singapore in the August–September period over the 5 year burning process of joss paper. Their results showed that
This article is licensed under a Creative Commons Attribution 3.0 Unported Licence.
period did indicate that there is a notable correlation between elements were partly released in emitted particles mostly in the
an increase in the ionic concentration of the precipitation and form of PM2.5 (>70% for Na, Al, Pb, and Cu) and smaller parti-
Open Access Article. Published on 16 July 2015. Downloaded on 5/3/2021 10:02:49 AM.
the major burning events (Fig. 3). cles. Fang et al.3c also demonstrated that the ner particulates
The concentrations of cations and anions both fell signi- (PM2.5) make up the majority of emitted particulates in temples.
cantly aer the rst or second rain event. The highest ionic According to these ndings and the list of the elements
concentrations were measured during the Ghost month in 2012 presented in this study, the composition of the particulate
because of the coincidence of the Ghost month and the trans- matter generated from joss paper and incense burning is
boundary haze period. Na+ and Ca2+ are present in much higher alarming. In addition, it has been reported that the presence
concentrations in the cation concentration prole, while K+ of transition metals (Cu, Fe and Zn) which might act as cata-
shows a higher concentration as an index of biomass burning in lysts increase the formation of some organic chemicals such
year 2012. Mg2+ also shows a high concentration during these as polychlorinated dibenzo-p-dioxins (PCDDs) and poly-
events. chlorinated dibenzofurans (PCDFs).14
It can be seen from the plots in Fig. 3 that there were Bottom ash from the burnt incense and joss paper. Bottom
differences in the absolute concentrations of ions detected in ash samples are the solid product remaining from the burning
the rainwater from year to year, which is likely to occur due to process of joss papers and incense. It can be seen from Table
two major reasons. Firstly, the background levels in the rain S5(b) in the ESI† that the trend in the metallic chemical
samples can vary due to local industrial events unrelated to the composition of the bottom ash from burnt joss paper and
Hungry Ghost Festival as well as from transboundary pollution incense is similar to that observed for the unburnt joss paper.
from Indonesia or Malaysia. Secondly, the quantities of mate- Hsueh et al.13 showed that most of the elements released aer
rials released into the atmosphere each year due to the festival burning of joss paper are also present in the bottom ash.
burning are not the same and will vary depending on the It can be seen in Table S5(b)† that there are some differences
number of res, the quantities of materials burnt, the exact in the transition metal content (such as Sn, Pb, Cr, Ni and W)
locations of the re pits, the period of time that ash is le before between the different joss paper bottom ash samples. This
clean-up, and the exact meteorological conditions. Therefore, composition difference is likely related to the varying textures
the absolute concentrations are less signicant than the and the paint that are used in the different types of the joss
percentage increase observed during the times of burning for papers. Lau and Luk concluded that the pollution composition
both the PM2.5 as well as the rain samples. varied depending on the exact type of the joss paper.10
Analysis of bottom ash data from incenses indicated that
incense No. 3 showed higher concentrations of Ba, Cu, Sr, Ga,
3.2 Phase II Zn, Mn and W than the other samples. From Table S5(b) in the
The second phase of this project was commenced in January
2011 to determine the elemental chemical composition of the
unburnt and burnt (bottom ash) samples from joss paper and
incense collected during the Ghost month in order to further
investigate the link with the annual spikes in pollution in the
August/September period (compared to the yearly averages).
Incense and joss paper analysis (unburnt). Prior to the
analysis of bottom ash samples, the elemental composition of
the unburnt incense and joss paper commonly used during the
ghost month festival was determined. Table S5 in the ESI†
provides the distribution of the elements for different types of
joss paper and incense. From the data in Table S5(a)† it is
apparent that the Ca content is the highest in the unburnt joss
paper and incense. Generally, the elemental composition order
for the unburnt joss paper samples is Ca > Al > Na > Mg > K > Fe
> Ti > Ba/Cu > Sr > Ga/Zn > Mn > Sn > Mo > Zr > Pb > Cr > V > Co >
Ce > Ni > La > Y > As > Rb > Nd > Cd > Sc > Pr > W > Sb > Se > Cs > Fig. 4 Recovery test for bottom ash ( ) and unburnt original ( )
Hg while the elemental composition for unburnt incense is Ca > of JP7.
This journal is © The Royal Society of Chemistry 2015 Environ. Sci.: Processes Impacts, 2015, 17, 1578–1586 | 1583View Article Online
Environmental Science: Processes & Impacts Paper
ESI,† it can also be concluded that the incense bottom ash has both bottom ash and unburnt joss paper and incense to validate
lower concentrations of Cu, Zn, Pb, Cr and Co than the bottom the method. An identical trend was observed for various types of
ash from joss papers, while Mn, Ni and As were present in joss paper and incense. Table S6 in the ESI† shows the recovery
higher concentrations than the bottom ash from joss papers. for different types of joss paper and incense that varies from 68
Since there is not any Certied Reference Material (CRM) to 98% and from 79 to 123% for bottom ash and unburnt joss
available for paper/cardboard, recovery tests were performed for paper and incense, respectively. Fig. 4 shows a representative
This article is licensed under a Creative Commons Attribution 3.0 Unported Licence.
Open Access Article. Published on 16 July 2015. Downloaded on 5/3/2021 10:02:49 AM.
Fig. 5Concentration profiles of bottom ash samples collected during the Hungry Ghost Festival in years 2012 and 2013 in different parts of
Singapore.
1584 | Environ. Sci.: Processes Impacts, 2015, 17, 1578–1586 This journal is © The Royal Society of Chemistry 2015View Article Online
Paper Environmental Science: Processes & Impacts
example for bottom ash of joss paper (JP7) which shows that the or the 15th day from the Spring Equinox, usually occurring
recovery is oen less than 90%, with Na, K and Cr having the around April 4th or 5th of the Gregorian calendar) since resi-
lowest recovery. Hsueh et al.13 suggested that bottom ash dents follow the same custom of making burning offerings.
digestion is more difficult than digesting the unburnt material However, during these two events the burning mainly takes
because of the strong post burning binding energy. place in furnaces of the temples. While a large amount of
Bottom ash samples collected from burning events. 7 combustion occurs, the impact is much lower than the Hungry
bottom ash samples were collected during the Hungry Ghost Ghost Festival because the burning occurs in closed furnaces
Festival from burning containers in different parts of Singapore. equipped with ltration systems.
Fig. 5 gives the comparison of the chemical composition of the 7
This article is licensed under a Creative Commons Attribution 3.0 Unported Licence.
collected bottom ash samples. Notably, as well as the major 4 Conclusions
elements, all of the trace elements including the HAPS listed in
Open Access Article. Published on 16 July 2015. Downloaded on 5/3/2021 10:02:49 AM.
Fig. 2 were detected in the burnt and unburnt incense and joss A ve year continual investigation of rainwater and atmospheric
paper samples. The elemental contents were categorized into 5 PM2.5 indicated consistently higher concentrations for many
groups according to their concentration range. elements during August and September, which can be linked to
(a) Ca was present in the highest amount (high mg g 1). the extensive outdoor burning events that occur during the
(b) Al, Mg, Na and Fe were present in the next highest Hungry Ghost Festival. The individual elements detected in the
concentrations (mg g 1). PM2.5 over the Hungry Ghost period were 18–60% higher than
(c) K and Ti were the major elements in the third group those of the average background.
followed by Ba, Zn, Sr, Cu and Mn. Surprisingly Sn showed very In general, Ca is present in the highest concentration in the
high concentrations (400 mg g 1) for the rst two samples unburnt joss paper followed by Al. For incense, Ca is also
while for the rest of the samples the Sn concentration varied present in the highest concentration followed by K. The
from 11 to 40 mg g 1, which likely relates to different types of concentration of Cu, Zn, Mn, Mo, Pb, Cr, V, Co, Ni and Cd
joss paper and incense that were used for burning. uctuated in the different types of joss paper and incense,
(d) The concentrations of Pb, Co, V, Ni, La, Rb, Nd, Ba, Y, Th, presumably according to the raw material and production
Sc, Mo, Pr, Hf, As, In and Sb were less than 25 mg g 1 and are process. The chemical composition and the order of concen-
considered as the moderate concentration. tration of the elements detected in the bottom ash of the burnt
(e) The last group has been listed as low concentration joss paper and incense are similar to those observed for the
elements (ng g 1) including Gd, Sm, W, Ir, Ge, U, Dy, Hg, Eu, Be, unburnt joss paper and incense.
Bi, Er, Se, Yb, Tb and Ho. A major conclusion of this study is that the pollution
As part of an effort to preserve racial and religious harmony generated by open burning of joss paper and incense requires
in multicultural Singapore, the National Environmental Agency more attention. There is currently a lack of corroborating
(NEA) provides burning pits and containers to encourage people information about the impact on air quality and air pollutants
to burn joss papers and incense sticks responsibly during emitted from open burning of joss paper and incense burning.
festivals. Frequently, the designated containers provided are Furthermore, there are limited literature reports of evidence for
not sufficient and people resort to burning joss papers and epidemiological links between respiratory disease and skin
incense sticks on the pavements, grass elds or common allergies and burning of incense and joss paper in an indoor or
corridors at the ground level near their residential high rise outdoor environment. However, unofficially it has been repor-
buildings. ted that a greater number of patients during this festival period
However cleaners are also deployed to clear up the residual seek treatment for ailments such as asthma, eye irritation, and
ashes in the neighbourhood on a daily basis; although in some nasal and skin allergies.17
areas the ashes are le inside the containers for the whole In order to respect religious practices and not to disturb
month and are blown by the wind. These ashes are treated as devotees (pilgrims) bottom ash samples were collected aer the
normal waste and are disposed in either in incinerators or in an festivals. However, it is believed that in order to better investi-
offshore sanitary landll where the components can penetrate gate the health effects caused by inhalation of particulate
into the groundwater.15 Unfortunately, some people believe matter emitted from burning; the sampling would preferably be
that drinking a slurry of burned joss paper mixed with water carried out in the festival venues at the same time.
(water is added to bottom ash) can be used to cure diseases, Burning joss paper and incense has been part of religious
protect themselves, rejuvenate their relationships and other ceremonies for thousands of years but some regulatory moni-
remedies.16 toring may be required to control air and water pollution and
reduce the health effects for the greater good of the entire
population. This issue needs government agencies, temple
3.3 Ti Kong Dan Day and Ching Ming Festival boards, religious leaders, research scientists and private rms
An inspection of the dataset showed that a similar pattern of working together to reduce the pollution as much as possible.
increase in the metallic composition in both particulate matter With the utmost respect to this religious practice the concern is
and rain water samples was observed for Ti Kong Dan Day (9th about the control of the pollution and care of devotee's health.
day of Chinese New Year, birthday of the Jade Emperor) and Possible solutions have been proposed, including the
Ching Ming Festival (on the 104th day aer the winter solstice following:
This journal is © The Royal Society of Chemistry 2015 Environ. Sci.: Processes Impacts, 2015, 17, 1578–1586 | 1585View Article Online
Environmental Science: Processes & Impacts Paper
(a) Increased public education on air quality and the H. R. Chao and M. R. Chao, J. Hazard. Mater., 2002, 95, 1–
composition of bottom ash (especially if ingested as a slurry). 12; (f) G. C. Fang, Y. S. Wu, M. H. Chen, T. T. Ho and
(b) Providing closed furnace with a ltering system in J. Y. Rau, Atmos. Environ., 2004, 38, 3385–3391.
convenient areas. 5 (a) R. Caggiano, M. D'Emilio, M. Macchiato and M. Ragosta,
(c) Using eco-friendly materials for production of joss paper Environ. Monit. Assess., 2005, 102, 67–84; (b) F. Eldabbagh,
and incense and control of the production process. A. Ramesh, J. Hawari, W. Hutny and J. A. Kozinski,
Combust. Flame, 2005, 142, 249–257; (c) G. C. Fang,
Acknowledgements C. N. Chang, C. C. Chu, Y. S. Wu, P. P. C. Fu, S. C. Chang
and I. L. Yang, Chemosphere, 2003, 51, 983–991; (d)
This article is licensed under a Creative Commons Attribution 3.0 Unported Licence.
This work was supported by the Singapore Government O. W. Lau and S. F. Luk, Atmos. Environ., 2001, 35, 3113–
Ministry of Education AcRF Tier 1 research grant (RG 61/11), the 3120.
Open Access Article. Published on 16 July 2015. Downloaded on 5/3/2021 10:02:49 AM.
Singapore Ministry of Defence-NTU Joint programme (MINDEF- 6 B. Wang, S. C. Lee, K. F. Ho and Y. M. Kang, Sci. Total
NTU/JPP/12/02/04) grant and the National Research Foundation Environ., 2007, 377, 52–60.
of Singapore under its Campus for Research Excellence and 7 http://www.epa.gov/airtoxics/orig189.html.
Technological Enterprise (CREATE) programme. 8 (a) M. Costa, Human Exposures and Their Health Effects, ed.
M. Lippmam, John Wiley & Sons, Inc, Hoboken, NJ, USA,
References 2nd edn, 2000, pp. 811–850; (b) S. G. Donkin, D. L. Ohlson,
C. M. Teaf, Properties and effects of metals, Principles of
1 (a) J. J. Schauer, M. P. Fraser, G. R. Cass and toxicology: environmental and industrial applications, ed. P.
B. R. T. Simoneit, Environ. Sci. Technol., 2002, 36, 3806– L. Williams, R. C. James and S. M. Roberts, John Wiley &
3814; (b) M. Zheng, R. G. Cass, J. J. Schauer and Sons, Inc, Hoboken, NJ, USA, 2nd edn, 2000, pp. 325–344;
E. S. Edgerton, Environ. Sci. Technol., 2002, 36, 2361–2371; (c) M. E. Gerlofs-Nijland, M. Rummelhard, A. J. F. Boere,
(c) A. Cincinelli, S. Mandorlo, R. M. Dickhut and L. Lepri, D. L. Leseman, R. Duffin, R. P. F. Schins, P. J. A. Borm,
Atmos. Environ., 2003, 37, 3125–3133; (d) C. A. Pope, Aerosol M. Sillanpaa, R. O. Salonen and F. R. Cassee, Environ. Sci.
Sci. Technol., 2000, 32, 4–14; (e) C. I. Davidson, R. F. Phalen Technol., 2009, 43, 4729–4736; (d) S. K. Park, M. S. ONeill,
and P. A. Solomon, Aerosol Sci. Technol., 2005, 39, 737–749. P. S. Vokonas, D. Sparrow, R. O. Wright, B. Coull, H. Nie,
2 (a) J. N. Galloway, G. E. Likens and M. E. Hawley, Science, H. Hu and J. Schwartz, Epidemiology, 2008, 19, 111–120.
1984, 226, 829–831; (b) J. L. Moody, A. A. P. Pszenny, 9 (a) R. E. Rasmussen, Bull. Environ. Contam. Toxicol., 1987, 38,
A. Gaudry, W. C. Keene, J. N. Galloway and G. Polian, J. 827–833; (b) C. Y. Mimi, D. H. Garabran, T. B. Huan and
Geophys. Res., 1991, 96, 769–786; (c) F. L. T. Gonçalves, B. E. Henderson, Int. J. Cancer, 1990, 45, 1033–1039.
M. F. Andrade, M. C. Forti, R. Astolfo, M. A. Ramos, 10 O. W. Lau and S. F. Luk, Atmos. Environ., 2001, 35, 3113–
O. Massambani and A. J. Mel, Environ. Pollut., 2003, 121, 3120.
63–73; (d) P. R. Salve, A. Maurya, R. Sinha, A. G. Gawane 11 (a) C. Tortajada, Int. J. Water Resour. Environ. Eng., 2006, 22,
and S. R. Wate, Bull. Environ. Contam. Toxicol., 2006, 77, 227–240; (b) I. O. B. Luan, Int. J. Water Resour. Environ. Eng.,
305–311; (e) A. Malik, V. K. Singh and K. P. Singh, Bull. 2010, 26, 65–80.
Environ. Contam. Toxicol., 2007, 79, 639–645; (f) 12 B. Khezri, H. Mo, Z. Yan, S.-L. Chong, A. K. Heng and
Y. W. F. Tham and H. Sakugawa, Bull. Environ. Contam. R. D. Webster, Atmos. Environ., 2013, 80, 352–360.
Toxicol., 2007, 79, 670–673. 13 H. T. Hsueh, T. H. Ko, W. C. Chou, W. C. Hung and H. Chu,
3 (a) C. S. Li and Y. S. Ro, Atmos. Environ., 2000, 34, 611–620; (b) Environ. Chem. Lett., 2012, 10, 79–87.
C. W. Fan and J. J. Zhang, Atmos. Environ., 2001, 35, 1281– 14 M. T. Hu, S. J. Chen, Y. C. Lai, K. L. Huang, G. P. Chang-
1290; (c) G. C. Fang, C. N. Chang, Y. S. Wu, C. J. Yang, Chien and J. H. Tsai, Aerosol Air Qual. Res., 2009, 9, 369–377.
S. C. Chang and I. L. Yang, Sci. Total Environ., 2002, 299, 15 (a) J. Robson, Hist. Religions, 2008, 48, 130–169; (b) Taoism,
79–87. ed. Z. Mou, (Trans: J. Pan, S. Normand), Leiden [The
4 (a) H. H. Yang, R. C. Jung, Y. F. Wang and L. T. Hsieh, Atmos. Netherlands], Boston, Brill, 2012, pp. 293–308.
Environ., 2005, 39, 3305–3312; (b) C. C. Lin, S. J. Chen, 16 (a) http://app2.nea.gov.sg/energy-waste/waste-management/
K. L. Huang, W. J. Lee, W. Y. Lin, J. H. Tsai and overview; (b) http://app2.nea.gov.sg/energy-waste/waste-
H. C. Chaung, Environ. Sci. Technol., 2008, 42, 4229–4235; management/solid-waste-management-infrastructure.
(c) M. D. Lin, J. Y. Rau, H. H. Tseng, M. Y. Wey, C. W. Chu, 17 http://www.healthxchange.com.sg/News/Pages/More-ailments-
Y. H. Lin, M. C. Wei and C. H. Lee, J. Hazard. Mater., 2008, during-Hungry-Ghost-Festival.aspx.
156, 223–229; (d) S. C. Lung and S. C. Hu, Chemosphere,
2003, 50, 673–679; (e) T. C. Lin, F. H. Chang, J. H. Hsieh,
1586 | Environ. Sci.: Processes Impacts, 2015, 17, 1578–1586 This journal is © The Royal Society of Chemistry 2015You can also read