COMBINING ENVIRONMENTAL AND LANDSAT ANALYSIS READY DATA FOR VEGETATION MAPPING: A CASE STUDY IN THE BRAZILIAN SAVANNA BIOME - The International ...
←
→
Page content transcription
If your browser does not render page correctly, please read the page content below
The International Archives of the Photogrammetry, Remote Sensing and Spatial Information Sciences, Volume XLIII-B3-2020, 2020
                                                 XXIV ISPRS Congress (2020 edition)

          COMBINING ENVIRONMENTAL AND LANDSAT ANALYSIS READY DATA FOR
         VEGETATION MAPPING: A CASE STUDY IN THE BRAZILIAN SAVANNA BIOME

                  H. N. Bendini1 ∗, L. M. G. Fonseca1 , M. Schwieder2 , P. Rufin2 , T. S. Korting1 , A. Koumrouyan1 , P. Hostert2,3
    1
        INPE, National Institute for Space Research, Sao Jose dos Campos, Brazil - (hugo.bendini, leila.fonseca, thales.korting)@inpe.br
                                 2
                                   Geography Department, Humboldt-Universität zu Berlin, Berlin, Germany -
                                      (marcel.schwieder, philippe.rufin, patrick.hostert)@geo.hu-berlin.de
             3
               IRI THESys, Integrative Research Institute on Transformations of Human-Environment Systems, Berlin, Germany

KEY WORDS: Vegetation mapping, Cerrado, Phenology, Data mining, Random Forest

ABSTRACT:

The Cerrado biome in Brazil covers approximately 24% of the country. It is one of the richest and most diverse savannas in the
world, with 23 vegetation types (physiognomies) consisting mostly of tropical savannas, grasslands, forests and dry forests. It is
considered as one of the global hotspots of biodiversity because of the high level of endemism and rapid loss of its original habitat.
This work aims to analyze the potential of Landsat Analysis Ready Data (ARD) in combination with different environmental data
to classify the vegetation in the Cerrado in two different hierarchical levels. Here we present results of a pixel-based modelling
exercise, in which field data were combined with a set of input variables using a Random Forest classification approach. On the
first hierarchical level, with the three classes savanna, grasslands and forest, our model results reached f1-scores of 0.86, 0.87 and
0.85 leading to an overall accuracy of 0.86. In the second hierarchical level we differentiated a total of 12 vegetation physiognomies
with an overall accuracy of 0.77.

                        1. INTRODUCTION                                   rado, which, together with other projects financed by the FIP in
                                                                          Brazil, should promote the sustainable management of forests.
The Brazilian Savanna, also known as Cerrado, is the second               In the context of this project, one of the activities it to modify
largest biome in Brazil (MMA, 2015), considered as a biod-                the existing land cover classification system for the Cerrado de-
iversity hotspot and providing environmental services of global           veloped by IBGE (Brazilian Institute of Geography and Stat-
importance. Despite that, the Cerrado has lost around 88 Mha              istics) on the basis of the Food and Agriculture Organization
(46%) of its native vegetation with a projection that 31-34% of           of the United Nations (FAO) Land Cover Classification System
the remaining biome is likely to be cleared by 2050 (Strassburg           framework. Therefore, it will be possible to discriminate forest
et al., 2017). The rate of conversion of native Cerrado vegeta-           from non-forest vegetation taking into account the spectrum of
tion is up to two times the conversion observed in the Amazon             structural vegetation complexity in the Cerrado. However, map-
in the past five years (Rocha et al., 2011). Most of the native           ping heterogeneous tropical areas, such as the Cerrado, is chal-
vegetation conversion tends to occur in areas with dense ve-              lenging due to the natural, climatic and topographic factors and
getation that have favorable climate and soil conditions and in           the peculiarities of the characteristic physiognomies.
flat terrains that are suitable for mechanized farming (Alencar
et al., 2020). The conversion of natural vegetation into agricul-         To make mapping approaches comparable Ribeiro and Walter
tural land is leading to major carbon emissions (Noojipady et             (2008) divided the major Cerrado formations into a dominant
al., 2017) and biodiversity loss (Ratter et al., 1997), stressing         herbaceous stratum (Grasslands), shrublands (savannas) and a
the importance of frequent mapping approaches that enable to              woody-dominated stratum (Forests).
monitor and assess ongoing change processes.
                                                                          It has been shown that remote sensing based approaches have
The Brazil Investment Plan (BIP) under the Forest Investment              the potential for mapping these classes, but the strong season-
Program (FIP) seeks to promote sustainable land use and forest            ality of natural vegetation and the spectral ambiguities between
management improvement in the Cerrado Biome in order to                   some physiognomies makes it hard to differentiate them (Sano
reduce pressure on remaining forests, reduce greenhouse gas               et al., 2010, Grecchi et al., 2013).
(GHG) emissions and increase carbon dioxide sequestration
(Tuchschneider, 2013). As part of BIP, the project ”Develop-              While the Brazilian National Institute for Space Research’s of-
ment of systems to prevent forest fires and monitor vegetation            ficial deforestation and land use maps still rely mostly on visual
cover in the Brazilian Cerrado” aims to improve Brazil’s capa-            image interpretation (INPE, 2019b), some (semi-) automatic
city to monitor deforestation, prevent the risk of forest fires and       approaches have been developed by Ferreira et al. (2007) ,
improve models for estimating greenhouse gas (GHG) emis-                  Neves et al. (2019) , Girolamo-Neto et al. (2017) , Schwieder et
sions, making tools and data available to environmental agen-             al. (2016) . Even though these approaches are useful in specific
cies 1 .                                                                  case studies, they were usually restricted to comparably small
                                                                          extents and do not account for variations in environmental char-
The project will provide the basis for improving the manage-              acteristics present across the entire Cerrado extent.
ment of water, forest and soil resources in the Brazilian Cer-
∗   Corresponding author                                                  Previous studies highlighted the benefits of dense remote sens-
1   More information in: http://fip.mma.gov.br/projeto-fm/                ing time series, derived land surface phenological metrics (LSP)

                                                   This contribution has been peer-reviewed.
                     https://doi.org/10.5194/isprs-archives-XLIII-B3-2020-953-2020 | © Authors 2020. CC BY 4.0 License.                 953
The International Archives of the Photogrammetry, Remote Sensing and Spatial Information Sciences, Volume XLIII-B3-2020, 2020
                                               XXIV ISPRS Congress (2020 edition)

and analyzed their relationship to the grassland-savanna-forest      July, 2019, in which a group of specialists on vegetation visu-
gradient of the Cerrado. They suggested the importance of in-        ally identified the classes and registered them on a Global Posi-
tegrating other environmental variables, such as terrain (Sano et    tioning System (GPS)-enabled tablet. The stopping points were
al., 2019, Bendini et al., 2019b, Schwieder et al., 2018).           selected randomly.

Recent advances in remote sensing technologies offer great op-       A mosaic composed of the most recent available Landsat-8
portunities for mapping land use and land cover over large ex-       OLI images was used to navigate along the regions by using
tents. Several operational sensor systems are currently in orbit     a GPS device connected to a tablet. High resolution images
and the development of infrastructure for remotely sensed data       available in Google Earth were used as auxiliary data. We
storage and dissemination enables to consistently derive ARD         used the physiognomy definitions described in Table 1, based
(Potapov et al., 2020, Frantz, 2019). This development is cata-      on the first and second hierarchical level of Ribeiro and Wal-
lyzed by the accessibility of cloud computing platforms (e.g.        ter (2008) classification system. These physiognomies were
Amazon Web Services (AWS), Google Earth Engine (GEE) and             defined by Ribeiro and Walter (2008) and consist in a hier-
Microsoft Azure), and the rapid evolution of machine learning        archical classification structure. The first hierarchical level (re-
approaches in the field of remote sensing. Together, these devel-    ferred as level-1) consists on three classes: grassland, savanna
opments enable to explore the full potential of integrated data      and forest; which are further split in a total of 12 sub classes in
analyses, in which metrics derived from time series of ARD           level-2.
(e.g., phenological or spectral-temporal metrics) are combined       We compiled the reference data for both thematic levels from
with environmental data that are meaningful for a specific do-       several field campaigns and data collection efforts as follows.
main.                                                                We collected 652 ground-truth data points during the roadside
                                                                     surveys: savanna (479), forest (92), grassland (81), from level-
Recently, Alencar et al. (2020), as part of the MapBiomas            1, and for level-2: Campo limpo (14), Campo rupestre (58),
project (https://mapbiomas.org), which aims to generate annual       Campo sujo (9), Cerradao (9), Cerrado rupestre (10), Cerrado
land use and land cover classification of Brazil, proposed a         sensu stricto (381), Mata de Galeria and Ciliar (61), Mata de
methodology based on GEE, in which they combined mosa-               galeria (32), Mata seca (22), Palmeiral (14) and Vereda (74).
ics of spectral metrics, including sub-pixel fractions, indices,
individual spectral bands of all Landsat-7 ETM+ (Enhanced            These datasets were completed with the official vegetation map
Thematic Mapper Plus) and Landsat-8 OLI (Operational Land            on a scale of 1:250,000 produced by IBGE in 2012 and updated
Imager) imageries between 1985 to 2017, and slope data from          in 2013. This map was produced by the RADAMBRASIL pro-
ALOS (Advanced Land Observing Satellite) global digital sur-         ject 2 on a scale of 1:1,000,000 and later adaptations were car-
face model with 30 meters (m) spatial resolution. This approach      ried out to the one used in this study. The legend of the veget-
enabled them to classify the vegetation of the entire Cerrado        ation in the Cerrado utilized on the map refers to the one pub-
on an annual basis for the considered period. They achieved          lished in the technical manual of Brazilian vegetation (IBGE,
a very promising overall accuracy of 0.71 considering the 33         2012).
years. Although this is a great effort and contributes to the ana-
lysis of land changes over time, a significant confusion between     We utilized data kindly provided by the State Environmental
grasslands and savannas is apparent in these data. Besides, they     Departments of Brazil, and also included ground samples from
do not account for all vegetation types present in the Brazilian     a public repository (Câmara et al., 2019) . Manually collected
Cerrado. These limitations are critical in the context of public     samples, based on Google Earth image visual inspection, were
policy decisions (e.g., based on the forest code) and, therefore,    also included.
classification errors may affect the implementation of environ-      We prepared annual vegetation cover layers for year 2014 util-
mental conservation efforts in this highly threatened biome.         izing PRODES data (INPE, 2019a) 3 , which includes forest and
                                                                     deforested polygons. We produced a mask based on PRODES
Large-scale mapping of the Cerrado vegetation using remote           data to remove samples that were within deforestation areas.
sensing technologies is still a challenge due to the high spatial    We proceeded a quality screen on samples by visual inspection
variability and spectral similarity among its vegetation types.      based on Google Earth imagery.
To the best of our knowledge, there is no research published
that differentiated the natural vegetation for the entire Cer-       Finally, our reference database comprised a total of 2828
rado, with a high level of thematic detail in terms of vegetation    samples, distributed in the following way. Level-1: savan-
physiognomies.                                                       nas (1250), grasslands (805) and forests (773). For the level-2
                                                                     classes, the database contained samples for Campo limpo (276),
Therefore, the objective of this study is to analyze the potential   Campo rupestre (210), Campo sujo (319), Cerradão (160), Cer-
of Landsat ARD combined with various environmental data to           rado rupestre (162), Cerrado sensu stricto (580), Ipuca (91),
classify the different physiognomies in the Cerrado based on         Mata riparia (446), Mata seca (76), Palmeiral (135), Parque de
two hierarchical levels of thematic detail.                          Cerrado (246), Vereda (127). For this work, as we used data
                                                                     from different sources, we proceeded harmonization between
                                                                     both IBGE legend (IBGE, 2012) and Ribeiro and Walter (2008).
            2. MATERIALS AND METHODS                                 Figure 1 shows the spatial distribution of the samples.
                                                                     2   The Amazon Radar Project (RADAMBRASIL Project, was created in
2.1   Fieldwork and reference data                                       July, 1975, to collect data on mineral resources, soils, vegetation, land
                                                                         use and cartography of the national territory, with the aim of an integ-
                                                                         rated mapping of the natural resources
Reference data were collected during roadside surveys across         3   Available from http://terrabrasilis.dpi.inpe.br/download/dataset/cerrado-
five thousand kilometers on the most important remaining areas           prodes/vector/prodes cerrado 2000 2018 v20190405.zip (download
of natural vegetation in the biome Cerrado during March and              date: 17-Dec-19)

                                               This contribution has been peer-reviewed.
                 https://doi.org/10.5194/isprs-archives-XLIII-B3-2020-953-2020 | © Authors 2020. CC BY 4.0 License.                         954
The International Archives of the Photogrammetry, Remote Sensing and Spatial Information Sciences, Volume XLIII-B3-2020, 2020
XXIV ISPRS Congress (2020 edition)
Level-1 Level-2 Description
Predominantly herbaceous, with rare
shrubs and complete absence of trees.
Campo It is found more frequently on slopes,
Grassland
limpo plateaus, water sources, surrounding
the Veredas and on the edge of gallery
forests.
Predominantly herbaceous and
shrubby, with occasional presence of
Campo
trees up to 2m and occupying stretches
rupestre
of rocky outcrops. It usually occurs at
altitudes above 900m.
Exclusively herbaceous, with sparse
Campo shrubs and sub-shrubs often made up
sujo of less developed individuals of Cer-
rado tree species.
Figure 1. Distribution of the reference samples (n = 2828) across Low and tortuous trees, with irregu-
Cerrado biome. lar and twisted branches, usually with
Cerrado
evidence of burning. In the rainy
Savanna sensu
season the sub-shrub and herbaceous
stricto
The description of the physiognomies of the Cerrado on the first strata become exuberant due to their
and second hierarchical level of (Ribeiro et al., 2008) classific- rapid growth.
ation system is shown in the Table 1. Cerrado A subtype of Cerrado sensu stricto that
rupestre occurs in rocky environments.
2.2 Predictor variables Characterized by the presence of trees
Parque grouped in small elevations of land,
In this section we will describe the predictor variables. We se- de Cer- known as ”murundus”. The trees have
lected informative variables that condition the different forms rado an average height of 3 to 6m and form
of life that characterize the physiognomies described by Ribeiro a tree cover of 5% to 20%.
and Walter (2008) . Forest with similarities to savannas
due to species composition. Tree cover
can range from 50 to 90%. The aver-
We derived Land Surface Phenological metrics (LSP) from a Forest Cerradao
age height of the trees varies from 8
dense Landsat enhanced vegetation index (EVI) time series of to 15m. Although it may be perennial,
the phenological season 2013 - 2014. Time series data gaps, many species show deciduousness.
due to sensor errors or cloud cover, were interpolated using a Mata de Galeria follows small rivers
radial basis convolution filter (Schwieder et al., 2016, Bendini forming corridors. Perennial and
et al., 2019a). A total of 11 LSP were derived using TIMESAT Mata with sudden transition to savannas.
(Jönsson, Eklundh, 2004), extracted for the seasonal cycle ob- de The average height varies between 20
served in the EVI time series. These metrics relate for example Galeria and 30m, with an overlap of crowns
to the start and end of the season, the maximum EVI value of and providing tree coverage of 70 to 95%.
the season or the amplitude and are explained in detail in Jöns- Ciliar Mata Ciliar is alongside medium and
son, Eklundh (2004) . large rivers, where arboreal vegetation
does not form galleries.
Spectral temporal metrics (STM) (Griffiths et al., 2013, Rufin et Characterized by different levels of de-
al., 2015) were calculated for the dry season of the year 2014, ciduous trees, depending on conditions
consisting of the surface reflectance (SR) median values of the Mata and mainly on the depth of the soil.
cloud free pixels of all spectral bands of Landsat images ac- Seca The average height of the trees varies
quired between June and August 2014. between 15 and 25m. Tree cover of 50
to 95%.
To account for variations in less dynamic environmental vari- Characterized by the presence of a
ations we included soil property maps from the Global Gridded single species of arboreal palm. In
Soil Information (SoilGrid) database (Hengl et al., 2017). This general, they are found on well-
Savanna Palmeiral
database is based on global compilation of soil profile data and drained land, although they also occur
environmental layers. The outputs of SoilGrids are global soil on poorly drained land, where galler-
property maps at six standard depth intervals at a spatial resolu- ies can follow the drainage lines.
tion of 250 meters. We included variables related to sand, clay, Physiognomy with the predominance
silt content, and organic carbon concentration as well as the pH of Mauritia Flexuosa arboreal palm
of the soil in 30 centimeters (cm) depth. (Buritis), amid more or less dense
Vereda
clusters of shrub-herbaceous species.
The Veredas are surrounded by Campo
Limpo, which is generally flooded.
Ipucas are fragments of alluvial sea-
Table 1. Description of physiognomies on the 1st and 2nd sonal semi deciduous forests that flood
hierarchical level of Ribeiro and Walter (2008) legend. every six months and occur in the re-
Forest Ipuca
gion of the Araguaia plain due to the
meeting of the Cerrado, Amazonian
and Pantanal biomes.
This contribution has been peer-reviewed.
https://doi.org/10.5194/isprs-archives-XLIII-B3-2020-953-2020 | © Authors 2020. CC BY 4.0 License. 955The International Archives of the Photogrammetry, Remote Sensing and Spatial Information Sciences, Volume XLIII-B3-2020, 2020
XXIV ISPRS Congress (2020 edition)
Height Above the Nearest Drainage (HAND) is a quantitative parametric machine learning algorithm that is based on decision
topographic algorithm based on SRTM (Shuttle Radar Topo- trees. As individual decision trees are prone to errors, RF uses
graphy Mission) data (Rennó et al., 2008). It uses topographic an ensemble of many decision trees that were independently
data to obtain the vertical distance of each pixel in the watershed trained with random subsets of the input data to overcome this
in relation to the drainage. In this way, it is strongly related to limitation (Breiman, 2001). The algorithm implementation in
the water conditions in the soil and, therefore, to the natural R (R Core Development Team, 2019) further allows to assess
vegetation present in the land cover. In this work, the HAND the variable importance of each input variable based on the Gini
data for the Cerrado were generated from the SRTM with spa- coefficient (Liaw et al., 2002).
tial resolution of 1 arc-second in which faults were corrected
by the USGS (United States Geological Survey) based on the The classification accuracy was assessed using Monte Carlo
3-arc-second SRTM. The processes for generating HAND are simulation, in which 1000 simulations were carried out by ran-
as follows: refilling of sinks, calculation of flow direction and domly selecting 70% of the samples to train the RF classifica-
accumulation area, generation of drainage channels. The pro- tion model, while the remaining 30% were used for validation.
cessing task was carried out in TerraHidro (Abreu et al., 2012). In each iteration, a confusion matrix was calculated, and the av-
erage confusion matrix was used to derive the overall accuracy
Terrain data such as elevation, slope, vertical and horizontal and the class-wise f1-scores.
curve were derived from both Topodata database (de Moris-
son Valeriano, de Fátima Rossetti, 2012) as well as Tandem-X Additionally, the model was validated using independent
DEM (Gruber et al., 2012). ground truth samples, which were randomly drawn from a
land cover reference map of the Brasilia National Park. This
Table 2 shows all the selected variables, their brief description map was generated by the Image Processing and GIS Laborat-
and its units of measurement. ory of Federal University of Goiás (LAPIG/UFG) for the year
Predictor Description [units] 2010, based on high resolution imagery, and the map created by
TANDEM X 90 Altitude [m] Manuel et al. (2003). For a visual comparison, we used the final
Topodata HN Horizontal curvature [m] model to map the spatial patterns of the observed vegetation in
Topodata VN Profile curvature [m] the Brasilia National Park.
Topodata SN Slope[%]
BDTICM Absolute depth to bedrock [mc] 3. RESULTS AND DISCUSSIONS
BLDFIE Bulk density [kg/m3 ]
CECSOL Cation Exchange Capacity [cmolc/kg] 3.1 Results
CLYPPT Clay particles [%]
OCSTHA Soil organic carbon stock [ton/ha] On the hierarchical level-1 our model results reached an over-
ORCDRC Soil organic carbon content [permille] all accuracy of 0.86, ranging from 0.82 to 0.90 after 1000 it-
PHIHOX pH index measured in water [pH] erations, with class-wise f1-scores of 0.86, 0.87 and 0.85 for
SLTPPT Silt particles [%] the classes savanna, grasslands and forest. The producers ac-
HAND 1K Vertical Distance [m] curacies for these classes were respectively 0.85, 0.90 and 0.87.
LSP Amp Amplitude [EVI] The related confusion matrix is shown in Figure 2.
LSP BV Base value [EVI]
LSP EoS End of Season [day of the year - DOI]
LSP EoSVal End of Season value [EVI]
LSP LDer Left Derivative [EVI]
LSP LoS Length of Season [DOI]
LSP Mfit Peak [EVI]
LSP MoS Middle of Season [DOI]
LSP RDer Right Derivative [EVI]
LSP S oS Start of Season [DOI]
LSP SoSVal Start of Season [EVI]
STM blue med median SR at Blue band [%]
STM green med median SR at Red band [%]
STM nir med median SR at NIR band [%]
STM swirI med median SR at SWIR I [%]
STM red med median SR at Red band [%]
STM swirII med median SR at SWIR II band [%] Figure 2. Confusion matrix for the classification model of
Level-1.
Table 2. Selected variables, their brief description and its units
of measurement. The level-2 classification with 12 classes was assessed with a
mean overall accuracy of 0.77, ranging from 0.72 to 0.81 Fig-
We re-sampled all data to 30 m x 30 m and tiled it into 60 x 60 ure 3 shows the confusion matrix for the model for classifying
km tiles for mass processing using FORCE (Frantz, 2019). level-1.
2.3 Classification and Validation The five most important variables for the level-1 clas-
sification model were the Tandem-X elevation (TAN-
The predictor variables were used together with the reference DEM X 90), soil fractions of clay (CLYPPT), the
data to train a Random Forest classifier (RF). RF is a non- median of the surface reflectance of the red band
This contribution has been peer-reviewed.
https://doi.org/10.5194/isprs-archives-XLIII-B3-2020-953-2020 | © Authors 2020. CC BY 4.0 License. 956The International Archives of the Photogrammetry, Remote Sensing and Spatial Information Sciences, Volume XLIII-B3-2020, 2020
XXIV ISPRS Congress (2020 edition)
and plinthosols, which could have favored the low clay con-
centration in these classes. More studies are needed to under-
stand these patterns, and also to analyze if there is a bias on the
samples distribution.
The five most important variables for the level-2 clas-
sification model were the Tandem-X elevation (TAN-
DEM X 90), the EVI value during the peak of the season
(LSP Metrics 2014 Mfit), the Cation Exchange Capacity of
soil (CECSOL), the EVI value during the start of the season
(LSP Metrics 2014 SoSVal) and the minimum EVI value dur-
ing the season (LSP Metrics 2014 BV). Figure 5 shows 3D-
scatterplot of three most important variables for the level-2 clas-
sification model based on the Gini importance index.
Figure 3. Confusion matrix for the classification model of
Level-1.
(STM 2014 red med), the EVI value during the start of
the season (LSP Metrics 2014 SoSVal) and the minimum EVI
value during the season (LSP Metrics 2014 BV). Figure 4
shows 3D-scatterplot of three most important variables for the
Level-1 classification model based on the Gini importance
index.
Figure 5. 3D-scatterplot of the three most important variables
for the level-2 classification model based on the Gini importance
index.
Grasslands classes as Campo Limpo, Campo Sujo and Campo
Rupestre are more rare than the others, so they mostly remain
in environmental protection areas, mainly plateaus, which have
higher elevations. Campo rupestre class usually occurs in re-
gions with elevation higher than 900 meters (Ribeiro et al.,
2008). Also, as we can observe, these grasslands are commonly
Figure 4. 3D-scatterplot of three of the most important variables above latosols, which are soils with higher content of clay and
for the level-1 classification model based on the Gini importance cation capacity exchange.
index.
The Palmeiral class is characterized by the massive presence of
palm trees, that usually occurs in lowlands, in the plateau of
We can observe higher SR values on the red band during the Maranhão-Piauı́ states (Floresta de Cocais and Costeiro ecore-
dry season for grasslands, showing an increasing gradient from gions). They are associated to ground surface water. The same
forests to grasslands. This was also observed by other authors for Parque de Cerrado class, that is mostly concentrated on the
that worked with spectral characterization of the Cerrado veget- Araguaia river floodplain (Bananal ecoregion) (Ribeiro et al.,
ation (Ferreira, Huete, 2004, Jacon et al., 2017). 2008). Furthermore, these ecoregions have the lowest eleva-
tions in the Cerrado (Sano et al., 2019).
We can also observe in Figure 4 that higher values of clay
content are present in the grassland class. We checked the Additionally, we validated the level-1 model using completely
samples with the 1:250,000 scale Brazilian official soil Map independent ground truth data in the Brasilia National Park
(IBGE, 2017). The majority of the grasslands samples are (Ferreira, 2003) with an overall accuracy of 0.71, and f1-class
within latosols, which are soils with a large clay content. On scores of 0.64, 0.76 and 0.73, for savanna, grasslands and forest.
the other hand, the other classes are most distributed on entisols This shows the robustness of a global model that enables to clas-
This contribution has been peer-reviewed.
https://doi.org/10.5194/isprs-archives-XLIII-B3-2020-953-2020 | © Authors 2020. CC BY 4.0 License. 957The International Archives of the Photogrammetry, Remote Sensing and Spatial Information Sciences, Volume XLIII-B3-2020, 2020
XXIV ISPRS Congress (2020 edition)
sify the remaining natural vegetation of the entire Cerrado with (Cerrado Ralo, Tı́pico and Denso) into one class. And even in
a high level of thematic detail. the field, it can be hard to differentiate Cerrado Ralo and Campo
Sujo. Ribeiro and Walter (2008) claim that several Cerrado cov-
erages do not have evident transition areas. So, despite the high
accuracies for the level-1 model, we assume that our approach
is still underestimating the savannas in that region.
For future investigations we aim to analyze the samples and try
to improve the number of ground truth points by conducting ad-
ditional fieldwork. The use of data from different sources can
lead into semantic problems on the class labeling. We also point
to the opportunity of using Sentinel-1 SAR data to improve the
separation between the sub classes of Cerrado Sensu Stricto,
once they are mostly associated to biomass density. Berger et
al. (2019) explored the potential of multi-temporal Sentinel-
1 data for herbaceous biomass mapping in savanna ecosystem
over Kruger National Park (KNP), South Africa. They achieved
good results indicating that Sentinel-1 time series can be suc-
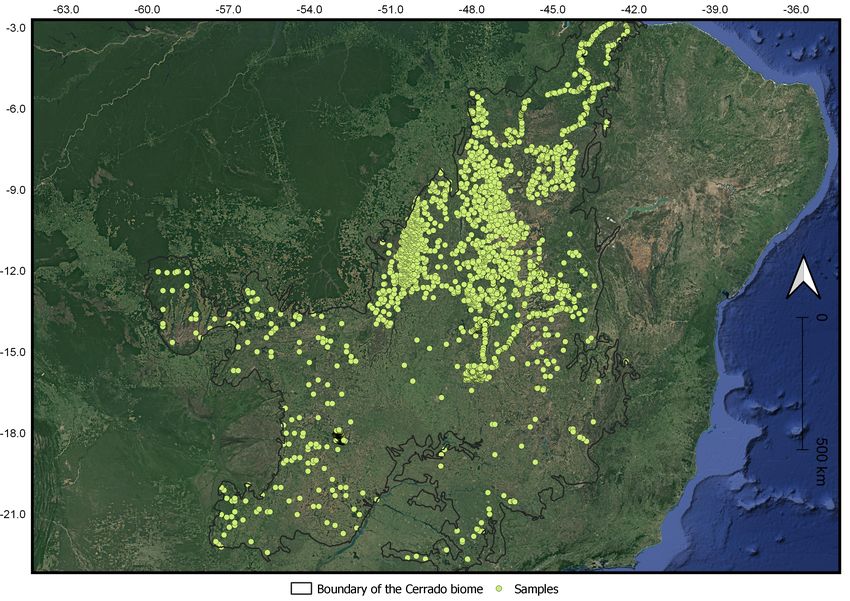
Figure 6. Map comparisons: a) Ferreira et al., 2003; b) cessfully employed for this type of mapping application.
Mapbiomas Collection 4.0; c) Our map; d) Google Satellite
(April 7, 2019). In case of Veredas, which achieved the lowest accuracies,
we believe that in particular for this class, the spatial con-
text is determinant. As we can see from Table 1, the Vereda
3.2 Discussion
physiognomy is characterized by the predominance of Buritis,
The use of ARD data derived from Landsat time series and a se- with more or less dense clusters of shrub-herbaceous species
lection of environmental data, together with a well distributed and surrounded by Campo Limpo, being generally flooded. We
set of reference data, enabled us to differentiate the main veget- can see this by analyzing the confusion matrix from Figure 3.
ation physiognomies of the Cerrado on two hierarchical levels. The most part of the misclassifications for Vereda class was ob-
served with Campo Limpo, Mata Riparia and Cerrado Sensu
Even though our classifications could be assessed with high Stricto. Perhaps this specific pattern can not be detected from
overall accuracies we observed confusion between savannas a Landsat-30m pixel. We point out to opportunities of using
and grasslands. Alencar et al. (2020) also showed some areas Deep Learning algorithms, specially the Convolutional Neural
where the native vegetation appeared as a mosaic of grasslands, Networks, that take into account the spatial context, to detect
savannas, and forests, indicating a limitation of Landsat data to this physiognomy.
discriminate these three vegetation types properly, which might
be due to the moderate spatial resolution (30 m). And as far as we know, it is the first time to report a (semi-)
automatic methodology that can achieve such good accuracies
The producers accuracies of our classes for level-1 are higher for level-2 classification, considering samples from the different
than reported by Alencar et al. (2020) (0.61, 0.54, 0.75 for regions of the whole Cerrado. The results are promising and we
savanna, grassland and forest, respectively). aim to improve the classification models presented here, and run
Our results suggest that combining various important environ- the methodology for all over the biome.
mental data with ARD is a promising approach for differentiat-
ing these vegetation physiognomies. This finding is in line with Numerous projects have been developed to produce Earth Ob-
other studies that showed the correlation between the different servation (EO) Data Cubes such as the Australian Geoscience
vegetation gradients of the Cerrado to the EVI time series can Data Cube (AGDC) (Dhu et al., 2017, Lewis et al., 2017)
be used as a proxy of the phenological variation (Schwieder et and the Framework for Operational Radiometric Correction for
al., 2018), suggested the importance of environmental variables Environmental monitoring (FORCE) (Frantz, 2019), that en-
for the delimitation of different types of vegetation (Sano et al., able to pre-process remote sensing data and organize and store
2019) and highlighted the relation between terrain proxies and them ARD for immediate analysis. The Brazil Data Cube pro-
the phenological information (Bendini et al., 2019b). ject4 , currently developed by INPE provides multidimensional
ARD data cubes from medium-resolution EO images, including
Visually we can see that the maps are consistent when compar- Landsat, CBERS and Sentinel satellites images.
ing to other maps. In case of Ferreira et al. (2003) , the visual
comparison needs to be done carefully, as the map is based
We believe that once these maps can be generated on a pixel-
on spatial segments. Additionally, it needs to be considered
level and using ARD combined with other environmental data
that fire events, which are frequent in the Cerrado, might have
that can be integrated on a EO Datacube structure, using cloud
changed the vegetation structure. These can be reasons for a
processing platforms, i.e. Google Earth Engine, Amazon Web
underestimating of the savannas in both our approach and Map-
Services or Azure, there is a possibility of deriving important
biomas approach.
proxies related to ecosystem structure and to biodiversity con-
By assessing the confusion matrix from Figure 3, confu- sequently, being potentially considered for developing a system
sion between the grassland physiognomies and Cerrado Sensu for monitoring biodiversity.
stricto becomes apparent. This can be associated to the fact that
we merged the different sub classes of Cerrado Sensu stricto 4 More information can be seen at http://brazildatacube.org/.
This contribution has been peer-reviewed.
https://doi.org/10.5194/isprs-archives-XLIII-B3-2020-953-2020 | © Authors 2020. CC BY 4.0 License. 958The International Archives of the Photogrammetry, Remote Sensing and Spatial Information Sciences, Volume XLIII-B3-2020, 2020
XXIV ISPRS Congress (2020 edition)
ACKNOWLEDGEMENTS Frantz, D., 2019. FORCE—Landsat + Sentinel-2 Analysis
Ready Data and Beyond. Remote Sensing, 11(9), 1124.
The project “Development of systems to prevent forest fires
and monitor vegetation cover in the Brazilian Cerrado” (World Girolamo-Neto et al., 2017. Assessment of texture features for
Bank Project #P143185) – Forest Investment Program (FIP). Brazilian savanna classification: A case study in Brası́lia na-
tional park. Braz. J. Cartogr, 69, 891–901.
REFERENCES Grecchi, R. C., Gwyn, Q. H. J., Bénié, G. B., Formaggio, A. R.,
2013. Assessing the spatio-temporal rates and patterns of land-
Abreu, E. S., Rosim, S., Renno, C. D., de Freitas Oliveira, J. R., use and land-cover changes in the Cerrados of southeastern
Jardim, A. C., de Oliveira Ortiz, J., Dutra, L. V., 2012. Ter- Mato Grosso, Brazil. International journal of remote sensing,
rahidro — a distributed hydrological system to delimit 34(15), 5369–5392.
large basins. 2012 IEEE International Geoscience and Remote
Sensing Symposium, IEEE. Griffiths, P., van der Linden, S., Kuemmerle, T., Hostert, P.,
Alencar, A., Z Shimbo, J., Lenti, F., Balzani Marques, C., 2013. A pixel-based Landsat compositing algorithm for large
Zimbres, B., Rosa, M., Arruda, V., Castro, I., Fernandes area land cover mapping. IEEE Journal of Selected Topics in
Márcico Ribeiro, J. P., Varela, V. et al., 2020. Mapping Three Applied Earth Observations and Remote Sensing, 6(5), 2088–
Decades of Changes in the Brazilian Savanna Native Vegeta- 2101.
tion Using Landsat Data Processed in the Google Earth Engine
Gruber, A., Wessel, B., Huber, M., Roth, A., 2012. Operational
Platform. Remote Sensing, 12(6), 924.
TanDEM-X DEM calibration and first validation results. ISPRS
Bendini et al., 2019a. Detailed agricultural land classification in Journal of Photogrammetry and Remote Sensing, 73, 39–49.
the Brazilian cerrado based on phenological information from https://doi.org/10.1016/j.isprsjprs.2012.06.002.
dense satellite image time series. IJAEOG, 82, 101872.
Hengl, T., de Jesus, J. M., Heuvelink, G. B. M., Gonza-
Bendini, H. N. et al., 2019b. Assessing Satellite-Derived lez, M. R., Kilibarda, M., Blagotić, A., Shangguan, W.,
Phenological Metrics and Terrain Data As a Proxy for Wright, M. N., Geng, X., Bauer-Marschallinger, B., Guevara,
Vegetation Dynamics Along the Brazilian Savanna Cor- M. A., Vargas, R., MacMillan, R. A., Batjes, N. H., Leen-
ridor. PECORA - International Symposium on Remote aars, J. G. B., Ribeiro, E., Wheeler, I., Mantel, S., Kem-
Sensing of Environment, 38. http://pecora.asprs.org/wp- pen, B., 2017. SoilGrids250m: Global gridded soil information
content/uploads/2019/05/Preliminary-Program-52919.pdf. based on machine learning. PLOS ONE, 12(2), e0169748. ht-
tps://doi.org/10.1371/journal.pone.0169748.
Berger, C., Werner, S., Wigley-Coetsee, C., Smit, I., Schmul-
lius, C., 2019. Multi-temporal sentinel-1 data for wall-to-wall IBGE, 2012. Manual técnico da vegetação brasileira.
herbaceous biomass mapping in kruger national park, south
africa — first results. IGARSS 2019 - 2019 IEEE International IBGE, 2017. Pedologia.
Geoscience and Remote Sensing Symposium, IEEE.
INPE, 2019a. PRODES Annual increment of deforested areas
Breiman, L., 2001. Random forests. Machine learning, 45(1),
in the Brazilian Cerrado. National Institute for Space Research.
5–32.
Câmara, G. et al., n.d. Land cover change maps for mato grosso INPE, 2019b. Projeto terraclass cerrado-
state in brazil: 2001-2017 (version 3). PANGAEA - Data Pub- mapeamento do uso e cobertura vegetal do cerrado.
lisher for Earth Environmental Science. http://www.dpi.INPE.br/tccerrado/.
de Morisson Valeriano, M., de Fátima Rossetti, D., Jacon, A. D., Galvão, L. S., dos Santos, J. R., Sano,
2012. Topodata: Brazilian full coverage refinement of E. E., 2017. Seasonal characterization and discrimin-
SRTM data. Applied Geography, 32(2), 300–309. ht- ation of savannah physiognomies in Brazil using hy-
tps://doi.org/10.1016/j.apgeog.2011.05.004. perspectral metrics from Hyperion/EO-1. International
Journal of Remote Sensing, 38(15), 4494–4516. ht-
Dhu et al., 2017. Digital Earth Australia – Unlocking New tps://doi.org/10.1080/01431161.2017.1320443.
Value from Earth Observation Data. Big Earth Data, 1(1-2),
64–74. Jönsson, P., Eklundh, L., 2004. TIMESAT—a program for
Ferreira et al., 2007. Spectral linear mixture modelling ap- analyzing time-series of satellite sensor data. Computers &
proaches for land cover mapping of tropical savanna areas in geosciences, 30(8), 833–845.
Brazil. International Journal of Remote Sensing, 28(2), 413–
Lewis et al., 2017. The Australian Geoscience Data Cube —
429.
Foundations and Lessons Learned. RSE, 202, 276–292.
Ferreira, L. G., Huete, A. R., 2004. Assessing the
seasonal dynamics of the Brazilian Cerrado vegetation Liaw, A., Wiener, M. et al., 2002. Classification and regression
through the use of spectral vegetation indices. Interna- by randomForest. R news, 2(3), 18–22.
tional Journal of Remote Sensing, 25(10), 1837–1860. ht-
tps://doi.org/10.1080/0143116031000101530. MMA, M. o. E., 2015. Biomas.
Ferreira, M. E., 2003. Análise do modelo linear de mistura es- Neves et al., 2019. Hierarchical classification of brazilian sa-
pectral na discriminação de fitofisionomias do parque nacional vanna physiognomies using very high spatial resolution image,
de brası́lia (bioma cerrado). superpixel and geobia. IGARSS 2019, IEEE, 3716–3719.
This contribution has been peer-reviewed.
https://doi.org/10.5194/isprs-archives-XLIII-B3-2020-953-2020 | © Authors 2020. CC BY 4.0 License. 959The International Archives of the Photogrammetry, Remote Sensing and Spatial Information Sciences, Volume XLIII-B3-2020, 2020
XXIV ISPRS Congress (2020 edition)
Noojipady, P., Morton, C. D., Macedo, N. M., Victoria, C. D.,
Huang, C., Gibbs, K. H., Bolfe, L. E., 2017. Forest car-
bon emissions from cropland expansion in the Brazilian Cer-
rado biome. Environmental Research Letters, 12(2), 025004.
https://doi.org/10.1088/1748-9326/aa5986.
Potapov et al., 2020. Landsat Analysis Ready Data for Global
Land Cover and Land Cover Change Mapping. Remote Sensing,
12(3), 426.
Ratter, J. A., Ribeiro, J. F., Bridgewater, S., 1997. The Brazilian
cerrado vegetation and threats to its biodiversity. Annals of bot-
any, 80(3), 223–230.
Rennó, C. D., Nobre, A. D., Cuartas, L. A., Soares,
J. V., Hodnett, M. G., Tomasella, J., Waterloo, M. J.,
2008. HAND, a new terrain descriptor using SRTM-DEM:
Mapping terra-firme rainforest environments in Amazonia.
Remote Sensing of Environment, 112(9), 3469–3481. ht-
tps://doi.org/10.1016/j.rse.2008.03.018.
Ribeiro et al., 2008. As principais fitofisionomias do bioma Cer-
rado. Cerrado: ecologia e flora, 1, 151–212.
Rocha, G. F., Ferreira, L. G., Ferreira, N. C., Ferreira, M. E.,
2011. Detecção de desmatamentos no bioma Cerrado entre
2002 e 2009: padrões, tendências e impactos. Revista Brasileira
de Cartografia, 63(3).
Rufin, P., Müller, H., Pflugmacher, D., Hostert, P., 2015.
Land use intensity trajectories on Amazonian pastures de-
rived from Landsat time series. International Journal of Ap-
plied Earth Observation and Geoinformation, 41, 1–10. ht-
tps://doi.org/10.1016/j.jag.2015.04.010.
Sano, E. E., Rodrigues, A. A., Martins, E. S., Bettiol,
G. M., Bustamante, M. M., Bezerra, A. S., Couto, A. F.,
Vasconcelos, V., Schüler, J., Bolfe, E. L., 2019. Cerrado
ecoregions: A spatial framework to assess and prioritize
Brazilian savanna environmental diversity for conservation.
Journal of Environmental Management, 232, 818–828. ht-
tps://doi.org/10.1016/j.jenvman.2018.11.108.
Sano, E. E., Rosa, R., Brito, J. L., Ferreira, L. G., 2010. Land
cover mapping of the tropical savanna region in Brazil. Envir-
onmental monitoring and assessment, 166(1-4), 113–124.
Schwieder et al., 2016. Mapping Brazilian savanna vegetation
gradients with Landsat time series. IJAEOG, 52, 361–370.
Schwieder, M., Leitão, P., Pinto, J., Teixeira, A., Pedroni, F.,
Sanchez, M., Bustamante, M., Hostert, P., 2018. Landsat phen-
ological metrics and their relation to aboveground carbon in the
Brazilian Savanna. Carbon balance and management, 13(1), 7.
Strassburg, B. B. N., Brooks, T., Feltran-Barbieri, R., Iribar-
rem, A., Crouzeilles, R., Loyola, R., Latawiec, A. E., Filho,
F. J. B. O., de M. Scaramuzza, C. A., Scarano, F. R.,
Soares-Filho, B., Balmford, A., 2017. Moment of truth
for the Cerrado hotspot. Nature Ecology & Evolution, 1(4).
https://doi.org/10.1038/s41559-017-0099.
Team, R. C. D., 2019. R: A language and environment for stat-
istical computing (version 3.5. 2, r foundation for statistical
computing, vienna, austria, 2018).
Tuchschneider, D., 2013. Brazil - development of systems to
prevent forest fires and monitor vegetation project (english).
Technical report, World Bank Group, Washington, D.C.
This contribution has been peer-reviewed.
https://doi.org/10.5194/isprs-archives-XLIII-B3-2020-953-2020 | © Authors 2020. CC BY 4.0 License. 960You can also read