"Argento Deaurato" or "Argento Biancheggiato"? A Rare and Interesting Case of Silver Background in Italian Painting of the XIII Century
←
→
Page content transcription
If your browser does not render page correctly, please read the page content below
applied
           sciences
Article
“Argento Deaurato” or “Argento Biancheggiato”?
A Rare and Interesting Case of Silver Background in
Italian Painting of the XIII Century
Iacopo Osticioli 1, * , Daniele Ciofini 1, * , Martina Banchelli 1 , Laura Capozzoli 2 ,
Loredana Gallo 3 , Alessandro Lavacchi 2 , Barbara Salvadori 4 , Paolo Matteini 1 and
Salvatore Siano 1
 1    Institute of Applied Physics “Nello Carrara” (IFAC) - National Research Council (CNR),
      50019 Sesto Fiorentino, Florence, Italy
 2    Institute of Chemistry of Organometallic Compounds (ICCOM) - National Research Council (CNR),
      50019 Sesto Fiorentino, Florence, Italy
 3    Gallo Restauro, University of Florence, 50121 Florence, Italy
 4    Institute of Heritage Science (ISPC) - National Research Council (CNR), 50019 Sesto Fiorentino, Florence, Italy
 *    Correspondence: i.osticioli@ifac.cnr.it (I.O.); d.ciofini@ifac.cnr.it (D.C.)

 Received: 3 March 2020; Accepted: 27 March 2020; Published: 1 April 2020

 Abstract: The painting depicting the “Virgin with the Child and two angels” by a Tuscan anonymous
 artist of the XIII century, has raised great interest regarding the execution technique including the use
 of silver, applied on wood as a background. An in-depth investigation was carried out especially
 concerning the burnishing process of the silver leaves as well as a detailed inspection of the nature
 of the organic compounds over the metal leaf and the degradation products of the silver layer.
 To this aim, a multianalytical approach was used including UV–VIS microscopy along with an
 Ultra-High-Resolution Scanning Electron Microscopy (UHR-SEM), as well as Fourier Transform
 Infrared (FTIR), fluorescence and micro-Raman spectroscopies. As a result, the presence of an oil-resin
 varnish layer in the uppermost layer and a wax-protein layer between the varnish and the metal layer
 as well as the evidence that the silver leaf was applied with high accuracy directly to the preparation
 layer, were clearly demonstrated. Furthermore, degradation products of the silver leaf were identified
 as sulphides, chlorides, and oxides. The holistic approach herein adopted enabled a step forward in
 the knowledge of the 13th century silver leaf gilding technique, adding value to the originality of
 this artwork. In this respect, the scientific evidence led to the assumption that likely this painting
 originally showed a silver-colored background (“argento biancheggiato”) as compared to the initial
 theory of a case of “argento deaurato”.

 Keywords: multianalytical; SEM-EDS; FTIR; Raman spectroscopy; UV-induced VIS fluorescence;
 optical microscopy; meccatura; cross-section; mapping; argento dorato

1. Introduction
     The painting depicting the “Virgin with the Child and two angels” by a Tuscan anonymous artist
of the XIII century (Figure 1), has shown elements of great interest regarding the execution technique,
such as the presence of a sort of “negative” painting technique trough the wooden support, as well
as the use of silver applied on wood as a background. Both these peculiarities legitimized a more
in-depth examination of this painting.
     The wood-digging technique, often recurring in the Byzantine icons, was actually very rare in
Tuscany. The frame of this painting is, in fact, obtained from the panel through a complex and long
carpentry work, made even more difficult by the choice of the conifer as wood fiber: the 3 cm thickness

Appl. Sci. 2020, 10, 2404; doi:10.3390/app10072404                                     www.mdpi.com/journal/applsci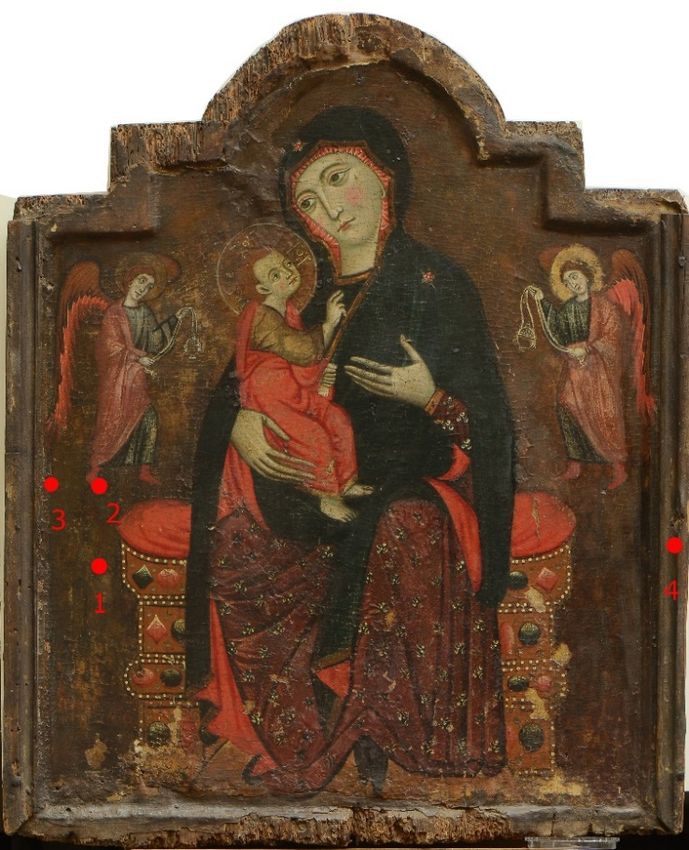
role, and, the identification of the degradation products of silver. For this reason, a multianalytical
approach was mandatory including imaging, spectroscopy, and microscopy techniques, which were
applied on cross-sections of some samples taken from the painting where the silver background was
present. In particular, UV-Induced VIS Fluorescence (UVIVF) microspectroscopy and imaging along
with an Ultra-High-Resolution Scanning Electron Microscopy (UHR-SEM) were employed to study
Appl. Sci. 2020, 10, 2404 2 of 15
the stratigraphy of the samples in order to gather information on the execution technique and in
particular on the burnishing process of the silver leaves. Besides, Fourier Transform Infrared (FTIR)
and
of thefluorescence
board has been spectroscopies
reduced towere employed
obtain in order
the pictorial to identify
plane. the organic
The frame consistsmaterials
of a 3 cmused as a
flat and
gold-coloring
wide outer frame. agent,
Manybrightener and
examples ofprotective
“negative of the silver
painting background,
technique” were as wellinasthe
found thearea
binder,
nearused
Pisa
to make the silver leaves to adhere to the preparation layer. Finally, micro-Raman spectroscopy
from 1100 to the end of 1200. However, rare paintings and dossals were found also in Florence until was
used to study the degradation mechanism of the silver layer and characterize its corrosion
the early 1300s due to the works of Pacino di Buonaguida (St. Nicholas, St. John The Evangelist, products.
St. Proculus) and Giotto (Polyptych of Badia) as well as in Siena with the works of the Master of
2. Materials
Tressa and Methods
(the Redeemer’s dossal and the Madonna “with big eyes”). Originally the back of this painting
was protected
Four samples were“ammanitura”
by a thick taken from the (a layer of gypsum
painting in those andareas
glue where
cast on silver
the wooden surface as
was applied
abackground
substrate for gilding)
in order [1]. Unfortunately,
to study the stratigraphy over
andthe centuries,
gather this layer
information gottechnical
on the ruined due to adverse
execution and
environmental factors (high
the chemical composition of humidity
the artisticfirstly) and Figure
materials. now it 1isshows
almostagone. The
view of thepainting was made
entire painting by
along
using the egg-tempera technique and, later, was veiled with oil mixed with bright lacquers.
with the sampling points. Sampling was carried out on original layers avoiding areas affected by The palette
is composed
most of a few pigments
recent interventions dominated by red and blue.
of restoration.
Figure 1.
Figure 1. Painting
Painting depicting
depicting the
the “Virgin
“Virgin with
with the Child and
the Child and two
two angels”
angels” by
by aa Tuscan
Tuscan anonymous
anonymous
artist. Dimensions
artist. Dimensions ofof the
the painting:
painting: 84 cm ×
84 cm × 68
68 cm.
cm. Red
Red spots
spots indicate
indicate the areas where
the areas where sampling
sampling was
was
carried out.
carried out.
The fragments
Silver leaf was were castininthe
applied polyester resin as
past, either (Mecaprex
“argento2S from Presi,
deaurato” Grenoble,
(glazed silver)France), dried
as Cimabue
and finely polished
(1240–1302) referred for
for cross-sections preparation.
the first time [2,3], The stratigraphies
or as “argento were
biancheggiato” thensilver)
(white observed withdia Bicci
as Neri UV–
VIS Nikon
referred in Eclipse
his “Le E400 epi-fluorescence
Ricordanze”[4], or as microscope (Tokyo,
“oro di metà” Japan) provided
(part-gold). The first, with
also 5×, 10×, as
known 20×, and
silver
“dorato” or “meccato” was glazed on the surface with terpenic resins, often Sandracca, added with
dyes such as Arzica, Turmeric, Campeggio (Haematoxylum Campechianum), Saffron, Dragon’s Blood,
Gommagutta, Aloe, and a plasticizer as formerly beeswax and most recently replaced by Carnauba [5].
In this way, silver leaf was conferred the appearance of the most precious gold leaf. Conversely,
silver could be treated with a transparent film in order to protect the foil from degradation as well
as to highlight the typical shining-whitish hue of silver (argento biancheggiato). Unfortunately, only
little information is available regarding this technique leaving many issues open. The “oro di metà”
known in Germany as “Zwishgold” consisted of the use of a silver leaf underneath a thinner gold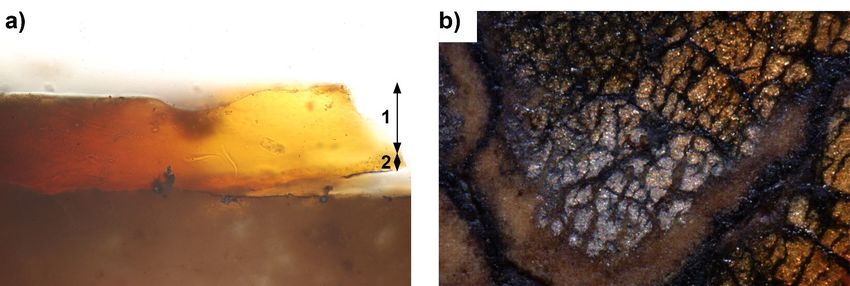
Appl. Sci. 2020, 10, 2404                                                                          3 of 15

silver [6–8]. The adhesion of the two metal leaves occurred mechanically or alternatively through the
use of protein-based adhesives.
      The use of silver in medieval Europe is often present in the background of paintings and crosses,
as well as the more expensive gold leaves, which, however, until the first half of 1200, were constituted
of low-quality gold called the “pagliola” (20 or 21 12 -carat gold). In 1252 in Florence and Genoa and in
1284 in Venice, the minting of 23-carat gold coins led to significant changes to the economic as well as
to the artistic world [9]. From this date on, the gold leaves obtained from the coins guaranteed the
quality of the precious metal, because it was controlled by the Mint and regulated by rigid rules by the
corporations. These leaves were applied by artists over the centuries by using increasingly refined
technics such as the use of an orange-colored preparation substrate (the Armenian bole) allowing deep
burnishing of the gilded background [10]. The circulation of precious metals was therefore closely
linked to economic, political, and social factors [11]: from the 8th to the 13th century, the amount
of gold in circulation was drastically reduced in favor of silver. At the end of the 8th century, the
monometallic silver was mainly used because it best suited the economic needs of the market of that
period. The renewal of the money system began between the 11th and 12th centuries when a silver
coin called the “Grosso” was minted for the first time in Venice and soon spread throughout Italy
and Europe [12]. This coin was highly sought after so much so that the value of gold with respect to
silver was lowered. Thus, it emerges the close interrelationship between the use of certain metals in
paintings and in the goldsmith and silversmith. This also explains in that period the widespread use
of silver plates in monumental works as for instance, in the “Madonna di Casale” by the Master of
Greve at the Uffizi Museum in Florence as well as in the painted cross by Berlinghiero Volterrano at the
Museum of St. Mattew in Pisa.
      According to information available to us regarding the thirteenth-century technique, the silver as
a background was applied in the form of metallic leaves made of irregular squares of 8 cm. The leaves
were glued directly on the preparation substrate, smoothed with great accuracy and treated with glue
to promote the adhesion of silver leaves. Despite the lack of the bole, some scholars maintain that the
metal leaves could be burnished anyway. The subsequent application of a very thick layer of yellowish
oil-resin-based compounds appeared to be necessary to make the surface bright as gold.
      In this respect, this work aims at providing more clarity on some open issues regarding the
execution technique as well as the composition and conservation of the materials used by the artist.
For example, more precise information should be provided regarding the burnishing process of the
silver leaves, the identification of the organic compounds cast over the silver layer as well as their
role, and, the identification of the degradation products of silver. For this reason, a multianalytical
approach was mandatory including imaging, spectroscopy, and microscopy techniques, which were
applied on cross-sections of some samples taken from the painting where the silver background was
present. In particular, UV-Induced VIS Fluorescence (UVIVF) microspectroscopy and imaging along
with an Ultra-High-Resolution Scanning Electron Microscopy (UHR-SEM) were employed to study
the stratigraphy of the samples in order to gather information on the execution technique and in
particular on the burnishing process of the silver leaves. Besides, Fourier Transform Infrared (FTIR)
and fluorescence spectroscopies were employed in order to identify the organic materials used as a
gold-coloring agent, brightener and protective of the silver background, as well as the binder, used to
make the silver leaves to adhere to the preparation layer. Finally, micro-Raman spectroscopy was used
to study the degradation mechanism of the silver layer and characterize its corrosion products.

2. Materials and Methods
     Four samples were taken from the painting in those areas where silver was applied as background
in order to study the stratigraphy and gather information on the technical execution and the chemical
composition of the artistic materials. Figure 1 shows a view of the entire painting along with the
sampling points. Sampling was carried out on original layers avoiding areas affected by most recent
interventions of restoration.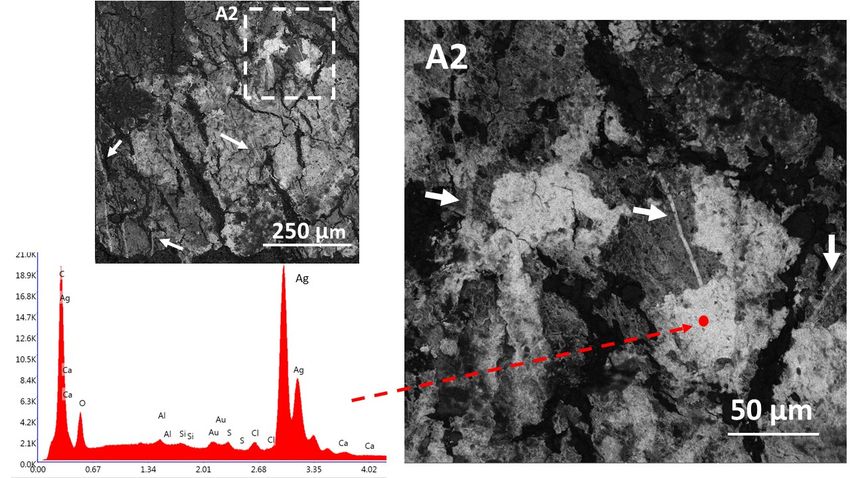
Appl. Sci. 2020, 10, 2404                                                                          4 of 15

     The fragments were cast in polyester resin (Mecaprex 2S from Presi, Grenoble, France), dried and
finely polished for cross-sections preparation. The stratigraphies were then observed with a UV–VIS
Nikon Eclipse E400 epi-fluorescence microscope (Tokyo, Japan) provided with 5×, 10×, 20×, and 100×
objectives and with a Nikon D80 DSLR digital CCD camera. Fluorescence was excited with a mercury
lamp and was observed using a V2A Nikon filter cube (Exc.:380–420 nm, DM:420 nm, Bar.:450 nm).
     Scanning Electron Microscopy-Energy Dispersive X-Ray Spectrometry (SEM-EDS) measurements
were carried out by using a UHR-SEM Gaia 3 FIB/SEM by Tescan (Brno, Czech Republic) placed at the
Center of Electronic Microscopies "Laura Bonzi" (Ce.M.E-CNR).
     UV-Induced VIS Fluorescence (UVIVF) microspectroscopy was performed with a high-sensitivity
Avaspec (Avantes, Apeldoorn, The Netherlands) CCD spectrophotometer (200–1100 nm, grating
300 lines/mm) coupled through an optical fiber to a Nikon Eclipse 400 epi-fluorescence microscope.
An HBO mercury short-arc lamp (emission above 295 nm) was used as an excitation source, whereas
a CFI PlanFluor 100×/1.3 OIL objective lens and the V2A Nikon filter cube to collect fluorescence
emission from the varnish layers of the prepared cross-sections.
     Fourier Transformed-Infrared (FT-IR) spectra of paint samples in embedded and non-embedded
conditions were collected using Diffuse Reflectance Infrared Fourier Transform (DRIFT) and
Microattenuated Total Reflection Fourier Transformed-Infrared (µ-ATR FT-IR) techniques. An Agilent
Cary 630 FTIR portable spectrometer (Agilent Technologies, Santa Clara, CA, USA) fitted with a diffuse
reflectance accessory for non-contact measures was exploited for Diffuse Reflectance Infrared Fourier
Transform (DRIFT) measurements. Pseudoabsorbance spectra (log(1/R); R = reflectance) were acquired
in the 4000–650 cm−1 range, at 8 cm−1 resolution and by averaging 64 scans per sample accumulated.
The beam spot size was estimated to be approximately 1 mm. No correction algorithms were applied
to DRIFT spectra.
     Microattenuated Total Reflection Fourier Transformed-Infrared (µ-ATR FT-IR) spectra were instead
collected using an Agilent Cary 660 FT-IR spectrometer coupled with the Cary 620 Microscope and
equipped with a MCT detector. The spectra were acquired in ATR mode with Germanium crystal,
collecting 64 scans, with a resolution of 4 cm−1 in the 4000–400 cm−1 range. Spectra were processed
using Agilent Resolutions Pro software (Agilent Technologies, Santa Clara, CA, USA ).
     Raman measurements were performed under an XPlora Horiba micro-Raman instrumentation
(Chelmsford, Essex, UK) using a 785 nm laser wavelength, a 100× objective, and a diffraction grating
of 1200 g/mm. Raman spectra were collected using an integration time of 10 s at 4 mW laser power and
were averaged over N = 15 mapping points.

3. Results
      The cross-sections analyzed under the UV-light of the microscope show the presence of four distinct
layers as indicated in Figure 2d: (1) an uppermost white-opalescent layer, 40 µm thick approximately;
(2) a thinner (circa 15 µm) fluorescent orangish layer; (3) a very thin (submicron) black layer, likely
ascribable to the silver leave; and (4) a very thick whitish preparation layer showing (Figure 2a,b) a
double row of holes left by the canvas, which was applied throughout the panel and on the frame by
means of a mixture of chalk and glue in order to cushion the movements of the wood. This procedure
is in line with the preparatory technique of that time justifying also the considerable thickness of the
ground. Analysis carried out on the canvas led to rough linen with a coarse “plain weave” texture
(weft/warp ratio 1: 1).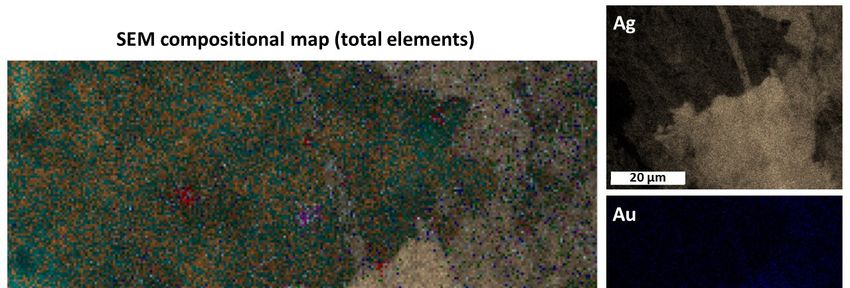
Appl. Sci. 2020, 10, 2404 5 of 15
Figure
Figure 2. UV
2. UV fluorescence
fluorescence microscope
microscope images
images of of aa painting
painting cross-section
cross-section at
at different
Figure 2. UV fluorescence microscope images of a painting cross-section at different magnification
different magnification
magnification
objectives:
objectives: (a) 10×,
(a)10×, (b)
10×,(b)(b) 20×,
20×, and
and (c,d)
(c,d) 100×.
100×. Four different layers were observed: (1) a white-opalescent
objectives: (a) 20×, and (c,d) 100×. FourFour different
different layerslayers were observed:
were observed: (1) a white-opalescent
(1) a white-opalescent
layer
layer (circa 40
(circa40 µm);(2)(2)
µm);
40µm); (2) an orangish layer (( circa 15
15 µm); (3)
(3) aa sub-micron black layer; and (4) a very
layer (circa anan orangish
orangish layer
layer ( circa circa
15 µm); µm); sub-micron
(3) a sub-micron blackand
black layer; layer;
(4) aand
very(4) a very
thick whitish preparation
thick whitish preparation layer. layer.
thick whitish preparation layer.
Layers (1)and
Layers (1)
and (2) weredistinctly
distinctly observed only with the UV-light. Thelayers
same layers observed
Layers (1) and(2)(2)were
were distinctly observed
observedonlyonly
with with
the UV-light. The same
the UV-light. The sameobserved
layers observed
under VIS-light Optical Microscopy (OM) appeared as a unique layer of yellow color (see Figure 3a).
under VIS-light Optical Microscopy (OM) appeared as a unique layer of yellow color (see3a).
under VIS-light Optical Microscopy (OM) appeared as a unique layer of yellow color (see Figure Figure 3a).
This
This suggests thatits
suggests that its function was likely
justjust to make
silversilver brighter and probably like
as gold,
clearlyas clearly
This suggests that itsfunction was
function likely
was likely to make
just to make brighter
silver and probably
brighter like gold,
and probably like gold, as clearly
displayed in Figure
displayed in Figure3b.3b.Noteworthy
Noteworthy is the
is the “wavy”
“wavy” formform
of theoforangish
the orangish layer2),
layer (layer (layer
which2),iswhich
likely is likely
displayed in Figure 3b. Noteworthy is the “wavy” form of the orangish layer (layer 2), which is likely
ascribable to the
ascribable to thegrooves
groovesleftleft
byby bristles
bristles of brush
of brush usedused to apply
to apply layer layer
1 (see 1Figure
(see Figure
2c,d). 2c,d).
ascribable to the grooves left by bristles of brush used to apply layer 1 (see Figure 2c,d).
Figure 3.
Figure 3. VIS-light
VIS-lightimage
imageofofaa painting
paintingsample
sampleasasseen
seenunder
underOptical
OpticalMicroscopy
Microscopy(OM):
(OM):(a)(a)
cross-
cross-section
section of the gilded surface; (b) surface with the varnished (yellow) and unvarnished
of the gilded surface; (b) surface with the varnished (yellow) and unvarnished (gray) silver (gray) silver
(Ag) layer.
Figure
(Ag) layer.3. VIS-light image of a painting sample as seen under Optical Microscopy (OM): (a) cross-
section
A better of knowledge
the gilded surface;
of the (b) surface composition
chemical with the varnished
of the(yellow) andlayers
different unvarnished
might (gray)
providesilver
crucial
A better
(Ag) layer.knowledge of the chemical composition of the different layers might provide crucial
information to shed light on these issues. The analysis of cross-sections by UVIVF micro-spectroscopy
information to shed light on these issues. The analysis of cross-sections by UVIVF micro-spectroscopy
revealed to be very supportive for the discrimination of the two kinds of varnish layers found on top
revealed to be very
A better supportive
knowledge for the
of the discrimination
chemical of the two
composition kinds
of the of varnish
different layers
layers foundprovide
might on top crucial
of
ofthe
the silvered surface.Normalized
silvered surface. Normalized UVIVF
UVIVF spectra
spectra collected
collected on theon the organic
organic layers
layers over theover the
silver silver leaf
leaf
information
are to shed light on these issues. The analysis of cross-sections by UVIVF micro-spectroscopy
are shown
shown in in Figure
Figure4.4.
revealed to be very supportive for the discrimination of the two kinds of varnish layers found on top
of the silvered surface. Normalized UVIVF spectra collected on the organic layers over the silver leaf
are shown in Figure 4.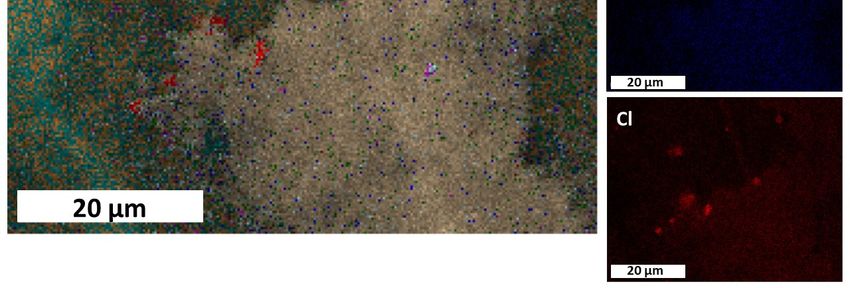
Appl. Sci. 2020, 10, 2404                                                                                              6 of 15

      Figure 4.4 Normalized
                  NormalizedUV-Induced
                                UV-InducedVIS Fluorescence  (UVIVF)
                                               VIS Fluorescence        spectra showing
                                                                     (UVIVF)     spectra the differentthe
                                                                                          showing       fluorescence
                                                                                                           different
      emission of the
      fluorescence    organicoflayers
                   emission           applied
                                 the organic   on top
                                             layers   of the on
                                                    applied  silver
                                                                 topleaf.
                                                                      of the silver leaf.

      Fluorescence maxima
      Fluorescence     maxima (λ    (λmax
                                      max) )were
                                             were found
                                                     found at at about
                                                                 about 500
                                                                         500 (136
                                                                              (136 nm,
                                                                                   nm, measured
                                                                                         measured at  at Full
                                                                                                          Full Width
                                                                                                                Width Half
                                                                                                                         Half
Maximum      (FWHM)      of the band)     and   580  nm   (230 nm   FWHM)    for the
Maximum (FWHM) of the band) and 580 nm (230 nm FWHM) for the varnish layer 1 and 2,  varnish   layer 1 and   2, respectively,
according to according
respectively,   the schemetoshownthe schemein Figure
                                                  shown 2d.inFluorescence    intensity was
                                                              Figure 2d. Fluorescence        strongly
                                                                                          intensity   waslower    for layer
                                                                                                            strongly   lower2
applied   over  the  silver  leaf  in comparison        to the thicker  varnish  on  top (i.e., layer 1),
for layer 2 applied over the silver leaf in comparison to the thicker varnish on top (i.e., layer 1), thus thus  suggesting
that layer 2that
suggesting     waslayer
                      more2 aged     and ancient.
                              was more       aged and   Asancient.
                                                            witnessed    by the narrower
                                                                     As witnessed   by the FWHM,
                                                                                             narrowervarnish
                                                                                                          FWHM,layer       1 is
                                                                                                                     varnish
instead   more   representative      of a less  complex     and   aged  composition    [13]. Unlike
layer 1 is instead more representative of a less complex and aged composition [13]. Unlike varnish    varnish    layer  2, the
blue-shifted   fluorescence     of  the  uppermost       varnish   layer 1 could  match   more   plausibly
layer 2, the blue-shifted fluorescence of the uppermost varnish layer 1 could match more plausibly           with   a yellow
oil medium
with   a yellowglaze,  but it is glaze,
                  oil medium      rather butdifficult  to obtain
                                                it is rather       moreto
                                                              difficult  detailed
                                                                           obtain information.
                                                                                   more detailed information.
      From qualitative comparisons of DRIFT and µ-ATR FT-IR spectra
      From    qualitative    comparisons         of  DRIFT    and    µ-ATR   FT-IR   spectra additional
                                                                                                additional and
                                                                                                             and valuable
                                                                                                                    valuable
information    on   the artistic  technique      were    pointed   out. In detail, DRIFT    analysis
information on the artistic technique were pointed out. In detail, DRIFT analysis of paint fragments  of  paint   fragments
before being
before   being embedded
                embedded is      shown in
                              is shown      in Figure
                                               Figure 5A.5A.
      Starting from the top (Figure 5A, spectrum a), the broad C=O stretching band in the 1745–1730 cm−1
region with a shoulder at 1778 cm−1 and the C-H bending at 1465 cm−1 were indicative of an oil-based
glaze. Signals near 2900 cm−1 (C-H stretching band) were scarcely informative, whereas the clear
shoulder-peak at 1676 cm−1 (C=O stretching band) could be from amide I in proteins. The evidence
of the latter was found also in other fragments extracted from the same sampling point (Figure 5A,
spectrum b). As shown, C-H stretching bands (2954, 2920, and 2852 cm−1 ), a shoulder of C=O at
1725 cm−1 and absorptions in the amide I and II range at 1676, 1635, and 1550 cm−1 are consistent
with a protein-based binding medium [14]. Noteworthy are the slightly perceivable signals at 3320
and 3113 cm−1 and the one at 1676 cm−1 , which could be assigned firmly to guanine but even to
proteins [15]. More detailed information of the outermost layer may be retrieved from the µ-ATR
FT-IR stratigraphic analysis of the painting cross-section shown in Figure 2 (Figure 5B spectrum a).
It is possible to confirm that the topcoat (i.e., layer 1) is likely constituted of oil, as suggested by the
intense C=O stretching band at 1730 cm−1 and by the C-H stretching (2926–2934 and 2857 cm−1 ) and
bending (1455–1460cm−1 ) vibrations. Moreover, the very weak out-of-plane CH bending vibration
at 720 cm−1 is diagnostic for the presence of a lipidic component. The weak band at 1377–1382 cm−1
may also suggest the use of a mixture with a natural resin [16]. However, a direct identification is not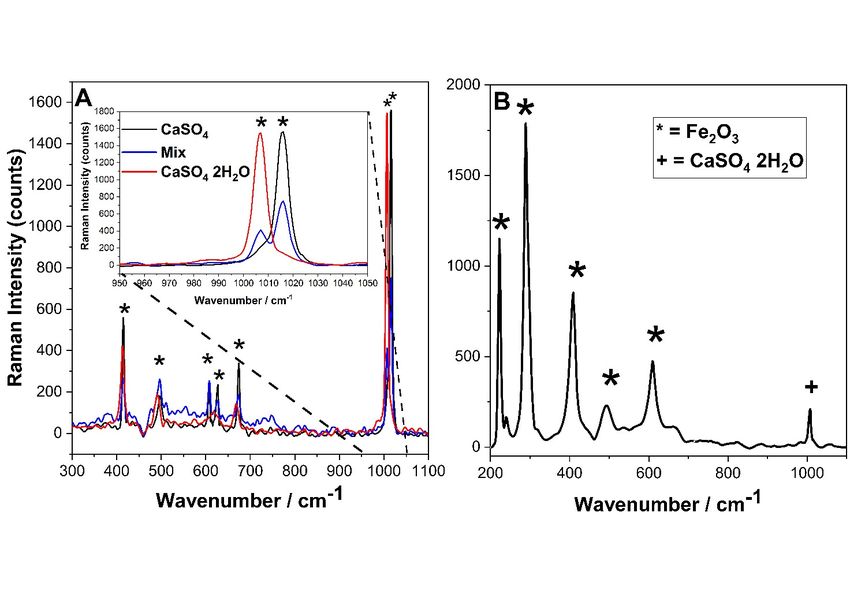
Appl. Sci. 2020, 10, 2404 7 of 15
straightforward, as from FTIR spectra of preheated and aged oil-resin varnishes individual signatures
of each component are no longer recognizable [17,18].
Figure5.5 Qualitative
Figure comparisonofof
Qualitative comparison IRIR spectra
spectra of different
of different sampled
sampled paintpaint fragments
fragments using using
DiffuseDiffuse
Reflectance
Reflectance Infrared Fourier Transform (DRIFT; A) and Microattenuated Total Reflection FourierFourier
Infrared Fourier Transform (DRIFT; A) and Microattenuated Total Reflection
Transformed-Infrared
Transformed-Infrared (µ-ATR FT-IR;B)B)techniques.
(µ-ATR FT-IR; techniques. DRIFTDRIFT(A) (A) spectra
spectra refer refer exclusively
exclusively to different
to different
non-embedded
non-embedded samples (a:fragment
samples (a: fragment withwith varnish
varnish on top,
on top, b: fragment
b: fragment with lesswith less varnish
varnish on top c: on top
degradedsilvered
c: degraded silvered surface,
surface, d: ground).
d: ground). µ-ATRµ-ATR
FT-IR (B)FT-IR (B) were
spectra spectra were on
acquired acquired
embedded on embedded
(i.e.,
cross-sections)
(i.e., and non-embedded
cross-sections) and non-embedded samplessamples
(a: layer(a:
1 oflayer
Figure 2, embedded
1 of sample, b: top
Figure 2, embedded of the b: top
sample,
of silvered surface,
the silvered non-embedded
surface, sample, c:sample,
non-embedded top of thec:non-silvered
top of the surface, non-embedded
non-silvered surface,sample, d:
non-embedded
ground, embedded sample). Red labels in the plot chart B indicate absorption bands of
sample, d: ground, embedded sample). Red labels in the plot chart B indicate absorption bands of the the polyester
embedding
polyester resin. A resin.
embedding secondA version of this figure
second version of this (Figure S1) reporting
figure (Figure the vibrational
S1) reporting modes modes
the vibrational
assignments of the IR bands in the spectra is shown in supplementary materials.
assignments of the IR bands in the spectra is shown in supplementary materials.
Starting from the top (Figure 5A, spectrum a), the broad C=O stretching band in the 1745–1730
The broad shoulders at about 1650–1660 and 1550 cm−1 may be attributed to amide I and amide II,
cm−1 region with a shoulder at 1778 cm−1 and the C-H bending at 1465 cm−1 were indicative of an oil-
respectively, thus confirming the presence of a proteinaceous substance [19]. In this regard, the µ-ATR
based glaze. Signals near 2900 cm−1 (C-H stretching band) were scarcely informative, whereas the
FT-IR
clearspectrum
shoulder-peak collected over
at 1676 cmthe surface
−1 (C=O of a sampled
stretching fragment
band) could showing
be from amide aI severely crackled
in proteins. The and
tarnished silver leaf (Figure 5B, spectrum b) resulting consistently
evidence of the latter was found also in other fragments extracted from the same sampling pointwith that of an aged egg yolk, as
suggested −1
(Figure 5A, spectrum b). As shown, C-H stretching bands (2954, 2920, and 2852 cm ), a shoulder of , the
by the appearance of very weak signal at 3070, the shoulder of C-H stretches
−1 at 2954 cm
C=O C=O stretching
at 1725 cm vibration at 1735 cm−1
−1 and absorptions in, and signalsI at
the amide 1650,
and 1576–1550,
II range and
at 1676, 1460and
1635, cm−1 of amide
1550 cm−1 areI, amide
II, consistent
and amide with
III,arespectively
protein-based bindingThe
[15,20]. medium
thin film[14].over
Noteworthy are the
the silvered slightlywas
surface perceivable signals
also characterized by
at 3320 and 3113 cm −1 and the one at 1676 cm−1, which could be assigned firmly to guanine but even
DRIFT, which is well-known to generate high-quality IR spectra in reflection–absorption configuration
to proteins
(Figure [15]. Morec).
5A, spectrum detailed
Besides information
the presence of the of outermost
overlapping layer may be
signals retrieved from
originating fromthe µ-ATR
the underlying
FT-IR stratigraphic analysis of the painting
−1 cross-section shown in
gypsum layer (1680 and 1632 cm ), a mixture of proteinaceous material (signals at 1650, 1576, Figure 2 (Figure 5B spectrum a). and
It is possible to confirm that the topcoat (i.e., layer 1) is likely constituted of oil, as suggested by the
1550 cm−1 ) and calcium oxalates (1636, 1320, and 780 cm−1 ) was identified [21–23]. The band presence
intense C=O stretching −1 band at 1730 cm−1 and by the C-H stretching (2926–2934 and 2857 cm−1) and
at 1320–1325 cm is typical of whewellite (Ca(C2 O4 ) H2 O) [24]. In the spectrum c of Figure 5A,
bending (1455–1460cm−1) vibrations. Moreover, the very weak out-of-plane CH bending vibration at−1
additional signals requiring further attention
720 cm is diagnostic for the presence of a lipidic component.
−1 were the C-HThestretches
weak band near 2900 and cm
at 1377–1382 1460 cm and
−1 may
thealso
sharp features of of
signals at 1735 −1 −1
suggest the use a mixture withcm (stretching
a natural vibrations
resin [16]. However, ofaC–O–C groups) andis1170
direct identification not cm
(stretching vibrations
straightforward, of C–O–C
as from groups).
FTIR spectra Most of
of preheated andthese
agedfeatures
oil-resin were detected
varnishes also signatures
individual by µ-ATR FT-IR
of each component are no longer recognizable [17,18].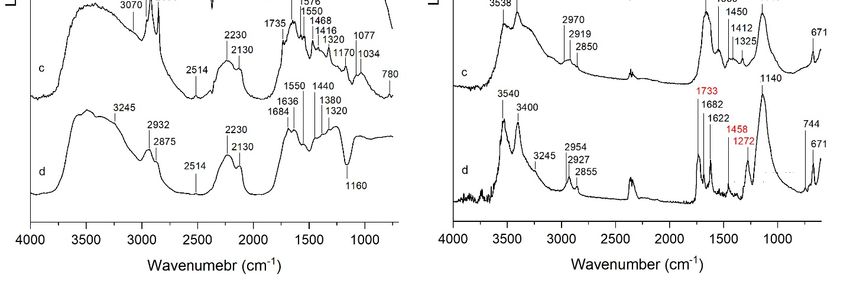
The broad shoulders at about 1650–1660 and 1550 cm−1 may be attributed to amide I and amide
II, respectively, thus confirming the presence of a proteinaceous substance [19]. In this regard, the µ-
Appl.
ATRSci. 10, 2404 collected over the surface of a sampled fragment showing a severely crackled 8 of 15
2020,spectrum
FT-IR
and tarnished silver leaf (Figure 5B, spectrum b) resulting consistently with that of an aged egg yolk,
as suggested by the appearance of very weak signal at 3070, the shoulder of C-H stretches at 2954
(Figure 5B, spectrum b) and matched very well with the signatures of waxes (e.g., beeswax, Carnauba,
cm−1, the C=O stretching vibration at 1735 cm−1, and signals at 1650, 1576–1550, and 1460 cm−1 of amide
shellac
I, amide II, etc.)
wax, [16]. III, respectively [15,20]. The thin film over the silvered surface was also
and amide
Concerning
characterized by with
DRIFT, layers
which underneath
is well-known the silver leaf, the
to generate use of a protein-based
high-quality glue was clearly
IR spectra in reflection–
confirmed,
absorptionasconfiguration
shown by the typical5A,
(Figure spectral profile
spectrum c). (Figure
Besides5B, thespectrum
presencec). of Calcium
overlappingsulphate
signalsdihydrate
was detectedfrom
originating as well, which is consistent
the underlying gypsum layer with (1680
the presence
and 1632ofcm gypsum in the ground
−1), a mixture (O-H stretching
of proteinaceous
material
bands (signals
at 3540 andat 3401
1650,cm −1 , and
1576, 1550 cm
bending −1) and calcium oxalates (1636,−1
vibration of water at 1625 cm 1320, andand 780 cm−1
vibration of) was
sulphate at
identified
1117 cm ),[21–23].
−1 The band
particularly presence
evident in theat 1320–1325
bulk of this cmlayer
−1 is typical
(Figure of 5B,
whewellite
spectrum (Ca(C
d).2OIn4)spectrum
H2O) [24]. d, some
In thebands
weak spectrum c of Figure to
not ascribable 5A,theadditional
ground signals requiring further
and red-labeled attention were
were attributable thepolyester
to the C-H stretches
embedding
near 2900 and 1460 cm−1 and the sharp −1 features of signals at 1735 cm−1 (stretching vibrations of C–O–
resin (1731, 1458, 1256, and 1275 cm ). Moreover, DRIFT spectra of the ground (Figure 5A, spectrum d)
C groups) and 1170 cm−1 (stretching vibrations of C–O–C groups). Most of these features were
figured out a strong and broad ν1 + ν3 (SO4 −2 ) overtone and combination bands in the 2500–1900 cm−1
detected also by µ-ATR FT-IR (Figure 5B, spectrum b) and matched very well with the signatures of
−1 and a strong inverted reststrahlen band at 1150–1160 cm−1 .
range,
waxeswith(e.g.,maxima
beeswax,atCarnauba,
2230 andshellac
2130 cm wax,, etc.) [16].
TheseConcerning
features arewith unequivocally
layers underneath ascribed the to calcium
silver sulphate
leaf, the use of [25]. The bandsglue
a protein-based at 1636
was and 1550 cm−1
clearly
were also of as
confirmed, amide
shownI and
by IIthedue to thespectral
typical proteinaceous material5B,
profile (Figure present
spectrumin the
c). ground.
Calcium sulphate
SEM-Back-Scattered
dihydrate was detected as Electrons(BSE) images of
well, which is consistent thethe
with Agpresence
layer (Figure
of gypsum6) ininthe
thecross-section
ground (O-H showed
a stretching
very thin bands
(≈100 at nm) metal
3540 and leaf
3401following
cm−1, bending the shape
vibrationof the ground
of water at underneath.
1625 cm−1 andAt some points,
vibration of the
sulphate at 1117 cm −1), particularly evident in the bulk of this layer (Figure 5B, spectrum d). In
Ag layer followed precisely the shape of even single gypsum grains (i.e., the area in the cross-section
spectrumby
indicated d, asome
white weak
arrowbands not ascribable
in Figure to the ground
6A) demonstrating anand red-labeled
amazing wereinattributable
accuracy the executionto the
technique
polyester embedding resin (1731, 1458, 1256, and 1275 cm −1). Moreover, DRIFT spectra of the ground
and suggesting burnishing afterward. As observed in the UV microscope images, a classic bole did not
(Figure 5A, spectrum d) figured out a strong and broad ν1 + ν3 (SO4 −2) overtone and combination
appear here to have been applied since the presence of a layer of organic matter between the metal and
bands in the 2500–1900 cm−1 range, with maxima at 2230 and 2130 cm−1, and a strong inverted
the ground was not observed (Figure 6 A1, B). The Ag layer appeared rather be attached directly to the
reststrahlen band at 1150–1160 cm−1. These features are unequivocally ascribed to calcium sulphate
preparation
[25]. The bands layerat most probably
1636 and 1550 cm trough
−1 were the
alsoprotein-based
of amide I and glue II duedetected by FTIR spectra
to the proteinaceous (Figure 5B
material
spectrum c).
present in the ground.
Figure 6.
Figure 6. SEM-BSE
SEM-BSEimages
images ofof
thethe
silver leaf.leaf.
silver Figure A and
Figure A Band
show the silver
B show the leaf in two
silver leaf different areas areas
in two different
of the cross-section. Figure A1 shows a magnified view of the area inside the white-dashedinsquare in
of the cross-section. Figure A1 shows a magnified view of the area inside the white-dashed square
figure A.
figure A.
SEM-Back-Scattered Electrons(BSE) images of the Ag layer (Figure 6) in the cross-section
White arrows in Figure 7 indicate scratches in the ground filled with Ag that might suggest the
showed a very thin (≈100 nm) metal leaf following the shape of the ground underneath. At some
application of more than one single metal leaf overlapped [26].
points, the Ag layer followed precisely the shape of even single gypsum grains (i.e., the area in the
The elemental composition of the Ag layer was detected performing a SEM-EDS analysis on the
cross-section indicated by a white arrow in Figure 6A) demonstrating an amazing accuracy in the
surface of atechnique
execution sample not andused for resinburnishing
suggesting casting and cross-section
afterward. preparation.
As observed in theThe
UVSEM-EDS spectrum
microscope
and
images, a classic bole did not appear here to have been applied since the presence of a layer of organic varnish
the area of analysis are shown in Figure 7. In particular, an area devoid of the uppermost
layers
matteralong withthe
between the metal
metal leaf
and theinground
a relatively good
was not state of
observed conservation
(Figure 6 A1, B). (not blacked)
The Ag was selected for
layer appeared
the analysis. Results led to 80% of Ag and 2% of gold (Au) along with other elements such as calcium
(Ca), silicon (Si), and aluminum (Al) mainly due to the ground [27]. The presence of chlorine (Cl) and
sulphur (S) was ascribable to the degradation products of the silver leaf and Ag sulphide was detected
by micro-Raman spectroscopy (see after). The confirmation of the provenance of Au from the Ag
layer was achieved mapping the elemental composition of an extended area. In this respect, Figure 8
shows the SEM compositional map of the area A2 (Figure 7) confirming a distribution of gold totally
overlapped to that of Ag. Conversely, no presence of gold was detected on the varnish layers ruling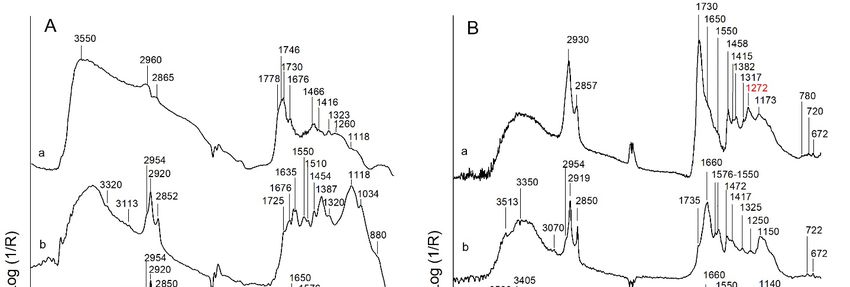
Appl. Sci. 2020, 10, 2404                                                                                           9 of 15

rather be attached directly to the preparation layer most probably trough the protein-based glue
out the possibility to be a case of varnish loaded with gold. Besides, looking at the Cl element map in
detected by FTIR spectra (Figure 5B spectrum c).
Figure 8 it is possible to observe the degradation of the Ag leaf due to the presence of chlorides, which,
     White arrows in Figure 7 indicate scratches in the ground filled with Ag that might suggest the
however, appeared to be concentrated to some spots.
application of more than one single metal leaf overlapped [26].

                  SEM-BSE
      Figure7.7.SEM-BSE
     Figure                   images
                          images        of surface
                                   of the  the surface
                                                   of theofuntreated
                                                            the untreated  painting
                                                                     painting sample.sample. A SEM-EDS
                                                                                      A SEM-EDS          analysis was
                                                                                                analysis was
     carried
      carriedout
              out onon
                     thethe
                         silver leaf.leaf.
                            silver

     The elemental composition of the Ag layer was detected performing a SEM-EDS analysis on the
surface of a sample not used for resin casting and cross-section preparation. The SEM-EDS spectrum
and the area of analysis are shown in Figure 7. In particular, an area devoid of the uppermost varnish
layers along with the metal leaf in a relatively good state of conservation (not blacked) was selected
for the analysis. Results led to 80% of Ag and 2% of gold (Au) along with other elements such as
calcium (Ca), silicon (Si), and aluminum (Al) mainly due to the ground [27]. The presence of chlorine
(Cl) and sulphur (S) was ascribable to the degradation products of the silver leaf and Ag sulphide
was detected by micro-Raman spectroscopy (see after). The confirmation of the provenance of Au
from the Ag layer was achieved mapping the elemental composition of an extended area. In this
respect, Figure 8 shows the SEM compositional map of the area A2 (Figure 7) confirming a
distribution of gold totally overlapped to that of Ag. Conversely, no presence of gold was detected
on the varnish layers ruling out the possibility to be a case of varnish loaded with gold. Besides,
looking at the Cl element map in Figure 8 it is possible to observe the degradation of the Ag leaf due
to the presence of chlorides, which, however, appeared to be concentrated to some spots.

                      Figure
                       Figure8. 8.
                                SEM-EDS elemental
                                   SEM-EDS        map map
                                           elemental  of theofsurface A2 shown
                                                               the surface     in Figure
                                                                            A2 shown  in7.Figure 7.

     The black color of the silver layer suggests a critical conservation state of the metal leaves due to
corrosion and oxidation processes. The non-invasive identification and characterization of the
degradation products in cross-sections are not trivial because of the very thin layer of silver
(submicron) as well as the wide range of compounds that can be found such as chlorides, oxides,
sulfides, and sulphates [28]. Micro-Raman spectroscopy carried out with a 100× objective yielding a
2 µm-sized laser spot on the sample allowed a punctual analysis of the silver layer and enabled the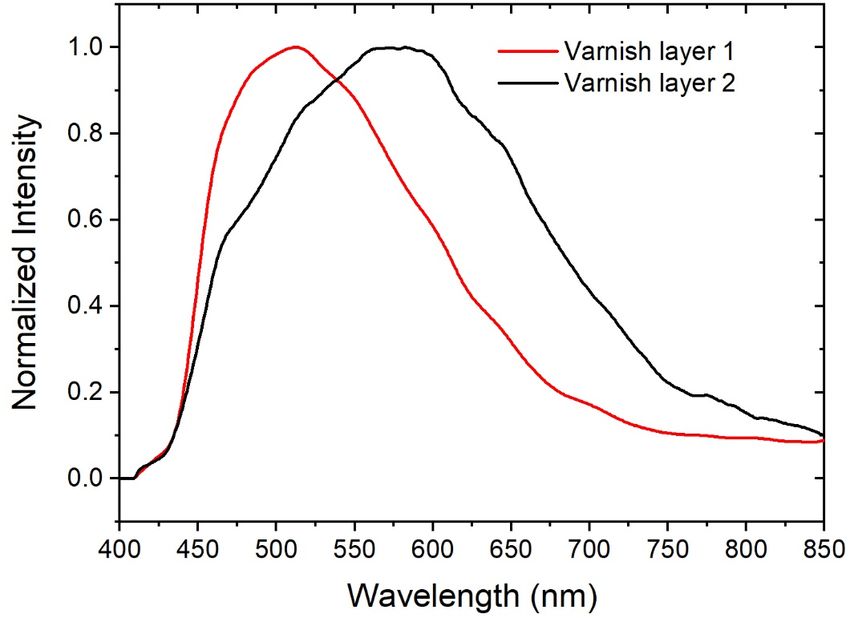
Appl. Sci. 2020, 10, 2404                                                                                 10 of 15

     The black color of the silver layer suggests a critical conservation state of the metal leaves due
to corrosion and oxidation processes. The non-invasive identification and characterization of the
degradation products in cross-sections are not trivial because of the very thin layer of silver (submicron)
as well as the wide range of compounds that can be found such as chlorides, oxides, sulfides, and
sulphates [28]. Micro-Raman spectroscopy carried out with a 100× objective yielding a 2 µm-sized
laser spot on the sample allowed a punctual analysis of the silver layer and enabled the identification
of the corrosion and oxidation products of silver. Figure 9 shows typical Raman features of Ag2 S at
158, 198, and 281 cm−1 as well as for Ag2 O at 236, 425, 491, and 563 cm−1 [28,29].

                Figure 9. Raman spectrum acquired on the silver layer of the painting cross-section.
                   Figure 9. Raman spectrum acquired on the silver layer of the painting cross-section.
     Raman spectra carried out on the preparation layer (Figure 10) showed bands of gypsum in
the formRaman    spectrasulphate
          of calcium     carried out on the preparation
                                  dihydrate   (CaSO4 2H   layer (Figure 10) showed bands of gypsum in the
                                                            2 O) and anhydrite (CaSO4 ). Raman bands at 415,
496, and 675 cm−1 were common to both phases. Bands at 607,(CaSO
   form  of calcium  sulphate  dihydrate  (CaSO 4 2H 2 O) and  anhydrite         ). Raman
                                                                           627, 4and  1015 bands
                                                                                           cm−1 at 415,ascribable
                                                                                                 were   496,
   and 675 cm were common to both phases. Bands−1
               whereas the Raman band at 1007 cm at was         607, 627, and 1015 cm were ascribable to
                −1                                                                      −1
to anhydrite                                                         ascribable to calcium sulphate dihydrate.
   anhydrite whereas the Raman band at 1007 cm−1 was ascribable to calcium sulphate dihydrate.
Moreover, micro-Raman analysis carried out on reddish grains in the preparation layer revealed the
   Moreover, micro-Raman analysis carried out on reddish grains in the preparation layer revealed the
presence  of hematite (Figure 10B).
   presence of hematite (Figure 10B).
     The coexistence of these two mineral phases of gypsum is due to the lack of temperature control
during the cooking of the mineral. Until the second half of the nineteenth century, in fact, the
calcination of gypsum did not occur in an efficient way, as there were major difficulties in controlling
the temperature of the furnaces [30]. The impossibility of keeping the adequate temperature constant
caused uneven cooking of gypsum, which led to a mixture of anhydrite and calcium sulphate dihydrate.
In this respect, a Raman analysis mapping performed at different depth (Z) on the ground of the
cross-section (Figure 11) confirmed that the distribution of the two mineral phases varied with the
distance from the surface (Z = 0). Specifically, Raman spectra acquired at different Z distance indicated
the prevalence of calcium sulphate dihydrate phase close to the Ag leaf, whereas both dihydrate and
anhydrite calcium sulphate contributed to the spectra recorded in the bulk ground.
Appl. Sci. 2020, 10, 2404 11 of 15
Figure 10. Raman spectra acquired on the ground of the painting cross-section: (A) Raman spectra
acquired on white grains (B) Raman spectrum acquired on red grains.
Figure 10. Raman spectra acquired on the ground of the painting cross-section: (A) Raman spectra
acquired on white grains (B) Raman spectrum acquired on red grains.
The coexistence of these two mineral phases of gypsum is due to the lack of temperature control
during the cooking of the mineral. Until the second half of the nineteenth century, in fact, the
calcination of gypsum did not occur in an efficient way, as there were major difficulties in controlling
the temperature of the furnaces [30]. The impossibility of keeping the adequate temperature constant
caused uneven cooking of gypsum, which led to a mixture of anhydrite and calcium sulphate
dihydrate. In this respect, a Raman analysis mapping performed at different depth (Z) on the ground
of the cross-section (Figure 11) confirmed that the distribution of the two mineral phases varied with
the distance from the surface (Z = 0). Specifically, Raman spectra acquired at different Z distance
indicated the prevalence of calcium sulphate dihydrate phase close to the Ag leaf, whereas both
dihydrate and anhydrite calcium sulphate contributed to the spectra recorded in the bulk ground.
Figure 11. Raman spectra acquired at different depth (Z) on the ground of the painting cross-section. Z
Figure=11. Raman spectra
0 corresponds acquired
to the surfaceatunderneath
different depth (Z)layer.
the Ag on the ground of the painting cross-section.
Z = 0 corresponds to the surface underneath the Ag layer.
Raman vibrational modes assignments of CaSO4 , Ag2 S, and Ag2 O compounds are reported in
Table 1 vibrational
Raman [28,31]. modes assignments of CaSO4, Ag2S, and Ag2O compounds are reported in
Table 1 [28,31].
Table 1. Raman vibrational modes assignments of CaSO4, Ag2S, and Ag2O compounds.
Compounds Raman frequency (cm−1) Assignments Comments
415 ν2(SO4) DihydrateAppl. Sci. 2020, 10, 2404 12 of 15
Table 1. Raman vibrational modes assignments of CaSO4 , Ag2 S, and Ag2 O compounds.
Compounds Raman Frequency (cm−1 ) Assignments Comments
415 ν2 (SO4 ) Dihydrate
496 ν2 (SO4 ) Dihydrate
CaSO4 (2H2 O) 607 ν4 (SO4 ) Anhydrate
627 ν2 (SO4 ) Anhydrate
675 ν2 (SO4 ) Dihydrate
1007 ν1 (SO4 ) Dih./Anh.
1015 ν3 (SO4 ) Anhydrate
158 Ag lattice
Ag2 S
198 ν(Ag-S)
281 ν(Ag-S)
236
ν(Ag-O)
Ag2 O 425
δ(Ag-O)
491
563
4. Discussion
According to a top-down/bottom-up procedure, the multianalytical approach followed in this
work provided valuable information for the discussion of all the gathered results, opening new readings
on the artistic execution technique of this rare artwork. Over the Ag leaf, two different organic layers
were found. An oil-based topcoat, probably blended with a natural resin, might have been used as the
“mecca” layer to make the silver ground brighter and like gold, thus recalling gilding techniques and
procedures mentioned in many historical treaties [10]. However, although analytically challenging, no
signals relative to natural dyes (curcuma, saffron, and aloe) added to imitate gold were found neither
using DRIFT nor micro-ATR-FTIR spectroscopies. Beneath this layer, a thin organic layer applied
originally over the silver leaf to protect it from tarnishing was found. The latter was composed of
egg yolk with wax, in part or completely transformed over time into a calcium oxalate film. These
outcomes were further strengthened by UVIVF microfluorimetry. In contrast to the topcoat, the broad,
low-intensity and remarkably red-shifted fluorescence emission of the thin layer over the Ag leaf
reflects very well the composition of an aged and altered organic layer. More importantly, the latter
figured out also a “wavy” profile when observed in the transverse section under UVIVF microscopy,
indicating either that it was still fresh when the uppermost layer was applied or that the latter was later
added causing softening and partial dissolution of the underlying layer. These two assumptions shed
new light on the execution technique of this painting, opening also new possible ways of interpretation.
Technically, it has more sense that the uppermost layer was later added as past conservation treatment
rather than applied when the underlying layer was still fresh. The lack of the top oil coat in the
sampled fragment on the frame went in this direction. Contrarily, what would be the function of this
thick oil coat later added? If intended to impart a golden hue to the silver leaf as sort of a “mecca”
layer it should have been applied over the metal leaf. In this scenario, the second hypothesis becomes
more reliable as well as the function of the old thin layer covering the Ag leaf. The latter could have
been thought either as a final application for protecting the leaf and for increasing or reducing its
shine, thus for an aesthetic reason. It is worth reporting that the use of egg yolk and wax could not be
casual and reflects to some extent the cold-encaustic technique, notoriously called “Punic wax”. In this
technique, the wax before to be added to protein compounds (casein, egg, gum, and glue) was made
water-soluble following an alkali treatment with lime. The addition of wax leads to improve adhesion,
spreading, and transparency of the medium as well as the resistance to moisture [32]. In this painting,Appl. Sci. 2020, 10, 2404 13 of 15
a similar binder was likely used to protect and make more shine the silver leaf. Further confirmations
supporting what was stated until now may be found in the method used to apply the silver leaf. In this
regard, UV images and SEM analysis showed that silver leaf was applied directly over a white ground,
as no evidence of a mordant layer was seen. The silver leaf was very thin, on the order of 100 nm.
As said, it was attached directly to the preparation layer without using a colored bole. The Ag leaf
followed precisely the shape of the preparation layer underneath with amazing accuracy suggesting
that burnishing occurred afterward. The preparation layer constituted by calcium sulphate and a
protein binder appeared to have different compositions depending on the depth from the Ag layer.
In this respect, the use of anhydrate and calcium sulphate dihydrate had two different purposes: the
first, called “gesso grosso” (coarse gypsum) with a composition of 100% anhydrite (either 75:25 or 50:50
anydrite:dihydrate) was usually used for the preparation of the bulk of the ground; the latter, called
“gesso sottile” (thin gypsum) with a composition of 100% dihydrite (or 75:25 dihydrate:anhydrate)
was used closer to the metal layers as a kind of preparation layer [33]. In line with the preparatory
technique of that time, a different distribution of calcium sulphate dihydrate and anhydrite mineral
phases was observed within the distance from the surface. Anhydrate (gesso grosso) was found mainly
in the bulk of the ground, whereas calcium sulphate dihydrate (gesso sottile) was found closer to the
metal layers as a kind of white bole layer [34–36]. This result further corroborates the execution of
the water gilding technique, where the use of a white ground bole served the purpose to burnish the
applied Ag leaf.
Finally, it can be stated that after silvering, the surface could have been burnished for obtaining
brightness and whiteness (“argento biancheggiato”) [32]. Thereby, in the absence of a warm-colored
bole layer, it would seem, that the artist’s final intention was not to achieve a gold-like appearance.
This final interpretation on the gilding technique further supports that the thin layer spread out over
the silver leaf was conceived as a finishing treatment.
5. Conclusions
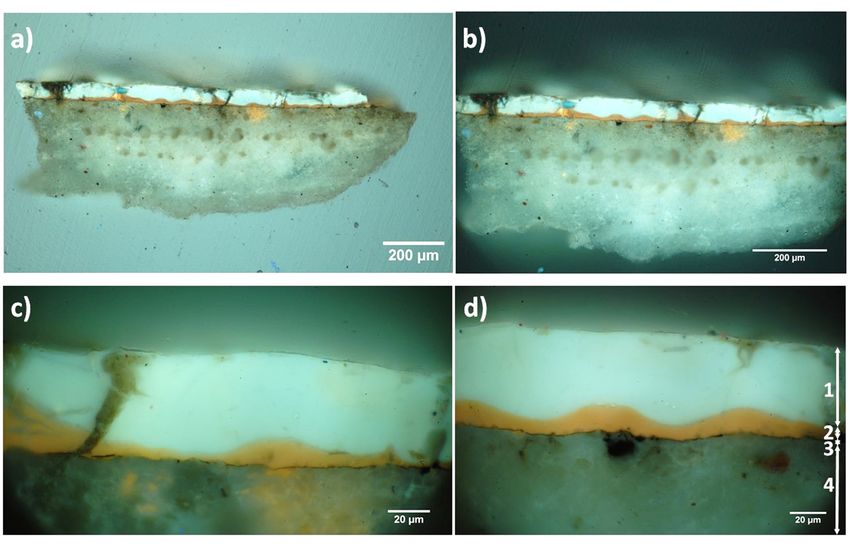
The analysis carried out on the painting depicting the “Virgin with the Child and two angels”
by a Tuscan anonymous allowed the shedding of light on a few issues about the pictorial execution
technique of the XIII century. Particularly important is the rare use of the silver leaf, unreported so far
in the scientific literature. The use of a multilayered white ground, the application of the silver leaf
applied without mordanting, the consequent burnishing of the leaf, and the wax binder as the finished
layer led to the conclusion that this artwork was not conceived to be a surrogate of gilding (“argento
deaurato”). More plausibly, it is rather an original and rare example of water silvering, where silver
leaves were intentionally applied to give a silvered look (“argento biancheggiato”). This finding could
help to improve technical knowledge of the silver leaf gilding of the 13th century as well as can be seen
as a sort of added value to the originality of this artwork.
Supplementary Materials: The following are available online at http://www.mdpi.com/2076-3417/10/7/2404/s1,
Figure S1: IR bands vibrational modes of the spectra acquired on different sampled paint fragments (see Figure 8).
Author Contributions: Conceptualization, I.O. and D.C.; methodology, I.O. and D.C.; validation, I.O., D.C. and
L.G.; formal analysis, I.O., D.C., M.B., L.C. and B.S.; investigation, I.O., D.C. and L.G.; data curation, I.O., D.C.,
M.B. and B.S.; writing—original draft preparation, I.O. and D.C.; writing—review and editing, I.O., D.C., M.B.,
P.M., L.G. and B.S.; supervision I.O.; project administration, L.G.; funding acquisition, A.L. and S.S. All authors
have read and agreed to the published version of the manuscript.
Funding: The authors also thank for funding: Fondazione CR Firenze for the grant Number n. 2013.0878 and
Regione Toscana POR FESR 2014-2020 for the project FELIX (Fotonica ed Elettronica Integrate per l’Industria),
Grant Number 6455.
Conflicts of Interest: The authors declare no conflict of interest.Appl. Sci. 2020, 10, 2404 14 of 15
References
1. Popova, O.; Smirnova, E.; Cortesi, P. Icone: Guida Completa Al Riconoscimento Delle Icone Dal VI Secolo A Oggi,
Guide Cultura; Mondadori Electa: Milano, Italy, 2003.
2. Christoph, M. Dorature E Policromie Delle Parti Architettoniche Nelle Tavole D’altare Toscane Tra Trecento E
Quattrocento; Nardini Editore: Firenze, Italy, 1996.
3. Mafodda, B. Oro, Argento E Oro Di Metà Nell’adorazione Dei Magi Di Gentile Da Fabriano. Master’s Thesis,
Università degli Studi di Firenze, Firenze, Italy, 2020.
4. Middeldorf, U.; Di Bicci, N. Neri di Bicci. Le Ricordanze (10 Marzo 1453-24 Aprile 1475), A Cura Di Bruno Santi;
Edizioni Marlin: Pisa, Italy, 1976.
5. Lalli, C.F. Innocenti La doratura nelle tecniche artistiche. OPD Restauro 2016, 28, 340–349.
6. Osticioli, I.; Capozzoli, L.; Salvadori, B.; Banchelli, M.; Lavacchi, A.; Matteini, P.; Siano, S.; Gallo, L. The “oro
di metà” Gilding in the Fifteenth-Century: A Multi-Analytical Investigation. Heritage 2019, 2, 1166–1175.
[CrossRef]
7. Osticioli, I.; Lavacchi, A.; Capozzoli, L.; Berretti, E.; Gallo, L.; Berberich, C.; Agresti, J.; Siano, S. Novel insights
on the study of a fifteenth-century oro di metà/Zwischgold gilding by means of ion and electron microscopy:
characterization of the stratigraphy avoiding cross-sections preparation. J. Cult. Heritage 2020. [CrossRef]
8. Wu, Q.; Lombardo, T.; Hubert, V.; Hildbrand, E.; Wyer, P.; Nolting, F.; Ganz, D. New insights into Zwischgold
application from a multi-analytical survey of late medieval polychrome sculptures at the Swiss National
Museum. Microchem. J. 2020. [CrossRef]
9. Sbarbaro, M. Circolazione Di Idee E Di Esperienze Economiche Nell’italia Del Duecento. La Coniazione Del Ducato
Veneziano: Scelta Politica O Economica? In Cultura Cittadina E Documentazione. Formazione E Circolazione Di
Modelli; CLUEB: Bologna, Italy, 2009.
10. Sandu, I.C.A.; Afonso, L.U.; Murta, E.; de Sa, M.H. Gildings techniques in religious art between east and
west, 14th–18th centuries. Int. J. Conserv. Sci. 2010, 1, 47–62.
11. Nef, J.U. Silver Production in Central Europe, 1450-1618. J. Politi- Econ. 1941, 49, 575–591. [CrossRef]
12. Byrne, J.P.; Stahl, A.M. Zecca: The Mint of Venice in the Middle Ages; The Johns Hopkins University Press:
London, UK, 2000.
13. Thoury, M.; Elias, M.; Frigerio, J.M.; Barthou, C. Nondestructive Varnish Identification by Ultraviolet
Fluorescence Spectroscopy. Appl. Spectrosc. 2007, 61, 1275–1282. [CrossRef]
14. Manfredi, M.; Barberis, E.; Rava, A.; Robotti, E.; Gosetti, F.; Marengo, E. Portable diffuse reflectance infrared
Fourier transform (DRIFT) technique for the non-invasive identification of canvas ground: IR spectra
reference collection. Anal. Methods 2015, 7, 2313–2322. [CrossRef]
15. Beltrán, V.; Salvadó, N.; Butí, S.; Cinque, G. Micro infrared spectroscopy discrimination capability of
compounds in complex matrices of thin layers in real sample coatings from artworks. Microchem. J. 2015,
118, 115–123. [CrossRef]
16. Martín-Ramos, P.; Fernández-Coppel, I.A.; Ruíz-Potosme, N.M.; Martín-Gil, J. Potential of ATR-FTIR
Spectroscopy for the Classification of Natural Resins. Boil. Eng. Med. Sci. Rep. 2018, 4, 03–06. [CrossRef]
17. Azémard, C.; Vieillescazes, C.; Menager, M. Effect of photodegradation on the identification of natural
varnishes by FT-IR spectroscopy. Microchem. J. 2014, 112, 137–149. [CrossRef]
18. Ciofini, D.; Striova, J.; Camaiti, M.; Siano, S. Photo-oxidative kinetics of solvent and oil-based terpenoid
varnishes. Polym. Degrad. Stab. 2016, 123, 47–61. [CrossRef]
19. Meilunas, R.J.; Bentsen, J.G.; Steinberg, A. Analysis of Aged Paint Binders by FTIR Spectroscopy. Stud.
Conserv. 1990, 35, 33–51.
20. Invernizzi, C.; Rovetta, T.; Licchelli, M.; Malagodi, M. Mid and Near-Infrared Reflection Spectral Database of
Natural Organic Materials in the Cultural Heritage Field. Int. J. Anal. Chem. 2018, 2018, 1–16. [CrossRef]
21. Mazzeo, R.; Prati, S.; Quaranta, M.; Joseph, E.; Kendix, E.; Galeotti, M. Attenuated total reflection micro FTIR
characterisation of pigment–binder interaction in reconstructed paint films. Anal. Bioanal. Chem. 2008, 392,
65–76. [CrossRef]
22. La Russa, M.F.; Ruffolo, S.A.; Barone, G.; Crisci, G.M.; Mazzoleni, P.; Pezzino, A. The Use of FTIR and
Micro-FTIR Spectroscopy: An Example of Application to Cultural Heritage. Int. J. Spectrosc. 2009, 2009, 1–5.
[CrossRef]You can also read