Customer-Validated Converged Solution Supports Microsoft SQL Server Very Large Database Configuration
←
→
Page content transcription
If your browser does not render page correctly, please read the page content below
W   H   I   T   E   P A   P   E   R

                                      Customer-Validated Converged
                                      Solution Supports Microsoft
                                      SQL Server Very Large Database
                                      Configuration

                                      Hitachi Virtual Storage Platform with Hitachi Compute Blade
                                      2000 Consolidates High-Transaction Deployments

                                      By Scott Davis, Mike Becker

                                      December 2012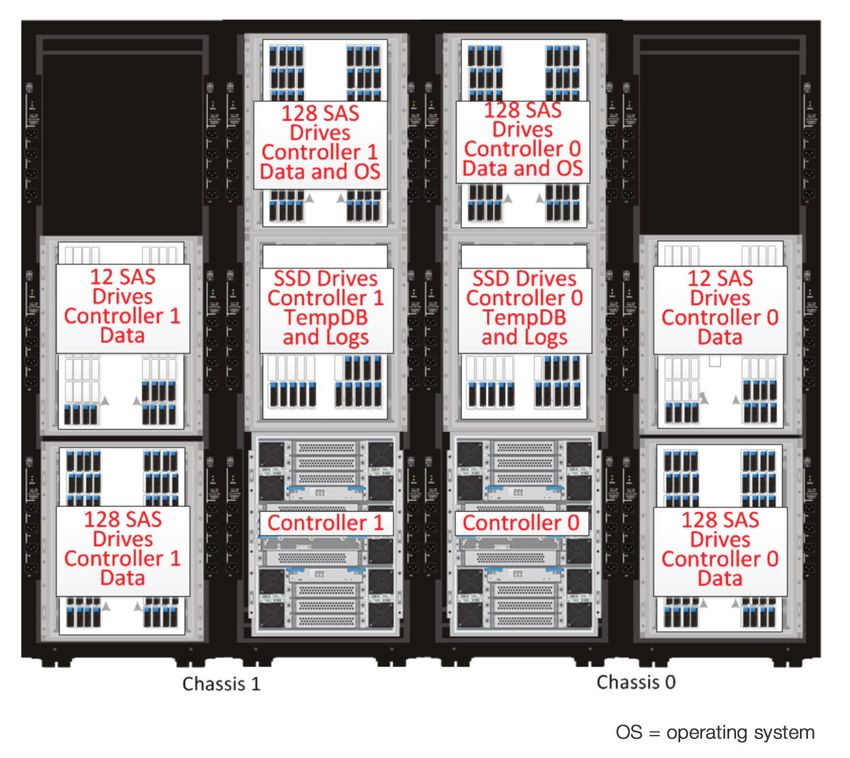
2

    Table of Contents
    Introduction                                                         3
    Solution Overview                                                    4
    Key Solution Components                                              6
          Hardware Components                                            6
          Software Components                                           11
    Solution Design                                                     14
          Very Large Database Implementation for Microsoft SQL Server   14
          Storage Architecture                                          14
          Storage Configuration                                         16
          SAN Architecture                                              20
          Network Architecture                                          21
          Compute Blade Configuration                                   23
    Engineering Validation                                              24
          Test Methodology                                              25
          Test Results                                                  26
          Latency Measured by SQLIO and IOMeter                         28
    Conclusion                                                          31
    Appendix A — Contributors                                           32
3

    Introduction
    Many organizations are experiencing tremendous growth in data and must scale their infrastructure
    to keep pace with the data explosion. Data volumes are stressing the ability of storage to scale
    in performance to manage the data as well as to scale in capacity nondisruptively. Standalone
    servers are reaching bottlenecks in memory, processing power and I/O capabilities as data volumes
    increase.

    The very large database (VLDB) solution from Hitachi Data Systems integrates with Microsoft SQL
    Server 2008 R2. This integration provides a framework to consolidate SQL OLTP and other types of
    high-transaction deployments on a single platform capable of handling current storage and server
    loads reliably while providing nondisruptive growth into the future with extensive management
    capabilities. Provided by a single vendor, this solution provides a highly scalable server and storage
    platform designed for adding capacity without downtime. The components within the platform
    provide automatic, dynamic load balancing, avoiding the need for manual performance tuning.
    All components have built-in remote management and integrate with industry-leading Hitachi
    Command Suite as well as with Microsoft management tools. All of this leads to a highly scalable
    system, removing constraints on Microsoft SQL Server with better than 99.999% availability,
    delivering constant uptime to clients now and into the future.

    This white paper's configuration information is intended for IT administrators, architects, DBAs, CIOs
    or CTOs with an interest or responsibility for planning a very large dataBase system using Microsoft
    SQL Server 2008 R2 or later.

      Note: Testing of this configuration was in a lab environment. Many things affect production
      environments beyond prediction or duplication in a lab environment. Follow the recommended
      practice of conducting proof-of-concept testing for acceptable results in a nonproduction,
      isolated test environment that otherwise matches your production environment before your
      production implementation of this solution.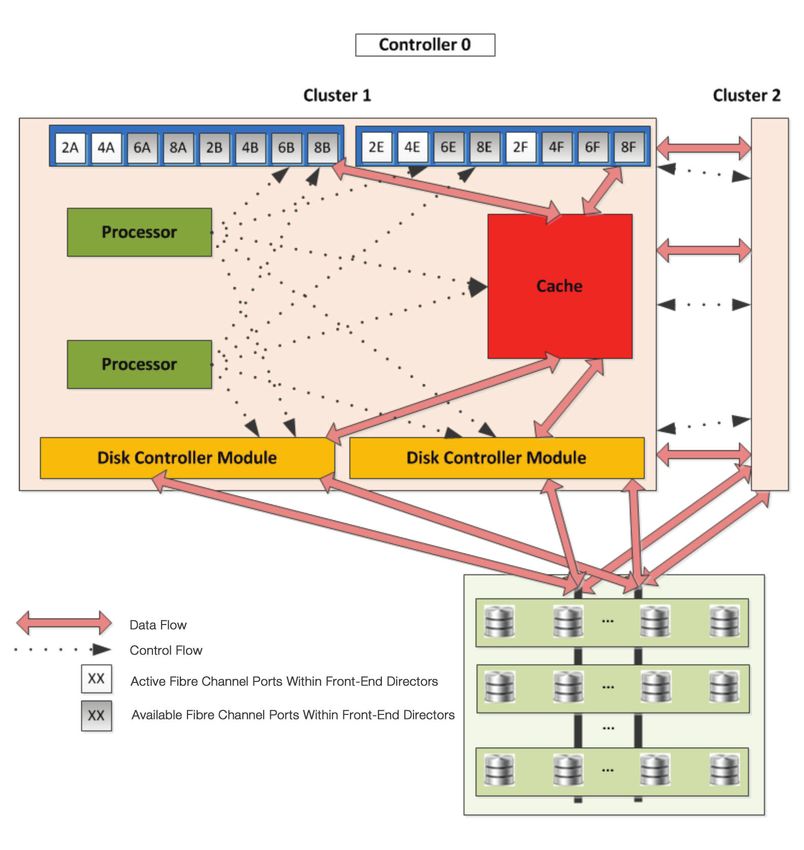
4

    Solution Overview
    The very large dataBase (VLDB) converged solution configuration from Hitachi Data Systems pro-
    vides the scalable server, storage area network, and storage to keep pace with the growth of large
    enterprise-level databases. The combination of the converged Hitachi solution with Microsoft SQL
    Server 2008 R2 provides a high-performance, extremely reliable VLDB solution with the ability to
    grow over the long term as business needs expand.

    The solution reviewed in this white paper was developed to meet a customer use case for a service
    bureau that provides personal reports to individuals and corporations in real time, with a requirement
    for rapid response times. For this customer, large amounts of data are constantly being acquired
    and updated to service queries from their Internet portal using a primary Microsoft SQL 2008 online
    transaction processing (OLTP) database approximately 12TB in size and growing to an expected
    size of 20TB or larger in the next 12 to 24 months.

    This VLDB configuration from Hitachi Data Systems comprises the following infrastructure elements:

    ■■Compute          infrastructure — 1 Hitachi Compute Blade 2000 server supporting Microsoft SQL
       Server 2008 R2 with:
      ■■ 8   blades configured into 2 symmetric multiprocessor (SMP) servers providing compute scal-
          ability.
      ■■ Fibre   Channel dual-ported Brocade host bus adapters (HBAs) for redundant connectivity to
          the storage infrastructure.
      ■■ 64   cores and 768GB of memory per SMP.
    ■■Storage        infrastructure — 1 Hitachi Virtual Storage Platform:
      ■■ Dual    controllers for active-active link redundancy and added bandwidth.
      ■■ 512GB        total system cache.
      ■■ 75TB        initial useable disk capacity with growth to multiple petabytes.
    ■■SAN     infrastructure — 2 Brocade 5100 series Fibre Channel switches:
      ■■ Redundant        active-active paths from storage to the servers using Brocade 5100 switches.
      ■■ 16   x 8Gb/sec Fibre Channel ports per switch.
    ■■Network         infrastructure — redundant paths for robust connectivity.
    Figure 1 provides an overview of the VLDB configuration showing connections between the storage
    and servers.

    This customer configuration depicts a dual SMP configuration composed of 4 blades per SMP
    connected to a Hitachi Virtual Storage Platform capable of supporting a 32TB VLDB to each SMP.
    The design encompasses the use of various storage devices. For example solid state disks (SSDs)
    provide high bandwidth for heavily used database files, such as the SQL tempdb, and logs and
    lower-bandwidth devices, such as SAS drives, for lower-bandwidth activity.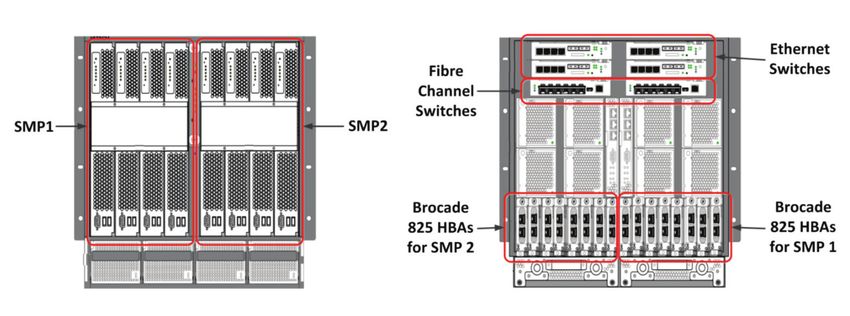
5

    Figure 1. Very Large Database Customer Configuration Components and Connections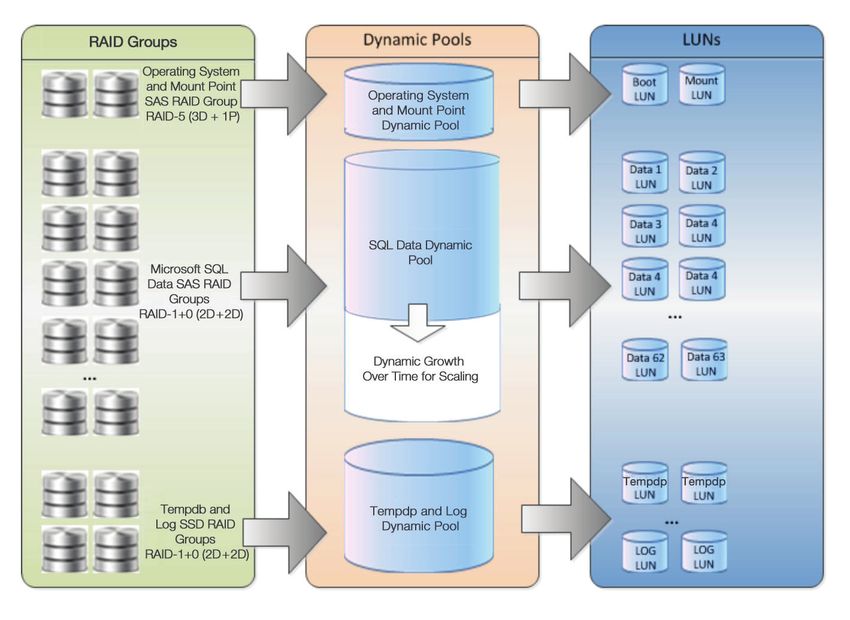
6

    Key Solution Components
    The following sections describe the key hardware and software components making up this
    solution.

    Hardware Components
    To sustain a scalable and reliable high-performance system to manage high volumes of data, the
    VLDB customer configuration is recommended.

    Table 1 lists the hardware components that this customer configuration uses.

        Table 1. The Very Large DataBase Architecture
        hardware components
          Component                     Description                     Firmware        Quantity
          Hitachi Compute Blade 2000    16 × 8 Gb/sec dual-port         A0170-B-5805    1
          chassis                       Brocade host bus adapters
                                        (HBAs)
                                        4 × 1 Gb LAN switch module
                                        2 x 8 Gb Fibre Channel
                                        switch modules
                                        2 × management modules
                                        8 × cooling fan modules
                                        4 × power supply modules
          Hitachi Compute Blade 2000,   2 × 8-core Intel Xeon X7560     EFI 03-20       8
          X57A1 blade                   2.26GHz
                                        192 GB memory
                                        1 x 4 port 1 Gb Ethernet
                                        mezzanine card
                                        1 x 4 port 8 Gb Fibre Channel
                                        mezzanine card
          Hitachi Virtual Storage       Multi-chassis18 x 8 Gb Fibre    70-03-04-0000   1
          Platform storage system       Channel ports used
                                        512 GB cache memory
                                        536x 300 GB, 10K RPM,
                                        SAS disks
                                        28x 400 GB SSDs
          Brocade 5100 switch           SAN switch with 16 x 8Gb        6.4.1b          2
                                        Fibre Channel ports
          Brocade 825 Fibre Channel     Dual-ported HBA                 v2-3-0-2 x64    16
          HBA                           8 Gb
                                        PCI Express 2.0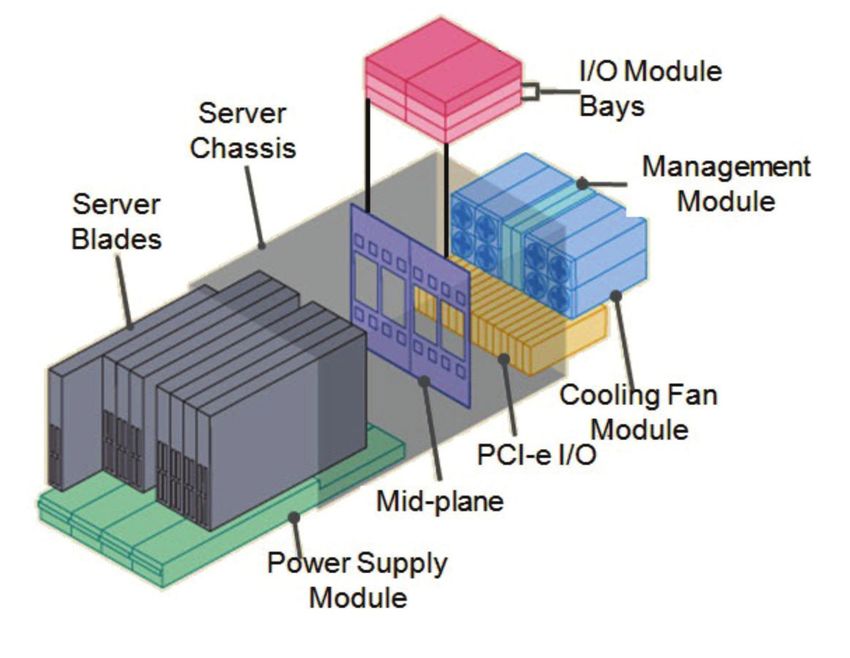
7

    Hitachi Compute Blade 2000

    Hitachi Compute Blade 2000 (CB 2000) is an enterprise-class, high-performance scalable server
    platform. Housed in a blade chassis, up to 8 dual-socket, 16-core blades can
    be accommodated. Hybrid I/O composed of internal I/O within a blade and
    PCI-e I/O in the chassis can be utilized for high bandwidth and scalability. All
    components are redundant and hot pluggable for high reliability to achieve at
    least five-9s (99.999%) availability. Built-in management features provide for
    ease of configuration and management in addition to remote management
    capability.

    Each blade has 2 processor sockets with each socket supporting up to 8 cores per processor,
    providing 16 cores per blade. A blade can have up to 384GB of memory to support compute-
    intensive applications. Blades contain 2 mezzanine I/O slots and are tied to 2 PCI-e slots, which can
    be shared, providing greater bandwidth to enable scaling for growth. In addition to the PCI-e slots,
    embedded switches within the blade enclosure provide connectivity for both Ethernet and Fibre
    Channel.

    Logical partitioning (LPAR) firmware-based resources within the blade chassis can be tied together
    or isolated to form various-sized virtual machines. Blades can also be partitioned into 2- or 4-blade
    SMP systems with I/O resources segregated into the SMP. A crossbar switch between the blades
    within an SMP is utilized for connecting the blades. Configuring blades into a 4-blade SMP provides
    a secure scalable compute resource with up to 8 sockets containing 64 cores supporting up to
    1.5TB of memory for server consolidation and highly scalable performance for high-performance
    computing environments.

    Components are redundant and hot swappable, reducing unplanned downtime and enabling
    five-9s availability. Power supplies, switches and fans are redundant and hot swappable. Blades
    can be set up to failover and be hot-replaced. Configurations can be created of N+M blades where
    N blades are backed up by M blades for failover, even across multiple Compute Blade 2000 chas-
    sis. Figure 2 provides a visualization of the layout of the CB 2000 architecture.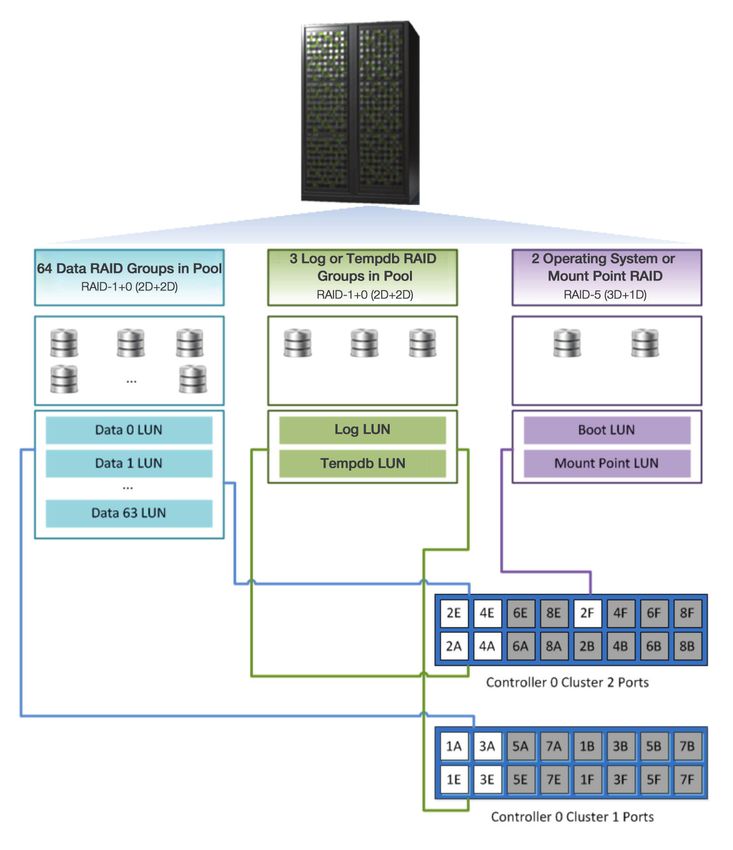
8

       Figure 2. illustrates the layout of a Compute Blade 2000 Layout

    The blade chassis is a 19-inch rack-compatible 10U-high unit. Management modules within the
    blade chassis provide both command line and GUI interfaces for configuring and managing the
    blades and chassis components remotely. The GUI management interface provides for easy con-
    figuration of the system. Interfaces are provided through the management modules for connecting
    remotely to the operating systems on the blades.

    Using CB 2000 for the VLDB configuration removes resource constraints on the Microsoft SQL
    Server. It also provides for processing and I/O scalability to meet current performance requirements
    for a VLDB and provides for future growth scaling.

    Hitachi Virtual Storage Platform

    Hitachi Virtual Storage Platform (VSP) offers an entirely new level of scalable
    enterprise storage capable of handling the most demanding workloads
    while maintaining great flexibility. The system offers high reliability (with a
    100% uptime guarantee available) while being able to dynamically scale
    bandwidth, processing and storage capacity independently. This provides
    a platform for hosting multiple scalable applications and for converging
    multiple existing systems.

    VSP is engineered to be scalable in 3 dimensions: Scale up for increased
    performance, adding just the processing, cache, ports, etc., that you need;
    scale out for increased internal capacity, with up to 1,280 large form factor
    drives, 2,048 small form factor drives, or combinations of the 2; scale deep
    to leverage industry-leading external virtualization technology and manage
    your existing storage through a common interface and management tools.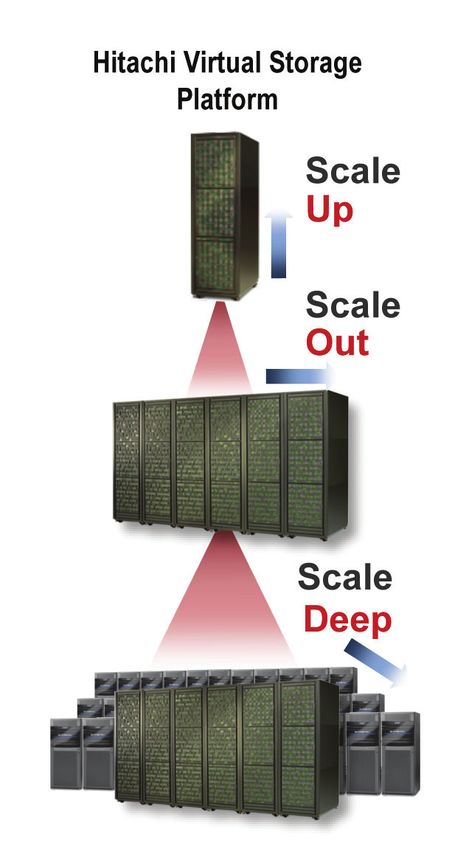
9

    Virtual Storage Platform Features

    PERFORMANCE

    ■■Predictable,    scalable performance through industry-leading engineering — every component of
       VSP is scalable independently so VSP grows as your demands grow:
      ■■ Up     to 32 processing cores.
      ■■ Up     to 1TB of shared global cache.
      ■■ Point-to-point    SAS-2 internal architecture with up to 192GB/sec expandable grid switch for
          internal data movement.
      ■■ 2.5-inch    and 3.5-inch SSD, SAS, nearline-SAS and SATA disk options.
      ■■ Up     to one hundred ninety-two 8Gb/sec Fibre Channel, IBM® FICON® and 10Gb/sec Fibre
          Channel over Ethernet (FCoE) host ports.
    ■■Hitachi    Dynamic Provisioning allows grouping of multiple RAID groups into a pool which can be
       dynamically grown or shrunk without disruption to production applications. Physical storage can
       be hot-added and appended to the pool to provide as-needed capacity and performance scal-
       ing. Dynamic provisioning utilizes a technique called "wide striping," which distributes the data
       across all the disks in a pool, delivering greater IOPS for performance scaling.
    ■■Dynamic     pools can be tailored for performance specific to different workloads, and expanded or
       shrunk on the fly while in production.

    COST EFFICIENCY

    ■■Green     Initiative: Best-in-class power, cooling, floorspace density, operating costs and data avail-
       ability mean a truly affordable solution for the long term, including a 46% smaller footprint and up
       to 48% less power and cooling than other solutions.
    ■■Thin   provisioning: Allocates capacity only as needed and includes an ability to reclaim any unuti-
       lized capacity.

    RELIABILITY

    ■■With   the industry's only 100% uptime guarantee, backed by a US$1million bond, delivering the
       highest reliability with fully redundant components, VSP provides the ability to scale capacity
       while applications are running in production.
    ■■Ability   to meet increasing demands by dynamically and nondisruptively adding internal proces-
       sors, cache connectivity, and capacity as well as scale externally attached storage as needed.
    ■■Global    support: 24/7 x 2-hour or 4-hour response.

    MANAGEABILITY

    ■■Single    integrated management suite for consolidating existing SAN and NAS systems.
    ■■Common       GUI dashboard and command line interface (CLI) for provisioning, replication, perfor-
       mance tuning and alerting.
    ■■Automatic     and dynamic internal load balancing means optimized performance and reduced
       management overhead.
10

     SYSTEM AND DATA SECURITY

     ■■Data-at-rest   encryption built into firmware with no impact on system performance.
     ■■Role-based     management system control for delegation of responsibilities and access to
       resources.
     ■■Cache     backup provided via SSD drives to enable the unit to withstand a total power outage with-
       out data loss.
     ■■Hi-Track®    Remote Monitoring system.
     ■■In-system    replication: Hitachi ShadowImage® Heterogeneous Replication volume copies and
       Hitachi Thin Image.
     ■■Logically   partition storage resources, including capacity, cache and ports for security and man-
       agement requirements.
     ■■Deliver   metered storage services and guaranteed quality of service (QoS) based on customizable
       application-specific requirements.

     VIRTUALIZATION

     ■■Industry-leading    virtualization of externally attached heterogeneous storage environments means
       you can manage all your storage via a single management tool.
     ■■Provides    the ability to nondisruptively and dynamically virtualize new or existing external stor-
       age systems without the need to perform large scale data migration; allows you to seamlessly
       migrate from older technologies to newer with just a single server reboot instead of hours or days
       of downtime waiting for data to migrate.
     ■■Leverage     existing storage assets while increasing utilization efficiency, improve performance to
       older storage systems, and extend new features such as VMware VAAI integration and dynamic
       tiering to existing storage systems.

     AUTOMATED TIERED STORAGE MANAGEMENT

     ■■Dynamic     tiering provides the ability to dynamically make more active data available on higher-
       performance disks (such as SSD drives) without operator intervention. At the same time, it
       moves less active data to lower performing drives, including modular and 3rd-party storage,
       without interrupting the application and delivering more effective use of storage resources.
     ■■Automated     policy-based mechanism transfers data volumes while matching application-driven
       requirements with the storage system characteristics for price, performance and availability.
     ■■Automated,     dynamic sub-LUN tiering enables page-level placement across internal and external
       storage tiers, including multivendor storage systems, based upon page utilization performance
       requirements.

     REPLICATION

     ■■Integrated    heterogeneous replication, any-to-any long distance replication via a single interface
       with ability to logically group sets of volumes by individual application to ensure data consistency
       spanning across infrastructure.
     ■■Support     for enhanced capabilities such as 3 data center cascading or multi-target solutions
       ensures that any future business continuity requirements can be adequately met.
11
■■Ability to perform storage clustering for virtualized environments ensures automated transparent
failover of applications.
OPERATING SYSTEM INTEGRATION
■■Microsoft Hyper-V support for live migration over distance.
■■Free Microsoft System Center plug-ins for SCOM, SCCM, SCVMM.
VLDBs typically grow at a high rate as new data is acquired and assimilated. VSP provides the
ability to dynamically grow storage without disruption to keep pace with the new data. While data is
being added, low response times are required to service database queries. The parallel paths, large
cache, and high performance of the VSP platform provide the ability to respond to these queries
while allowing the database to grow. The ability to add processors and cache allows VSP to keep
pace with expanding processing needs.
VSP also addresses VLDB backup by providing options where a database can be replicated in real
time to another VSP system onsite or offsite, with data consistency, should a failover occur.
Brocade 825 Fibre Channel HBA
Brocade 825 Fibre Channel HBA is a dual-ported 8Gb PCI-e I/O card. The card provides high-
performance data transfers and is manageable with Brocade Network Advisor.
Brocade 5100 SAN Switch
The Brocade 5100 SAN switch provides 40 x 8Gb/sec ports with the following characteristics:
■■Nonblocking architecture with all ports active at 8Gb full-duplex with no oversubscription.
■■Integrated routing capabilities to connect switches in different fabrics.
■■ISL trunking for a single logical link of up to 64Gb/sec of balanced
throughput.
Software Components
Table 2 outlines the software components used by this customer configuration.
Table 2. Customer Configuration
Software Components
Software Components Version
Hitachi Storage Navigator Microcode Dependent
Hitachi management and monitoring tools Release dependent
SQLIO disk subsystem benchmark tool 4/4/2005
Microsoft Windows Server 2008 R2 SP1, Datacenter Edition (64-Bit)
Microsoft SQL Server 2008 R2 SP1, Enterprise Edition (64-Bit)12
Hitachi Storage Navigator Modular 2
Hitachi Storage Navigator Modular 2 enables essential management and optimization of storage
system functions on a single storage unit. Using Java agents, Storage Navigator Modular 2 runs on
most browsers. A command line interface is also provided.
Use Storage Navigator Modular 2 for the following:
■■RAID-level configurations.
■■LUN creation and expansion.
■■Online microcode updates and other system maintenance functions.
■■Performance metrics.
For more information, see Hitachi Storage Navigator Modular 2 on www.HDS.com.
Hitachi Command Suite Management and Monitoring Tools
In addition to customizable dashboards, graphical reporting and service level objective manage-
ment, the new Command Suite storage management tools allow simple wizard-based control of all
Hitachi storage solutions, with many common tasks being completed in just a few clicks. The web-
based architecture allows you to customize your view of the information with column selections,
filters and dashboard modules. You can even schedule tasks for later execution, freeing you to do
other work while the system keeps you apprised of the status.
Command Suite 7 Module Features:
Hitachi Device Manager provides centralized management of distributed Hitachi resources, with
customizable views and dashboards for multisystem provisioning and management:
■■Simple wizard-based management for common operations.
■■Intuitive GUI with matching CLI functions improves
efficiencies and flexibility for administrators.
■■Host attachment and path management.
■■LUN management and migrations.
■■Cache partitioning and cache residency.
■■Replication setup and management/monitoring.
■■Integrated VMware and Microsoft Hyper-V capabilities.
■■Advanced feature management.
■■SNMP support.
Hitachi Tuning Manager provides in-depth system monitor-
ing and analysis with customizable dashboard views, dozens of
flexible reporting options, alerts and custom reports. The reports
are both real-time and historical, including forecasting, and they
facilitate identifying, isolating and diagnosing storage bottlenecks.
Tuning Manager is able to drill deeply into storage components.13
Hitachi Command Director delivers graphical dashboard moni-
toring of service level objectives and system performance with
customizable alerting and alarm thresholds. Applications such as
MS SQL are monitored for capacity, response time, IOPS, through-
put, read hits and write pending percentages.
Hitachi Performance Monitor provides visibility into resource uti-
lization within VSP. Data can be displayed via GUI or in-depth data acquired from the command line.
Hitachi IT Operations Analyzer (ITOA) monitors configuration, availability and performance of
heterogeneous data center components, including servers, switches (both IP and Fibre Channel),
and storage systems. It provides end-to-end visibility and proactive monitoring of these compo-
nents, allowing the user to troubleshoot issues quickly, before they turn into larger problems. ITOA
can monitor and alert on the application or database services running on the server and on per-
formance through the server components including CPU, memory and network (both IP and Fibre
Channel) utilization. Application plug-ins that are available for SQL Server allow specific SQL metrics
monitoring. An intuitive correlation wizard displays problem areas with percentage of accuracy rat-
ings to help you pinpoint problem areas quickly.
SQLIO Disk Subsystem Benchmark Tool
SQLIO is a tool provided by Microsoft to determine the I/O capacity of a given server/storage
configuration. The load and number of simulated database files can be varied to provide a simula-
tion of users applying stress to a simulated database. Various scenarios can be run, including read
random, read sequential, write random and write sequential tests.
SQLIO can be downloaded from Microsoft at:
http://www.microsoft.com/en-us/download/details.aspx?id=20163
Microsoft Windows Server 2008 R2 Datacenter
Microsoft Windows 2008 Server R2 Datacenter is a multipurpose server operating system designed
to increase the reliability and flexibility of your server or private cloud infrastructure.
Additional highlights of Microsoft Windows Server 2008 R2 Datacenter include the following:
■■Develop, deliver and manage rich user experiences and applications.
■■Provide a highly secure network infrastructure.
■■Increase technological efficiency and value within your organization.
For more information, see "Product Information" on www.Microsoft.com.
Microsoft SQL Server 2008 R2 — Microsoft SQL Server 2012
Microsoft SQL Server 2008 R2 and Microsoft SQL Server 2012 provide a scalable, high-
performance database engine for mission-critical applications that require the highest levels14
of availability and security. SQL Server 2008 R2 and SQL Server 2012 also provide enhanced
enterprise-class manageability for large database deployments like the one described in this
customer configuration guide.
With the Hitachi Virtual Storage Platform, Microsoft SQL Server 2008 R2 and Microsoft SQL Server
2012 provide a scalable, high-performance database engine for any midrange to enterprise-level
application.
For more information about the features of SQL Server, see the "What's New" page of SQL Server
Books Online or "Product Information" on www.Microsoft.com.
Solution Design
This section provides details on the design of a Microsoft SQL Server very large database imple-
mented with Hitachi Compute Blades and Hitachi Virtual Storage Platform. The customer configura-
tion is based on a SQL Server cluster implementation.
Very Large Database Implementation for Microsoft SQL Server
The VLDB customer configuration implementation for Microsoft SQL Server provides a base con-
figuration from which to grow and scale OLTP and other types of high-transaction databases, from
8TB to 32TB, to support growth over time.
The referenced solution defines a performance- and cost-optimized design across all key compo-
nents, including storage, server, application and configuration settings. This provides an optimal
out-of-the-box balance between Microsoft SQL Server data processing capabilities with aggregate
hardware throughput.
■■Purchase minimum storage to satisfy storage requirements while providing for adding storage for
growth and scaling as needed.
■■Provide sufficient disk throughput for SQL Server to achieve a benchmarked maximum data
processing rate.
■■Provide ability to scale processing power as the workload increases.
Storage Architecture
The storage design of this customer configuration uses Hitachi Data Systems and Microsoft recom-
mended practices for database storage design.
The design uses Hitachi Dynamic Provisioning on the VSP system to allow scaling by growing
storage capacity with no disruption in service to users. The configuration chosen makes use of
2 controllers, which permits spreading the storage load between controllers providing additional
performance scaling. The ability of VSP to symmetrically distribute the load internally is leveraged to
permit load scaling.
For additional performance, high-speed drives (SSDs) are used for SQL files that require high per-
formance, such as tempdb and transaction logs. For other SQL files with lower performance needs,
SAS drives are used.15
Figure 3 shows the storage configuration and port mapping for this customer configuration using
the storage off controller 0. Controller 1 is configured in the same manner. Each controller comprises
2 clusters of components such that if cluster 1 fails, cluster 2 will take over all operations and vice
versa. The storage is connected to the server via 2 Fibre connections such that if a connection fails,
traffic will be routed to another connection. The figure depicts the RAID groups, LUNs created from
the RAID groups, and port connections.
The storage design provides for 2 paths to every LUN. The paths are active-active to accommodate
additional bandwidth. On failure of a path, the alternate path absorbs the I/O for the failed path.
Table 4 shows the storage paths and LUN assignment on VSP.
Figure 3. Customer Configuration: Storage and Port Mapping16
Storage Configuration
The storage is configured in pools built on top of RAID groups. Each Dynamic Provisioning or "DP"
pool has the pool size set to exceed a capacity beyond that to which the database will ever grow
(this size exceeds the size of storage currently on the system). When the pool is created, RAID
groups are assigned, and LUNs are presented to the application from the pool, only enough real
storage will be allocated to the pool to accommodate the current and near-term needs of the data-
base (the real storage will be nowhere near the maximum size of the pool). Over time, as the data-
base grows and approaches the size of the real storage it was given initially, additional disks will be
installed in the system and added to the pool. The pool will nondisruptively and transparently absorb
the additional capacity, allowing the database to grow without the application or users being aware.
This is called thin provisioning: A large pool is created, only enough storage is provided to meet the
current needs, and then, as storage needs grow, additional storage is dynamically added to the pool
without disruption. This technique allows the database to scale over time while controlling costs.
Underpinning the pool are RAID groups. A failure in a disk within a RAID group is protected by the
RAID mechanism. Additionally, VSP has hot spares available and will spare out predictively when a
drive begins to fail, thus avoiding most RAID rebuilds. The failed disk can then be hot-replaced with
a new one.
Multiple pools are allocated based on disk type. For high-performance pools, SSD drives are uti-
lized. For files needing less performance, SAS drives are used to form the pool. LUNs are created
and presented as needed from these pools. Figure 4 shows the RAID group to LUN mapping.
An added benefit of using dynamic pools is the data is written in what is termed "wide striping."
Wide stripping distributes the data across all the disks in a given pool. This increases the potential
throughput by leveraging I/O from multiple drives at once. Figure 5 shows the disk distribution within
each chassis.
Figure 4. RAID Group to LUN Mapping17
Figure 5. Disk Layout Within Hitachi Virtual Storage Platform Racks.
RAID Configuration
The RAID structure used provides for maximum protection of data as well as throughput. The RAID
group to pool mapping is used to create LUNs for the following purpose:
■■Operating system (OS) pool comprises RAID-5 (3D+1P) for 2 OS drives and 2 drives containing
mount points for data LUNs.
■■Two high-performance pools (SSD drives) of RAID-1+0 (2D+2P) for tempdbs and logs for each
SMP.
■■Two pools of RAID-1+0 (2D+2P) (SAS drives) for data, 1 for each SMP.
The RAID group to pool mapping is provided in Table 3, which illustrates the RAID configuration,
showing the mapping of RAID groups to pools.18
Table 3. RAID Configuration showing the mapping
of RAID groups to pools
Purpose RAID Group Number of Drive Capacity Capacity Number of
Configuration Drives LUs
Operating System, RAID-5 (3D+1P) 8 300GB 600GB 4
Mount Point Disk
Microsoft RAID-1+0 (2D+2D) 12 300GB 2TB 2
Transaction Logs
for SMP1
SQL Transaction RAID-1+0 (2D+2D) 12 300GB 2TB 2
Logs for SMP2
PRI Data Pool RAID-1+0 (2D+2D) 256 300GB 32TB 64
SMP 1
PRI Data Pool RAID-1+0 (2D+2D) 256 300GB 32TB 64
SMP 2
Hot Spares SAS N/A 8 300GB N/A N/A
Hot Spares SSD N/A 4 300GB N/A N/A
Storage Load Distribution
The VSP storage configuration utilized 2 storage controller chassis, with each chassis containing
a controller. Each controller is comprised of multiple processors. The design allocates storage for
each SMP in its own chassis to permit the resources within that chassis to be applied to the SMP
containing a SQL instance.
Each controller has dual components with active-active paths between all components providing
high throughput and full redundancy. For optimal performance, the routing of data within the control-
ler is left to the processors in each controller, with the exception of the location of high-performance
storage (SSDs) relative to lower-performance storage (SAS). It is recommended that the SSD drives
be located as close to the controllers as possible, with the SAS drives located further away from the
controller, as illustrated in Figure 5.
The use of active-active paths allows for alternate path failover.
Figure 6 depicts the data flow within a controller. Each controller contains 2 clusters or more pre-
cisely, 2 subcontrollers; if one fails, the other can pick up the load. Within each cluster are duplicate
components and paths; if a component fails the other will take over, allowing the cluster to continue.
Both clusters communicate with each other and all paths through the clusters are used to provide
additional bandwidth for dataflow. All data is duplicated as it flows through the clusters to ensure
no data loss on a component failure. All components are hot-replaceable on failure. Not shown in
the diagram are high-speed crossbar switches, which facilitate the flow of data within the controller.
Also note that both clusters communicate with each other via an extension of the crossbar switch,
in effect creating a single larger controller and providing for higher bandwidth and reliability.
The data flow for a write (for example) is to move the data from the Fibre Channel ports to cache.
The system will acknowledge to the server that the write is complete, permitting the server to con-19
tinue executing the application without waiting for the data to be written to the back-end disks. The
data will then be written from cache through the disk controller modules to back-end storage. The
use of cache permits a quick response to the I/O operation. Since the cache is backed by battery
and SSD storage, all data is protected until it can be de-staged, or written, to back-end storage,
even during a total power outage.
Figure 6. Data Flow Within Hitachi Virtual Storage Platform from Fibre Channel Ports to
Actual Storage20
SAN Architecture
The SAN fabric is designed around a switched network utilizing Brocade switches for all data paths
between VSP and the SMPs. The OS paths are routed through embedded Fibre switches in the blade
enclosure to VSP.
Each SMP is connected to VSP through a Brocade switch with no zoning. Eight Fibre connections are
used between each SMP and Brocade switch, and between the Brocade switch and the VSP. Each
fibre link is connected to a Brocade 825 HBA port in a PCI-e slot on the SMP, and each link is active.
LUNs are arranged such that each LUN is visible from 2 links for both performance scaling and failover
protection. On failure the 2nd link assumes all traffic for the LUN without causing disruption to the ap-
plication or OS as there is no HBA failover necessary since both links are active.
Table 4 lists the LUNs and paths for each LUN. Note that since the boot LUNs were not on the data
paths and were not part of the benchmarking, they did not have duplicate paths for this test. The
design placed the boot LUNs on a separate path to avoid conflicts with data. The amount of traffic for
the boot LUNs is minimal and probably would not conflict with data traffic if the boot LUNs were on
the data paths.
Table 4. SAN Configuration with LUN purpose and
path assignments.
Secondary Path /
LUN Purpose Primary Path
Failover Path
SMP1 - Data 0 through Data 7 SQL Database LUNs 2e 2a
SMP1 - Data 8 through Data 15 SQL Database LUNs 4e 4a
SMP1 - Data 16 through Data 23 SQL Database LUNs 2a 2e
SMP1 - Data 24 - Data 31 SQL Database LUNs 4a 4e
SMP1 - Data 32 - Data 39 SQL Database LUNs 1a 1e
SMP1 - Data 40 - Data 47 SQL Database LUNs 3a 3e
SMP1 - Data 48 - Data 55 SQL Database LUNs 1e 1a
SMP1 - Data 56 - Data 63 SQL Database LUNs 3e 3a
SMP2 - Data 0 through Data 7 SQL Database LUNs 2q 2l
SMP2 - Data 8 through Data 15 SQL Database LUNs 4q 4l
SMP2 - Data 16 through Data 23 SQL Database LUNs 2l 2q
SMP2 - Data 24 - Data 31 SQL Database LUNs 4l 4q
SMP2 - Data 32 - Data 39 SQL Database LUNs 1l 1q
SMP2 - Data 40 - Data 47 SQL Database LUNs 3l 3q
SMP2 - Data 48 - Data 55 SQL Database LUNs 1q 1l
SMP2 - Data 56 - Data 63 SQL Database LUNs 3q 3l
SMP1 Boot LUN Boot LUN 2f
SMP2 Boot LUN Boot LUN 2r21
Multipathing Options and Settings
Maintaining a constant connection between the compute server and the storage requires SAN mul-
tipathing to provide the following:
■■Data redundancy.
■■Path failover mechanism in the event of a link failure.
■■Increased throughput utilizing multiple paths between server and storage.
To achieve SAN multipathing and provide LUN high availability, one of the following must be used:
■■Hitachi Dynamic Link Manager (HDLM) Advanced.
■■Microsoft MPIO.
Microsoft MPIO was used for this test. Hitachi Dynamic Link Manager Advanced is another option
providing multipath active-active and failover support.
For performance, active-active paths were used in this configuration. All data and log LUNs have an
active and secondary link. Both links are used for round-robin scheduling to allow rebalancing of the
load for optimal bandwidth. On failure of a link, both MPIO and HDLM will maintain all traffic on the
remaining link(s) without loss of data.
HBA Queue Depth settings
Setting the proper HBA queue depth is an important tuning parameter to achieve the maximum
throughput for the solution. It controls the number of disk access requests that are in flight to
storage.
Higher queue depth settings are recommended for performance. In this configuration, Brocade has
hard coded the queue depth to 32 for the HBAs.
Network Architecture
Each blade has 2 mezzanine slots on the blade able to contain an I/O mezzanine card. In the con-
figuration for the customer configuration a 4-port 1Gb network card was installed in 1 mezzanine
slot. Each blade has 2 onboard 1GB NICs providing a total of six 1Gb NIC ports from each blade.
With a 4-blade SMP configuration, 24 x 1Gb NIC ports are available.
The NIC ports between the 2 SMPs are routed within the blade chassis to 4 embedded Ethernet
switches in the blade enclosure. Each switch contains four 1Gb ports and two 10Gb ports.
Between the 4 switches are 16x 1Gb ports and eight 10 Gb ports.
Of the 16 available ports, 2 ports within the switches were used to connect the 2 SMPs to the man-
agement network. All other ports on the embedded switches are available for data transfer.
A separate port in the blade management module in the blade enclosure was used to connect the
blade chassis to the management network. Through the management port on the blade chassis,
remote management connections are provided to:
■■All embedded switches in the blade chassis (both Ethernet as well as Fibre Channel switches).
■■The blade chassis for management of the chassis components.22
■■Both SMPs for management of the blades.
■■Access RDP sessions to the server OS consoles via the SMP management port on the blade
chassis.
On VSP, a management port was used to connect VSP to the management network. The manage-
ment port on each Brocade switch was also connected to the management network.
Figure 7 shows the network connectivity for the compute and storage systems, including the
management network and management computer, as well as the connection of the SMPs to the
private LAN.23
Figure 7. Private LAN and Management Network Connectivity
Compute Blade Configuration
The customer configuration uses:
■■Eight blades (X57A1) configured in 2 four-node SMPs with a crossbar switch connecting the
blades in each SMP. Each blade contains:
■■ One 4-port 1Gb Ethernet mezzanine card.
■■ One 4-port 8Gb Fibre Channel HBA mezzanine card.24
■■Each blade is configured with 192GB RAM providing 768GB RAM per SMP.
■■Two embedded Ethernet switches in the blade enclosure each with four 1Gb ports + two 10Gb
ports.
■■Two 6-port 8Gb Fibre Channel embedded switches in the blade enclosure.
■■Eight Brocade 825 dual-ported 8Gb PCI-e HBAs per SMP (using 1 port per HBA).
■■SAN boot utilizing embedded Fibre Channel mezzanine HBAs, connecting through embedded
Fibre Channel switches in the blade enclosure.
■■Utilizing Microsoft Windows Server 2008 R2 Datacenter Edition as the OS on both SMPs.
All modules, including fans and power supplies, can be configured redundantly and hot-swapped.
This maximizes system uptime. Using the logical partitioning feature, both SMPs are configured
with 4 blades. No zoning is set up on either the Fibre Channel embedded switches or the Ethernet
embedded switches.
All modules, including fans and power supplies, can be configured redundantly and hot-swapped.
This maximizes system uptime.
Figure 8 illustrates the configuration of Hitachi Compute Blade 2000 used in this customer configu-
ration.
Figure 8. Blade Configuration and I/O Components of the Blade Enclosure
Engineering Validation
This describes the methodology and test results used to validate this customer configuration.
The customer configuration was utilized to demonstrate the scalability of Hitachi Compute Blade
2000, Hitachi Virtual Storage Platform and Microsoft SQL 2008 R2 with a very large database. Vari-
ous scenarios were run to characterize the configuration under different loads and varying sizes of
the simulated database. The results highlighted the following:25
■■This is not a bottleneck.
■■All components reach optimal performance.
Test Methodology
The test methodology used on this customer configuration did the following:
■■Provided a baseline performance benchmark for the solution.
■■Determined the overall solution capability at peak operations.
Server Testing Scenarios
The testing methodology was designed to drive various levels of stress over various sizes of files
representing the database. This action characterizes and validates the capability of the customer
configuration to scale with both performance and capacity. The performance characterization was
designed to provide stress on the server, SAN and storage.
The files were distributed across sixty-four 500GB volumes. Each volume contained a 423GB mdf
file created by SQLIO. The choice of 423GB was to remain close to 80% utilization of each vol-
ume. As the data on a volume exceeds 80% of the volume capacity, the performance begins to be
impacted.
To validate different sizes of files representing the database, various combinations of volumes were
used for SMP1, as shown in Table 5. The storage for SMP2 was laid out in the same manner.
Table 5. DATA VOLUME CONFIGURATION
Ports Used on Hitachi
Number of Volumes Capacity in Megabytes LUNs
Virtual Storage Platform
16 8 Data0 to Data15 2a, 2e, 4a, 4e
32 16 Data0 to Data31 2a, 2e, 4a, 4e
2a, 2e, 4a, 4e
48 24 Data0 to Data47
1a, 1e, 3a,e3
2a, 2e, 4a, 4e
64 32 Data0 to Data63
1a, 1e, 3a,e3
The test scenarios included the following type of runs:
■■Read Sequential.
■■Read Random.
■■Write Sequential.
■■Write Random.
Each test scenario was run with block sizes of 8k, 16k, 32k and 64k, with each run lasting 2
minutes.
Each scenario was run against each set of volumes (the "Number of Volumes" column in Table 5
with a set being 16, 32, 48 or 64 volumes) to simulate a database with the capacity shown in the26
table. For each volume in the set of volumes in a given test, a SQLIO process was initiated to ex-
ercise the appropriate test against that volume. For example, for 16 volumes, 16 SQLIO processes
were initiated: 1 process against each volume. For each process, runs were made with the number
of threads set to 1, 2, 4 and 8 to incrementally increase stress against each storage configuration of
16, 32, 48 and 64 volumes.
Test Results
Table 6 shows the results for the Read Sequential test on SMP1. The test started at 16 volumes
(8TB) with 16 processes and 8 threads per process. The test increased the number of volumes by
16 for each row to 64 volumes with 64 processes and 8 threads per process.
Table 6. READ SEQUENTIAL TEST RESULTS
Number of
Simulated Processor
Processes Average
Number of Database Throughput Utilization:
Times IOPS Latency in
Volumes Size (megabytes) Percentage of
Number of (milliseconds)
(terabytes) CPU
Threads
16 6.7 128 2,296 36,738 112* 5
32 13.5 256 2,624 41,987 195* 8
48 20.3 384 4,515 72,243 179* 88
64 27.0 512 4,906 78,507 217* 100
* The high average latencies are due to the inability to constrain the parameters in SQLIO. IOMeter was used to gather
more realistic latency information. The use of IOMeter and the latency are discussed in latency measured by SQLIO and
IOMeter.
Table 7 shows the results for the Write Random test on SMP1 to give a feel for performance where
more than one type of I/O is performed. The test started at 16 volumes (8 TB) with 16 processes
and 8 threads per process. The test increased the number of volumes by 16 for each row to 64
volumes with 64 processes and 8 threads per process as was done for the read random test.
Table 7. results of the Write Random Test
Number of
Simulated Processor
Processes Average
Number of Database Throughput Utilization:
Times IOPS Latency in
Volumes Size (megabytes) Percentage
Number of (milliseconds)
(terabytes) of CPU
Threads
16 6.7 128 1,301 20,819 197* 2
32 13.5 256 1,471 23,535 362* 3
48 20.3 384 2,299 36,789 340* 4
64 27.0 512 2,322 37,164 445* 5
* The high average latencies are due to the inability to constrain the parameters in SQLIO. IOMeter was used to gather
more realistic latency information. The use of IOMeter and the latency are discussed in latency measured by SQLIO and
IOMeter.27
Table 8 compares the Read Sequential runs with SMP1 and SMP2. The test started at 16 volumes
(8TB) with 16 processes and 8 threads per process. The test increased the number of volumes by
16 for each row to 64 volumes with 64 processes and 8 threads per process.
Table 8. Hitachi Virtual Storage Platform
Performance With Both Controllers Under
Stress from 2 SMPS
Number of
Simulated Processor
Number Processes Average
Database Throughput Utilization:
SMP of Times IOPS Latency
Size (megabytes) Percentage
Volumes Number of (milliseconds)
(terabytes) of CPU
Threads
SMP1 16 6.7 128 2,296 36,738 112* 5
SMP2 16 6.7 128 2,373 37,962 108* 5
SMP1 32 13.5 256 2,624 41,987 195* 8
SMP2 32 13.5 256 2,641 42,254 193* 12
SMP1 48 20.3 384 4,515 72,243 179* 88
SMP2 48 20.3 384 4,100 65,610 192* 100
SMP1 64 27.0 512 4,906 78,507 217* 100
SMP2 64 27.0 512 4,166 66,661 253* 100
* The high average latencies are due to the inability to constrain the parameters in SQLIO. IOMeter was used to gather
more realistic latency information. The use of IOMeter and the latency are discussed in latency measured by SQLIO and
IOMeter.
Of interest is the effect of hyper-threading on performance. An SMP has 64 cores, with each core
capable of hyper-threading, giving a total of 128 processors per SMP. Table 9 compares the Read
Sequential data from SMP1 for hyper-threading "on" and hyper-threading "off."
Table 9. performance for the Read Sequential TesT
Number of
Simulated Processor
Hyper- Number Processes Average
Database Throughput Utilization:
Threading of Times IOPS Latency
Size (megabytes) Percentage
Off or On Volumes Number of (milliseconds)
(terabytes) of CPU
Threads
Off 16 6.7 128 2,296 36,738 112* 5
On 16 6.7 128 2,286 36,582 111* 2
Off 32 13.5 256 2,624 41,987 195* 8
On 32 13.5 256 2,602 41,626 197* 4
Off 48 20.3 384 4,515 72,243 179* 88
On 48 20.3 384 4,521 72,339 192* 100
Off 64 27.0 512 4,906 78,507 217* 100
On 64 27.0 512 4,466 71,467 235* 100
* The high average latencies are due to the inability to constrain the parameters in SQLIO. IOMeter was used to gather
more realistic latency information. The use of IOMeter and the latency are discussed in latency measured by SQLIO
and IOMeter.28
Latency Measured by SQLIO and IOMeter
Multiple tools exist to provide stress to characterize and test various aspects of a system such
as the one outlined in this document. Each tool has its strengths and weaknesses. While all tools
can provide characterizations, the resultant data must be viewed in context. To evaluate the most
accurate application characterization, the actual application should be run in a production-realistic
environment.
To provide a characterization for the configuration used in this paper, the primary tool used was
SQLIO. SQLIO I/O is designed to provide extensive stress to the storage system in a given con-
figuration. SQLIO can be tuned to stress storage with reads and writes in a sequential or random
manner. SQLIO cannot be tuned to provide reads and writes with both sequential and random data.
SQLIO cannot be fine tuned to reflect a random workload.
IOMeter is a tool also used to characterize I/O subsystems and has the capability to be tuned more
closely to reflect a given workload. The load generated by IOMeter can be modeled to reflect both
reads and writes issued in a more random order, if desired.
In characterizing the system used here to reflect the customer's configuration, it was found that
SQLIO was able to put high stress on the system but was not able to be throttled. This resulted in
good throughput but poor latency numbers.
To try to provide more realistic latency numbers, IOMeter was used to create a comparable work-
load on the system used for this paper. In general, an OLTP workload will be composed of 67%
read and 33% write. To determine the latency for the configuration, a workload profile was created
with this mix of operations.
To generate the desired workload, IOMeter was run on the same configuration as was used to char-
acterize the customer workload for this paper. Sixty-four LUNs were used with each LUN 500GB in
size. The file used to test on each LUN used 80% of each disk. To generate the workload, a worker
(a thread) was created for each LUN. The worker was configured to vary the load with 67% reads
and 33% writes. Multiple parameters were varied in an attempt to demonstrate how the workload
would affect the performance and latency within the configuration.
Transaction databases are characterized as using 8k, 16k and 64k buffers. To portray the latency
more closely, tuned test profiles were created with 4k, 16k, 64k and 128k buffers. The tests used to
present the data below were all read sequential. They provide a comparison to the read sequential
tests from SQLIO (as presented for the configuration described in this paper) to be able to gauge
the differences in latency with a more realistic workload.
The configuration used comprised a 4-blade SMP system with 64 cores. The storage was a Fibre
Channel storage system with 64 LUNs composed of 256 spindles configured as RAID-1+0 (2D
+ 2D). One worker was assigned to each LUN. Each worker was a thread. Sixty-four workers (or
threads) were assigned to a manager in IOMeter. A 2nd manager was created with 64 workers
(threads), each worker assigned 1 of the 64 LUNs (hence each LUN had 2 workers, 1 from each
manager). This configuration thus had 128 threads to generate load against the 64 LUNs.
Table 10 reflects the latency based on the runs made with IOMeter. Various buffer sizes and out-
standing I/O values were utilized to show the scaling and latency progression. The workload repre-
sents 128 active threads on 64 processors.29
The profiles are 100% read sequential. Data was created using 2 managers, each with 64 workers.
A total of 64 LUNS were used (the same configuration as was used by SQLIO in this paper).
Workers were assigned 1 LUN each, while each LUN was shared by a worker from each manager
reading data from it.
TABLE 10. IOMETER OF VARIOUS READ PROFILES SHOWS LATENCY
UNDER DIFFERENT CONDITONS
Outstanding
Block Size Transfer Delay
I/Os per Transfer Average CPU Burst Length (I/
(kilobytes) (milliseconds)
Target IOPS Rate Latency Utilization Os) (IOMeter
(IOMeter (IOMeter
(IOMeter (megabytes) (milliseconds) (percentage) Parameter)
Parameter) Parameter)
Parameter)
4 1 81015 331 1.57 58 0 1
16 1 98006 1605 1.3 51 0 1
32 1 110760 3629 1.15 36 0 1
64 1 82446 5403 1.55 6 0 1
128 1 42121 5520 3.03 4 0 1
4 4 69385 284 7.37 94 0 1
16 4 69728 1142 7.33 92 0 1
32 4 68882 2257 7.42 93 0 1
64 4 84980 5569 6.02 9 0 1
128 4 42673 5593 11.99 4 0 1
4 8 69920 286 14.63 98 0 1
16 8 69601 1140 14.7 98 0 1
32 8 68694 2250 14.89 98 0 1
64 8 81582 5346 12.54 25 0 1
128 8 42550 5577 24.05 4 0 1
Table 11 shows latency with 64 active threads on 32 processors to give a perspective of how the
configuration scales, based on load and processors.30
TABLE 11. IOMETER PARAMETERS SHOWING LATENCY:
64 THREADS, 32 PROCESSORS
Outstanding
Block Size Transfer Delay Burst
I/Os per Transfer Average CPU
(kilobytes) (milliseconds) Length (I/
Target IOPS Rate Latency Utilization
(IOMeter (IOMeter Os) (IOMeter
(IOMeter (megabytes) (milliseconds) (percentage)
Parameter) Parameter) Parameter)
Parameter)
4 1 228447 930 0.27 33 0 1
16 1 172008 2810 0.37 24 0 1
64 1 55917 3660 1.14 10 0 1
128 1 28348 3710 2.25 5 0 1
4 4 189924 770 1.34 87 0 1
16 4 193272 3600 1.3 46 0 1
64 4 56706 3710 4.51 8 0 1
128 4 28445 3720 8.99 5 0 1
4 8 207193 840 2.47 76 0 1
16 8 207163 3390 2.47 47 0 1
64 8 57168 3740 8.95 9 0 1
128 8 28560 3740 17.92 5 0 1
To validate the data from SQLIO and IOMeter are valid and consistent comparable runs were
compared.
Table 12 provides the results. In both cases, 128 threads were used to generate work against 64
LUNs. The data for transfer rate, average latency and CPU utilization were close.
Based on the testing methodology, it was found that it was easier to throttle workload and generate
more realistic workload using IOMeter.
Table 12 provides a comparison of the data acquired from SQLIO and IOMeter. The data was
created for 64 LUNS with 128 threads to create a load on 64 processors. The data is relatively
consistent, showing that the 2 tools are generating consistent results based on the input parameters
selected.
TABLE 12. COMPARISON OF SQLIO AND IOMETER DATA
Outstanding
Block Size Transfer Transfer Average Average CPU CPU
I/Os per
(kilobytes) IOPS IOPS Rate Rate Latency Latency Utilization Utilization
Target
(IOMeter IOMeter SQLIO IOMeter SQLIO IOMeter SQLIO IOMeter SQLIO
(IOMeter
Parameter) (gigabyte) (gigabyte) (millisecond) (millisecond) (percentage) (percentage)
Parameter)
8 32 69868 91013 572 711 58.63 54.89 100 98
16 32 69668 83561 1141 1305 58.24 58.70 100 100
32 32 69023 79833 2261 2494 59.31 55.20 100 100
64 32 69988 80862 4586 5054 58.45 54.31 84 10031
Conclusion
The very large database customer configuration from Hitachi Data Systems provides an integrated,
highly reliable and highly scalable Microsoft SQL Server solution, removing many of the constraints
imposed by other solutions. This architecture delivered by a single vendor with a history of providing
highly reliable mission-critical implementations, brings together the design experience and proven
technologies to keep businesses up and running.
The Hitachi Compute Blade 2000 provides a highly scalable compute platform. The ability to hot-
swap and upgrade components without downtime permits capacity scaling while providing continu-
ous service to clients. The servers within Compute Blade 2000 can be joined together to provide
larger single-server platforms and address compute needs as the database grows. The drivers
integrated into the OS and platform provide for dynamic load balancing, reducing the need to manu-
ally tune the system.
Hitachi Virtual Storage Platform provides for extensive storage capacity growth and performance
scaling without downtime. The design of the platform distributes load through multiple balanced
paths, enabling dynamic load-balancing plus failover capability. VSP's abilities to hot-add new
capacity and hot-replace failed components enable it to deliver the industry's only 100% uptime
availability.
The remote management capabilities built into all components of this system, coupled with Hitachi
Command Suite and integration with industry-standard Microsoft tools, deliver ease of installation
and ongoing management while reducing cost and complexity.
The VLDB customer configuration from Hitachi Data Systems provides a highly scalable and reliable
solution with long-term investment protection from a company that specializes in global enterprise
mission-critical business solutions.32
Appendix A — Contributors
The configuration reviewed in this white paper was validated at the Microsoft Enterprise Engineering
Center on the Microsoft main campus with the cooperation of Microsoft. The architecture is based
on a Microsoft and Hitachi global account with a large web presence. The account required a large
backing storage of historical data for immediate queries and a constant flow of new data continu-
ously updating the historical data.
The information included in this document represents the expertise, feedback and suggestions of a
number of skilled practitioners. The authors recognize and sincerely thank the following contributors
and reviewers of this document:
Ralph Lobato — Hitachi Data Systems, Sponsor
John Wildes — Hitachi Data Systems
Rick Andersen — Hitachi Data Systems
Nathan Tran — Hitachi Data Systems
David Punnett — Hitachi ConsultingCorporate Headquarters Regional Contact Information 2845 Lafayette Street Americas: +1 408 970 1000 or info@hds.com Santa Clara, California 95050-2639 USA Europe, Middle East and Africa: +44 (0) 1753 618000 or info.emea@hds.com www.HDS.com Asia Pacific: +852 3189 7900 or hds.marketing.apac@hds.com Hitachi is a registered trademark of Hitachi, Ltd., in the United States and other countries. Hitachi Data Systems is a registered trademark and service mark of Hitachi, Ltd., in the United States and other countries. IBM and FICON are registered trademarks of International Business Machines. All other trademarks, service marks and company names in this document or website are properties of their respective owners. Notice: This document is for informational purposes only, and does not set forth any warranty, expressed or implied, concerning any equipment or service offered or to be offered by Hitachi Data Systems Corporation. © Hitachi Data Systems Corporation 2012. All Rights Reserved. WP-446-A DG December 2012
You can also read