Christchurch International Airport Limited: Additional material on the reset of aeronautical prices for the period 1 July 2017 to 30 June 2022 ...
←
→
Page content transcription
If your browser does not render page correctly, please read the page content below
Christchurch International
Airport Limited:

Additional material on the reset of
aeronautical prices for the period
1 July 2017 to 30 June 2022

Public version

Updated - 28 June 2018

INTRODUCTION

1   The Commerce Commission (Commission) and Christchurch International Airport
    Limited (CIAL) have been discussing additional information that would assist the
    Commission’s review of CIAL’s aeronautical prices for the period 1 July 2017 to
    30 June 2022 (PSE3). Additional information is provided below, with further
    reference material appended.

    RELATIVE CONTRIBUTIONS TO THE IRR CALCULATION

2   The Commission requested further detail on the relative impact on CIAL’s target
    returns of the use of a simplified version of the building blocks calculation, the
    exclusion of pricing incentives from the cost base, and the reduction in revenue from
    check-in activities resulting from existing contracts.

3   Our “waterfall” analysis is shown below. CIAL has shown this for both the IRR
    across our total disclosure and for the IRR across our PSE3 pricing decision. The
    difference is the inclusion in the total disclosure IRR of non-priced services
    (regulated services provided under contracts, discussed in more detail below).

                                      Disclosure IRR

                                                       A.    ComCom mid-point WACC
                                                       B.    Higher DRP
                                                       C.    Higher asset beta
                                                       D.    Pricing WACC
                                                       E.    Higher expected retrurn for non-pricing services
                                                       F.    Effect of simple revenue requirement calculation
                                                       G.    Shortfall from check-in
                                                       H.    Non-recovery of incentives
                                                        I.   Expected return - disclosure

                                        Pricing IRR

                                                       A.    ComCom mid-point WACC
                                                       B.    Higher DRP
                                                       C.    Higher asset beta
                                                       D.    Pricing WACC
                                                       E.    Effect of simple revenue requirement calculation
                                                       F.    Shortfall from check-in
                                                       G.    Non-recovery of incentives
                                                       H.    Expected return - pricing

4   To explain each step in the waterfall:

    Debt Risk Premium
5   CIAL used its own credit rating of BBB+ rather than the Commission’s benchmark
    credit rating of A-. This resulted in a debt risk premium of 1.84% rather than
    1.45%.

                                                                                                                2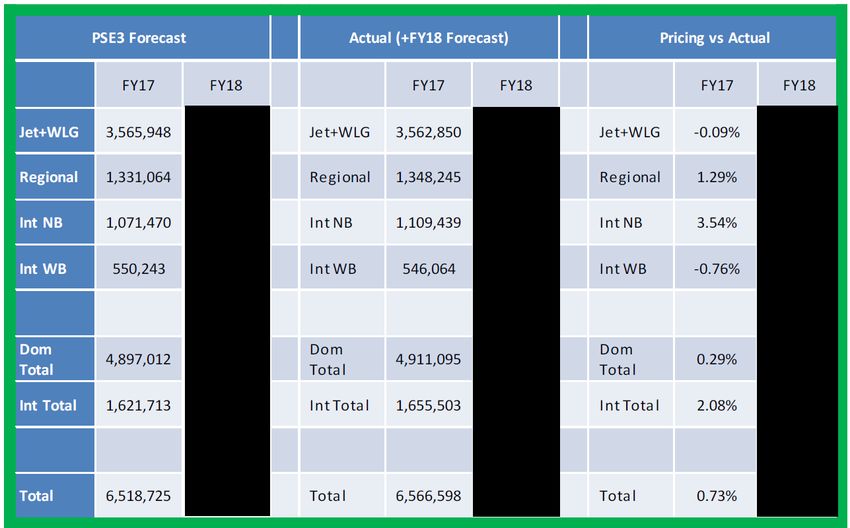
6        This approach has been confirmed by recent market experience with CIAL having
         just recently completed a listed bond issue in the domestic debt capital markets with
         a six-year maturity.

7        The issue was rated BBB+ by S&P Global Markets and priced consistently to
         secondary trading marks for comparable BBB+ bonds.

         Asset beta
8        As the Commission is aware, CIAL consulted on and used an asset beta estimated to
         reflect CIAL’s circumstances. This was higher than the Commission’s benchmark
         asset beta.

         Expected returns from non-priced services
9        In PSE3 the expected returns from non-priced services (regulated services provided
         under existing contracts and not included in the PSE3 pricing decision) are higher
         than the expected IRR reflected in CIAL’s PSE3 pricing decision. In PSE2 the
         situation was reversed, and expected returns from non-priced services were lower
         than the pricing IRR.

10       The issues associated with benchmarking the IRR of non-priced services are
         discussed in more detail below.

         Effect of simple revenue requirement calculation
11       When preparing and consulting on its PSE3 pricing model CIAL used a model that
         assumed most cash flows happen at the end of the year. This reflects an earlier
         iteration of the Commission’s IMs. The alternative was to apply the Commission’s
         more recent treatment of introducing intra-period cash flows.

12       This was a deliberate decision to keep the pricing model calculation as simple,
         understandable, and informative as possible. CIAL constructed the model with the
         intention of providing it to its airline customers and wanted it to be as transparent
         and usable as possible. The model was provided during consultation.

         Shortfall from check-in
13       In PSE2, check-in services were provided to each airline under separate agreements
         as a non-priced service. In PSE3 CIAL bought check-in services into the priced
         services, including both costs and revenues in the price model.

14       However, existing contracts mean that CIAL's revenue from check-in activities will
         be lower than the revenue requirement.1 Specifically, one of its airline customers
         has an existing agreement that continues until FY21. The prices under this
         agreement are lower than the new cost-based charge. The pricing model includes
         this shortfall in revenue until this customer moves to the published price for FY22.

         Non-recovery of incentives
15       We discuss CIAL’s treatment of incentives next.

         TREATMENT OF INCENTIVES

16       The Commission asked for more information on CIAL’s treatment of incentives, and
         whether they are included in opex and demand forecasts.

     1
         Pricing Event Disclosures for PSE3, items 18(v) and 19(v), contained in second text-box under these
         items.

                                                                                                               3
17 CIAL undertakes two forms of market stimulation:
Direct expenditure on general marketing activities, covering aeronautical
development and marketing, including promotion of specific destinations and
routes, and general marketing of the airport itself, and
Bilateral arrangements with airlines that agree rebates (or similar) to encourage
the establishment of new services or capacity.
18 Only the costs of the first kind of activity are included in CIAL’s PSE3 pricing model
(as opex). Our airline customers gave strong feedback that the cost of the second
activity should be excluded from the model. This approach has been consistently
applied across both PSE2 and PSE3 pricing models.
19 In terms of quantum of marketing included in the opex forecasts, the forecast levels
in PSE3 are relatively consistent and comparable with actual base rate spend in
PSE2.
20 For the purposes of pricing disclosure, CIAL was required to disclose both forms of
incentives and its disclosures reflect that requirement. The pricing incentives that
CIAL included in its PSE3 disclosures reflected the rebates forecast under
agreements in place at the end of PSE2, as well as an assumption that one of those
agreements will be extended in substantially similar form.
21 Both kinds of market stimulation activities are taken into account when forecasting
demand. The demand forecasts were made on the basis of these market stimulation
activities occurring, both marketing spend and agreed arrangements. The bottom
up forecasts were based on scheduled capacity that directly reflect such activities
and arrangements.
22 It is possible that additional passenger growth will occur during PSE3 as a
consequence of CIAL’s market development activities and the consequent creation of
new routes / services. However, it would not be expected that growth from this
source would add a material increment to the expected IRR over the period.
23 While each market development / incentive package is different:
CIAL typically would expect an incentive package to make a loss in the first year /
season – i.e., incremental direct expenditure exceeding any additional revenue,
break-even in the second year / season and only start making a contribution by the
third year;
In some cases, it may take an extended time before services / routes become
established and material – services may commence as charters, become seasonal /
infrequent services and only become regular / year-round after a number of years /
seasons;
CIAL bears the risk from these promotional activities – it may incur material
out-of-pocket expenses promoting new services / routes, none of which can be
recouped if the service / route is not successful and the airline withdraws.
24 CIAL’s view is that the active promotion of growth in traffic through the airport –
including through the active encouragement of new services / routes – is in the
long-term interests of passengers – its ultimate customers. Airports are in a
position from which they can seek to influence airlines to expand the choices to
passengers flying from and into a location.
425 Pricing incentives are challenging to accommodate in an ex ante cost-based price
determination. As noted above CIAL has faced substantial resistance from airline
customers to recovering the cost of pricing incentives through PSE3 prices, even for
incentives that clearly relate to volumes that are being factored into prices.
However without recognition of these costs, the apparent expected return will
overstate the true expected return and the incentive / ability of an airport to
promote growth will diminish.
PSE2 forecasts vs actuals
26 The promotions and airline incentives forecast in PSE2 pricing disclosure are of the
same type as CIAL had included in PSE3 pricing disclosure, although for PSE2 this
was mainly general marketing of the airport, with limited costs in respect to
destination and route marketing.
27 CIAL’s view is that the actual spend in this area for PSE2 is the relevant matter
when comparing to PSE3 forecasts (i.e., whether the purpose is to assess the
reasonableness of the PSE3 opex forecasts, or to test whether the PSE3 demand
forecast is consistent with the items included in the PSE3 opex forecasts).
28 At the time that the PSE2 forecasts were put together, there was significant
uncertainty around the impact of earthquakes on demand etc.
29 As CIAL progressed through PSE2, significant work was required to
stimulate/recover demand which came at a cost which was well above that forecast
at the start of PSE2. Consequently, as CIAL has highlighted in each of its annual
disclosures between FY13 and FY17, its actual costs in this area have exceeded
forecast:
30 Actual costs through PSE2 were as follows:
FY13 FY14 FY15 FY16
Marketing
$2.3m $1.8m $2.5m $4.9m
Expenditure ($m)
31 Hence as noted above, PSE3 forecasts have been assessed based on comparability
with actual costs incurred in PSE2.
DEMAND FORECAST COMPARED TO RECENT EXPERIENCE
32 The Commission asked for any available information on how passenger numbers
were turning out compared to the forecasts CIAL used in its PSE3 pricing decision.
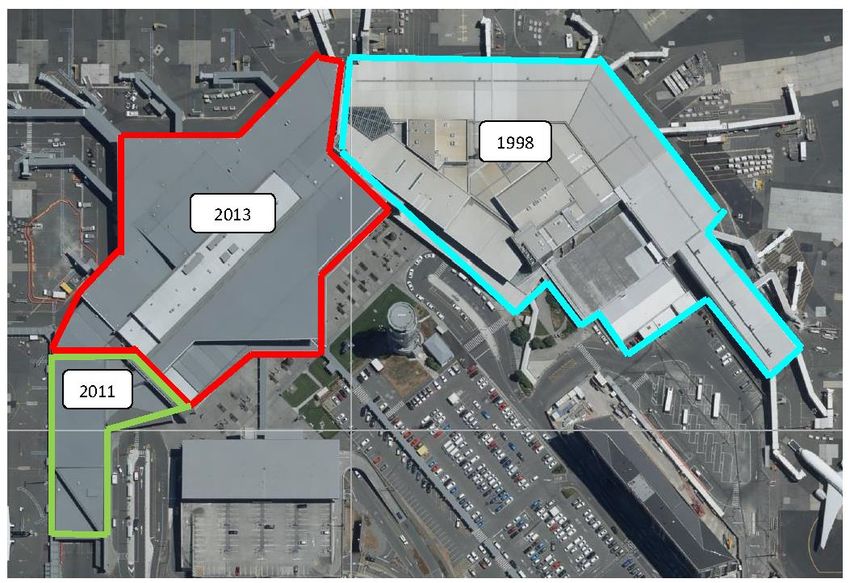
33 The table below shows our forecast compared to actual for FY17, and the current
picture for FY18 (ending 30 June) is also provided.
5(Note NB = narrow bodied; WB = wide bodied).
34 CIAL’s initial reactions to how its forecasts are comparing to out-turn results:
In FY17, the passenger numbers overall were only slightly higher than forecast,
although there was some differences within the subsets, (note domestic passengers
as forecast, international growth against forecast was on Tasman capacity with
Qantas which was mostly incentivised).
The current forecast for FY18 (determined using 10 months actual figures and 2
months forecast demand) is that passenger numbers will exceed the forecast by
2.8 per cent overall, and with material variances in some categories.
However, CIAL’s additional revenue will not move one-for-one with this additional
passenger growth because a portion of passenger growth (apart from domestic
regional) is subject to pricing incentives. The forecast 2.8 per cent variance in
FY18 is currently expected to generate an additional of revenue net of
incentives. CIAL explains this approach as follows:
— Firstly, for each category of passenger above forecast (i.e. regional, domestic &
international) – CIAL applied the standard published price per passenger
(“Published Price”) as outlined in its PSE3 disclosure to determine Gross Revenue;
— Then for each such passenger, and taking into account the current incentive
programs in place that roll across FY18, CIAL assessed whether the actual amount
that will be charged to that passenger is less than the Published Price;
— The actual increase in revenue to be billed (Net Revenue) is then calculated as
the Gross Revenue less any incentives i.e. what we actually bill the customers
rather than revenue based on Published Prices.
This exercise is performed on an airline customer by airline customer basis to reflect the
differing incentive arrangements in place.
6OPERATING EXPENDITURE FORECASTING
35 The Commission asked for information to better enable a comparison of opex
forecast trends across PSE2 and PSE3, in particular the treatment of general
marketing incentives.
36 As discussed above, CIAL undertakes two forms of market stimulation:
Direct expenditure on general marketing activities, covering aeronautical
development and marketing, including promotion of specific destinations and
routes, and general marketing of the airport itself, and
Bilateral arrangements with airlines that agree rebates (or similar) to encourage
the establishment of new services or capacity.
37 Only the cost of the first kind of activity are included in CIAL’s PSE3 pricing model
(as opex). Airline customers gave strong feedback that the cost of the second
activity should be excluded from the model. For PSE3 CIAL agreed to do so. The
same decision was made for the PSE2 pricing model.
38 In relation to CIAL’s annual PSE2 disclosures, there was a change in practice with
respect to the disclosure of pricing incentives (rebates) during PSE2. For FY13 and
14, these were treated as an offset to revenue and so not included in opex,
(although they were disclosed separately in the appropriate section of the
disclosure). For FY15 onwards, incentives were included in disclosure opex and
revenue is gross of incentives.
39 The figures for a consistent treatment of incentives across PSE2 and PSE3 are as
follows ($nom):
40 More generally, the opex forecasts used in CIAL’s PSE3 pricing model adopted its
business plan operating expenditure forecasts for FY18 and FY19, and then for the
remainder of PSE3 assumed:
a zero growth in quantity of inputs;
an average growth in input prices of CPI, except for rates (5.5% p.a. on advice of
the Christchurch City Council2) and wages (2.5% p.a. based on remuneration
advice obtained by CIAL and used for business planning
41 CIAL’s opex experience across PSE2 and PSE3 has reflected the following drivers:
42 Through FY14/15 the new ITP terminal came into full operational effect. Increasing
costs reflected operating the new bigger terminal and gaining experience with
terminal operations.
2
Christchurch City Council rates increased by an average of 5.48% for the 2018/19 year. The Long
Term Plan currently under consultation provides for annual increases of 5.72%, 5.5%, 5.0% and
4.5% for FY18/19, 19/20, 20/21 and 21/22.
743 Through FY16 and FY17 CIAL’s opex showed some cost efficiencies particularly in
respect to energy efficiency as CIAL explained in consultation.
44 FY17 opex was further reduced due to the CIAL Airport Fire Service manning the
autogates (rather than this service being performed by AvSec) and a reduction in
consulting costs relative to FY16, in particular costs associated with the District Plan
Review and regulatory IM review process.
45 So CIAL’s starting base for FY18 incorporated these efficiencies achieved over FY16
and FY17.
46 However CIAL does see a cost pick up in FY18, for the following reasons:
Maintenance – a move towards more proactive asset maintenance works and the
development of more detailed terminal and infrastructure asset management plans.
This will reduce the likelihood of increased maintenance in the future i.e. smoothing
out over next 5 -10 year period.
AvSec – costs dropped off in FY16/FY17 due to the CIAL Airport Fire Service
manning the autogates, but from FY18 onwards the manning of these gates has
reverted to AvSec, and so this cost has increased.
Heating costs – opex reduced over FY16/FY17 as result of efficiency initiatives, but
with the ability to extract further efficiencies being restricted (until technology
advances) CIAL anticipates an increase in the base cost of electricity per kwh and in
diesel costs.
Insurance – Total insurance costs dropped in FY16 and held for FY17 with premium
rates remaining constant under CIAL’s long term agreement. However as a
consequence of hardening in global insurance markets following the severe losses
incurred by insurers in those markets from the many significant natural
catastrophes during 2017, CIAL faces a premium increase of 5% for 2017/18, 7.5%
for 2018/9 and a nil increase for 2019/20. Also, a 40% increase in fire levies as a
result of a funding review for Fire and Emergency New Zealand hit in FY18.
Rates – increases continue broadly in line with original predictions for foreseeable
future in Christchurch based on Council Long Term Plan currently under
consultation
Staff costs – wage increases on average 2.5% to meet tight labour market for
necessary skills (based on expert remuneration advice used for business planning.
47 In PSE2 CIAL’s actual opex exceeded our forecast by around $21.7m or 14.9%.
Consistent with the allocation of risk in the building blocks model, CIAL incurred that
shortfall.
FORECAST TAX DEPRECIATION
48 The Commission asked for a forecast of tax depreciation for PSE3 across the total
RAB, and opening tax asset values as at the start of PSE3. While tax depreciation
forecasts were included in CIAL’s pricing model, it did not include information on the
derivation of tax depreciation for assets that were in place at the end of FY16. This
information has been provided in a further updated version of the pricing model that
CIAL has provided previously, which accompanies this note.
8TERMINAL RECONFIGURATION PROJECT UPDATE
49 The Commission asked for an update on our terminal reconfiguration project.
50 The context for this project is the out-workings of our Integrated Terminal
investment. In physical terms, the integrated terminal investment created a facility
that can operate as one flexible and integrated terminal by placing a new terminal
building and integrated check-in and baggage handling facilities in between an
existing regional lounge that is at times over-capacity and an international terminal
that is currently under-capacity. The terminal layout with the dates on which
construction of its component parts was completed is set out below.
51 Now that the investment is in place, the commercial challenge becomes using all the
terminal assets as productively as possible to give effect to that flexibility and
integration, rather than incurring substantial capex in one area when other parts of
the facility are under-utilised. CIAL’s terminal planning process looks ahead to how
passenger volumes might grow across regional, domestic and international routes,
and looks to maximise the use of the existing facilities. However to do that CIAL
needs to make physical changes (walls, security areas, passenger facilities) and that
requires a modest amount of capex.
52 CIAL’s PSE3 pricing model forecast some terminal reconfiguration capex to be
undertaken in FY20 (the third year of PSE3).
53 A Terminal Precinct Plan has been completed and a Terminal Activation Group
established. As part of the Terminal Precinct Plan and in conjunction with the fact
that congestion is starting to occur at bottle necks in the terminal at certain times
(early morning and evening), the Terminal Precinct Plan is being accelerated with
focus on creating a single route through the building with better way-finding and
less congestion. CIAL will engage with airlines on its more detailed plans in due
course.
954 CIAL remains confident the forecast terminal reconfiguration capex will occur:
possibly earlier than forecast, and
with a likely cost to be not less than forecast.
55 On performance in PSE3 to date (FY18), CIAL currently expects actual capex spend
to be materially in line with forecast, although it notes increasing costs in completing
some capital works in FY18, evidence by projects in respect of Gate 15 & 16 and
removal of Hangar 4 likely to cost more than forecast.
56 For the PSE2 period actual capex was $179m compared to forecast of $145m.
Further details are in CIAL’s annual disclosures.
BENCHMARKING THE IRR OF NON-PRICED SERVICES
57 CIAL provided an explanation of non-priced regulatory services, and the difficulties
of making an IRR assessment, in CIAL’s response to the Commission’s draft report
on AIAL’s PSE3 pricing decision.
58 For convenience CIAL repeats this below, and then follow with some information on
CIAL’s non-price arrangements.
Other regulated services, or non-pricing services, comprise leasing arrangements
negotiated with individual customers, rather than being priced under the AAA
consultation regime.
The Commission notes that such leases are entered into outside of the 5 yearly
regulatory pricing period, and at different target returns. The Commission has
asked for a more fulsome explanation as to why this dynamic is acceptable and
consistent with the purpose of Part 4.
CIAL’s circumstances are similar to AIAL in that:
All of CIAL’s non-priced services are provided under agreements negotiated
commercially with a single customer rather than subject to the consultation
regime under the AAA;
These are normally a lease over buildings and / or land, and often have a long
term;
The agreements do not map tidily onto the 5 year assessment period cycle
introduced by the IMs. They are entered into at different times and for different
lengths of time depending on the services being provided and the needs of CIAL
customers;
Expected returns under agreements could be higher or lower than for pricing
services, because the pricing methodologies are different. In PSE2, expected
returns under our agreements were lower than for pricing services. That has
reversed in the current period, and expected returns from non-priced services
are higher than for priced services.
When assessing these agreements, some relevant factors include:
10 the interest rate environment at the time of agreeing the terms (which impacts
assessments of appropriate target returns at the time the lease was entered
into);
processes used to set the agreement terms against market (e.g. valuer reports;
rent review mechanisms that align rents with market levels);
the voluntary nature of the arrangements;
in a number of instances there are alternative suppliers of land and buildings.
[As an example, NZ Police has recently vacated its premises in the terminal and
established a facility on land owned by a third party within the Special Airport
Zone.]
CIAL recognises that the Commission cannot ignore non-priced services when
assessing the outcomes across disclosure overall. On the other hand, there are
significant challenges to incorporate these services within a standard IRR
assessment. For example:
The returns from these services will get out of line with prevailing interest rates
in any Part 4 Pricing Event period. However using the priced services as a swing
factor to offset any surplus or deficit from leased services doesn’t seem practical.
It would distort prices and require major customers to accept the surplus or
deficit in any particular period. For that reason, the departure in any Pricing
Event period is likely to remain;
The non-priced services would justify a different benchmark to the one used by
the Commission to assess priced services. The term of the services are much
longer, and the interest rates at the time that contracts were negotiated will be
different;
The wider context for these services can be taken into account, such as the fact
that customers often have options (commercial alternatives, or to take the
services as regulated), and the methods negotiated to benchmark against
market prices.
For these reasons a higher level assessment of the approach of an airport to non-
priced services seems appropriate.
59 CIAL has reviewed its database of these arrangements. This analysis confirms some
of the advice that CIAL provided earlier in qualitative terms, that is:
the average term of the contracts is materially longer than the pricing periods
(between 16 and 26 years on average, depending on how customers’ options for
extension are treated);
the agreements are, on average, somewhat dated – with the average execution or
commencement date approximately 9 years prior to the commencement of PSE3;
Incenta’s preliminary estimates are that a risk free rate component of the WACC
that is consistent with the term of these agreements and the date they were
entered into is in the order of 2 percentage points higher than the rate CIAL applied
when resetting its prices. A copy of Incenta’s analysis is included as Appendix B. A
summary of CIAL’s non-pricing agreements is included as Appendix C.
11CIAL’S PRICING STRATEGY
60 The Commission asked for a table contrasting average prices in 2017 and 2018, as a
way of understanding the effect of the change in price structure. More generally we
discussed the rationale for the change and how that was incorporated into the
demand forecast process.
61 The table below uses published prices for FY18 from CIAL’s pricing disclosure
(adopting the smoothed pricing approach) and figures for FY17 from that year’s
annual information disclosure.
62 In the table, CIAL has:
62.1 broken down FY17 average charges from information disclosure between
regional and non-regional;
62.2 in terms of the FY17 terminal charge split between regional and non-regional,
updated this to reflect actual outcomes for FY17; and
62.3 provided an estimate of average price for domestic in FY18.
63 In addition, AirNZ pays an annual rental for the use of the Regional Lounge facility,
which together with outgoings/opex was $1.9m in 2017 and forecast to be $1.93m
in 2018. The effect of this charge in per passenger terms depends on the use of
that part of the terminal:
63.1 The charge in per passenger terms was $0.98/pax in 2017 and was forecast
to be $1.38/pax in 2018; however, a substantial part of this change is
attributed to the change in treatment of flights to and from Wellington.
63.2 If flights to and from Wellington had been served through the first floor
integrated terminal in 2017 in accordance with the Regional Lounge lease,
then the implied per passenger charge for use of the regional lounge would
have been $1.41/pax.
64 CIAL’s restructuring of prices for PSE3 was principally driven by commercial
considerations. However, the proposed changes were cross-checked from an
economic perspective. The key considerations and economics were:
Promoting the achievement of productivity gains – encouraging assets to be used in
a way that minimises forward-looking costs. In the previous price structure
international terminal charges were substantially higher, and yet this part of the
terminal has spare capacity. The new joint terminal charge is more consistent with
the plans for the terminal to become increasingly integrated / flexible. That is, CIAL
views the terminal as an asset where specific areas cannot be said to be associated
with any particular type of traffic, but rather as an asset that jointly provides all
12services and where any latent capacity is available to be deployed where it is most
needed;
Reducing CIAL’s risk exposure from airline’s decisions – recover sunk / fixed costs
in a manner that has least impact on the use of the airport, and avoids creating
perverse incentives for behavioural change. In the previous price structure airfield
charges per passenger were much higher for larger aircraft, disproportionate to the
cost impact, and the structure of check-in charges encouraged airlines to change
check-in practices, unrelated to cost. The new per passenger basis is likely to be
the least susceptible to providing perverse incentives;
Reducing complexity – creating conditions that are more conducive to the entry of
new airlines and the creation of new services / routes. Previous charges for an
airline bringing a passenger were a mixture of: aircraft weight (landing), fixed per
aircraft (landing), per seat (terminal), per hour (check-in). The new charging basis
– per passenger – is the simplest for airlines to understand and implement (and for
CIAL to market).
65 CIAL tested with its expert economic advisor the question raised during consultation
of ensuring the new price structure is subsidy free. This is a more complex issue
than was presented during consultation. Expert advice was that there are no
material concerns and that overall the new price structure significantly improves
incentives.
66 The new price structure attracted support from the majority of airline customers
with opposition from Air NZ during PSE3 consultation process. CIAL reflected on
competing feedback and introduced an even annual change to prices for regional
and international passengers from FY17 prices for each group, resulting in a single
price for domestic (non-regional) and international passengers by the end of PSE3.
67 The price structure put out to consultation, and the changes made as a result of
consultation, were advised to our independent demand forecast expert when
advising on the demand forecasts used in the PSE3 model. The assessment was
made by the independent expert that the new price structure did not materially
impact on the passenger demand forecast (the methodology CIAL’s independent
expert used in assessing the PSE3 price structure is set out in Appendix F). In
relation to the changes made as a result of strong feedback during consultation,
introducing a transition to the single per passenger charge for domestic (non-
regional) and international passengers, this was seen as an essential measure to
maintain the original demand forecast in light of airline feedback.
68 A practical example of the benefits of the new pricing structure is CIAL’s ability to
accommodate AirNZ’s likely operational requirement to switch from ATR to jet
aircraft on the CHC-WEL route for the period April – October 2018, involving an
estimated 150,000 passengers during this period. Under the previous pricing
structure, there would have been a perverse incentive against AirNZ switching from
ATR to Jet. That incentive has been removed.
69 Some further context is that, as shown in the table above comparing the effect of
the two price structures, as an overall assessment charges per passenger did not
change significantly – they went up for some sectors, and down for others. Hence,
an increase in revenue for price modelling purposes against the demand forecast
would only be expected if the price restructuring would be expected to raise demand
overall (i.e., prices increased for the least price responsive segments, and vice
versa) or that the pattern of demand moved from where CIAL’s charges are lower to
13where its charges are higher (noting that CIAL had corrected for a lot of this
potential, especially in airfield).
70 Prices went up for regional (albeit phased in), and for these passengers airport
charges are likely to be the largest share of airfares (meaning larger potential
demand response). But AirNZ has a monopoly on these routes and so it is difficult
to predict how much of these costs increases will be passed through. And in
domestic, for Wellington passengers previously on ATRs, there is a large cost
increase for AirNZ – but these passengers were previously getting charged by AirNZ
the same as if they were on jets.
71 Prices went down materially for international passengers. But airport charges are
likely to be a smaller share of their total ticket price. In addition, a fair proportion of
the international traffic has incentives applying, and so the yield to CIAL from any
induced demand is moderated. Moreover, where there are additional international
flights at the expense of domestic flights (i.e., direct rather than through the AIAL
hub) there is little effect on CIAL’s revenue.
72 More generally, the growth in passenger numbers that is possible from a change in
prices is dependent on airline capacity being introduced to support that growth, and
airline decisions to add or subtract capacity from a route, or commit to or withdraw
from a route altogether, are made in response to a wide range of factors that feed
into network planning. These factors include changes in aeronautical prices but they
also include forecast changes in operating costs, forecast demand conditions, the
opportunity costs of servicing one route in a domestic or international network over
another, and the importance of viewing the performance of a network as a whole.
For this reason CIAL approached its price structure with the intention of lowering the
likelihood of perverse incentives, rather than attempting to proactively incentivise a
particular outcome.
REGIONAL LOUNGE
73 The Commission asked for further information on CIAL’s Regional Lounge
arrangements. A summary of the arrangements is included in Appendix A. These
are commercially sensitive and for that reason the context of Appendix A is redacted
from the public version of this note.
OPERATING LEVERAGE
74 In light of the Commission’s statement that it will understandably want to be
consistent across airports, CIAL has asked Incenta to prepare advice on the
operating leverage indicators highlighted by the Commission. Incenta’s advice is
included in Appendix D.
UPDATED AIRPORT SERVICE QUALITY REPORTING
75 As an update on information previously provided to the Commission, we also include
the Airports Council International (ACI) Airport Service Quality (ASQ) report for CIAL
for Q1 2018 in Appendix E. Appendix E also includes ACI’s global ASQ barometer
report for Q1 2018. CIAL remains the highest ranked airport within the Australasian
airport data set for overall satisfaction with a rating of 4.36 which exceeds the global
overall satisfaction rating of 4.21.
14CONTEXTUAL ASSESSMENT UNDER PART 4
76 Finally, in its cross-submission on the AIAL draft report, CIAL highlighted some key
points regarding the contextual assessment required under Part 4, and CIAL’s
approach in PSE2 and PSE3 (which, to the long term benefit of its customers,
elected to make permanent, and not bring into PSE3, its under-recovery in PSE2,
and, through its choice of depreciation methodology, deferred recovery of $41.94m
allowable revenue (in NPV terms) in PSE3).
77 These points are relevant to the Commission’s PSE3 review for CIAL (and reflect
sections D2 and D3 of CIAL’s initial PSE3 pricing proposal and section G3 of CIAL’s
pricing disclosures). Accordingly, a copy of that cross-submission is attached as
Appendix G together with updated tables illustrating the difference between the
straight line and tilted annuity methodologies both for depreciation for all disclosure
assets and allowable revenue for pricing services.
15APPENDIX A: SUMMARY OF REGIONAL LOUNGE ARRANGEMENTS
Background The RLA was executed between Air NZ and CIAL to
resolve legal proceedings between the parties
including a declaratory judgement proceeding by
CIAL and a judicial review brought by Air NZ.
Those proceedings related to CIAL’s plans (from as
early as 2004) to build a new terminal at
Christchurch Airport to replace the domestic building
which was over 40 years old and to integrate more
fully with the International Terminal Building which
was completed in 1998. The dispute largely centred
on the development of a regional services facility
which CIAL wished to incorporate fully in those
plans to provide a more integrated service for its
customers. Air NZ took an opposite view.
Under the RLA Air NZ was responsible for the
Regional Lounge design which was to be compatible
with the balance of the Integrated Terminal. Air NZ
then entered into a building contract as authorised
agent for CIAL, who met the development costs.
The RLA was executed by the parties but the lease
attached to it remains unexecuted.
Purpose The Regional Lounge is to be used for the
embarking and disembarking of passengers to and
from regional airports being airports other than
Auckland and Wellington.
The Regional Lounge is predominantly used by Air
NZ however there is provision for other third party
regional operators to utilise the Regional Lounge
and a mechanism for determining the fee payable
by CIAL to Air NZ for that third party use.
The Annual Rent is fixed at $1.484m for the term of
Annual Rent the lease. That amount was determined by
reference to the Regional Lounge development costs
and an assumed WACC of 6.77%.
The annual rent is fixed for the term, is expressly
acknowledged as not a then current market rental,
and does not adjust by reference to passengers or
aircraft movements.
Term 20 years (no rights of renewal but Air NZ has a first
right of refusal)
Commencement Date [4 April 2011]
Expiry Date [3 April 2031]First Right of Refusal Air NZ has a first right of refusal if CIAL wishes to
lease the Regional Lounge to a third party upon
expiry of the lease.
Rent Reviews None
OPEX (a) Air NZ is responsible for all outgoings for the
Regional Lounge (and)
(b) CIAL is entitled to charge Air NZ, in
accordance with CIAL’s overall pricing
methodology, fair and reasonable charges
for the terminal services provided under ITP
for use by regional passengers in
conjunction with the Regional Lounge.
17APPENDIX B: INCENTA ANALYSIS – RISK FREE RATE ASSOCIATED WITH
CIAL’S NON-PRICED AGREEMENTSAPPENDIX C: INCENTA ADVICE – OPERATING LEVERAGE OF CIAL
APPENDIX D: ACI AIRPORT SERVICE QUALITY REPORTING
APPENDIX E: SUMMARY OF NON-PRICING AGREEMENTS
APPENDIX F: METHODOLOGY USED BY INDEPENDENT EXPERT IN
      ASSESSING PSE3 PRICE STRUCTURE AND ARRIVING AT RECOMMENDED
                            DEMAND FORECASTS

1   The methodology used by CIAL’s independent expert, 3 Consulting, in arriving at its
    recommended demand forecasts was described in the 3 Consulting Report attached
    as Annex 3 to the Initial Proposal for the Reset of Aeronautical Prices for the period
    1 July 2017 to 30 June 2022 (“Initial Proposal”) (previously provided to the
    Commission), and in subsequent consultation material.

2   In overview, 3 Consulting’s methodology was to use airline scheduling forecasts for
    the years they were available as the best evidence of likely volumes in the near
    term, and for the years beyond that to extrapolate forecasts based on macro
    variables. In practice that meant “bottom up” schedule-based forecasts for the first
    year of domestic demand and the first two years of international demand.

3   CIAL briefed 3 Consulting on the price structure proposed in its initial pricing
    proposal, and the change to the price structure proposed as a result of feedback
    received during consultation. 3 Consulting was aware of the change in price
    structure from that used by CIAL in PSE2, and aware of the size of the changes
    proposed during consultation.

4   The advice from 3 Consulting was that its recommended forecast demand did not
    change as a result of these changes to price structure. In part this was a function of
    the 3 Consulting methodology, which is driven first by airline scheduling and then by
    macro factors. In part this was also an exercise in expert judgment, that overall
    volumes would not be expected to be influenced by changes in price structure of this
    magnitude.

5   This advice accorded with CIAL’s commercial experience, and for that reason CIAL
    used the 3 Consulting advice during the consultation process.

6   CIAL’s commercial view during the consultation process was that it did not expect
    these changes to price structure to impact on overall demand levels. Airline
    decisions to add or subtract capacity on routes, or entire routes, are influenced by
    much more significant factors such as changes in operating costs, the opportunity
    costs of servicing one route in a domestic or international network over another, and
    the importance of viewing the performance of the network as a whole.

7   Where CIAL did have information the price structure would impact on expected
    demand – such as the feedback CIAL received from Air New Zealand during
    consultation on the potential impact of the proposed price structure on regional
    volumes – we changed our proposed price structure to ameliorate that.

8   Where price structure can come into play is in the incentives created for a given
    expected volume. The price structure was intended to remove incentives on airline
    customers to alter fleet mix in ways that did not reflect forward looking costs, and to
    put in place incentives (and remove barriers) to make more efficient use of the
    capacity in the full integrated terminal to minimise future capital expenditure
    requirements. In parallel, the price structure change was also intended to reduce
    CIAL’s financial exposure to decisions by airlines that change the way passengers
    arrive at Christchurch, which may be driven by factors that are completely
    independent of routes in or out of Christchurch (for example, capacity issues in
    relation to other routes).
9 CIAL didn’t expect or intend these to impact on overall demand, but on the way a
given level of demand used CIAL’s facilities. Rather, to the extent that CIAL
expected the new structure could cause a behavioural response, it was for the
airlines to bring the same passengers to Christchurch in a different manner (for
example, more Wellington passengers arriving jets and fewer by turbo-props, or
possibly more international passengers arriving directly into Christchurch rather than
via another New Zealand airport).
10 Under the price structure in place for PSE3, these types of behavioural responses
would be approximately neutral (noting the effect of the transitional tariff) to CIAL.
23APPENDIX G:
CIAL CROSS-SUBMISSION ON AIAL DRAFT REPORT
UPDATED TABLES ILLUSTRATING DIFFERENCE BETWEEN
DEPRECIATION METHODOLOGIES
24You can also read