Investor Presentation - 3Q 2020

Page created by Casey Lane
 
CONTINUE READING
Investor Presentation - 3Q 2020
Investor
Presentation
3Q 2020
Investor Presentation - 3Q 2020
Safe Harbor Statement
Certain statements in this presentation and the accompanying oral presentation, if any, relate to future results that are forward-looking statements as defined in the Private Securities Litigation Reform Act of 1995.
This presentation contains statements involving risks and uncertainties, including, but not limited to, statements relating to Limelight Networks’ market opportunity, solutions, services, and feature functionalities,
revenues, gross profit, earnings, adjusted EBITDA, capital expenditures, free cash flow, the anticipated impact on our business and our customers' businesses of the COVID-19 pandemic and future business
prospects. Actual results may differ materially, and reported results should not be considered as an indication of future performance. Factors that could cause actual results to differ are included in Limelight
Networks’ Annual Report on Form 10-K for the year ended December 31, 2019 and periodic reports on Form 10-Q for the quarters ended March 31, 2020 and June 30, 2020.

In addition, the statements in this presentation represent Limelight Networks' expectations as of today. We anticipate that subsequent events and developments may cause these expectations and beliefs to
change. However, while we may elect to update these forward-looking statements at some point in the future, we specifically disclaim any obligation to do so. These forward-looking statements should not be
relied upon as representing our expectations or beliefs as of any date subsequent to the date of this presentation.

In addition to Limelight Networks’ GAAP financial information, this presentation includes certain non-GAAP financial measures. The non-GAAP measures have limitations as analytical tools and you should not
consider them in isolation or as a substitute for the most directly comparable financial measures prepared in accordance with GAAP. There are a number of limitations related to the use of these non-GAAP financial
measures versus their nearest GAAP equivalents. Other companies, including companies in our industry, may calculate non-GAAP financial measures differently or may use other measures to evaluate their
performance, all of which could reduce the usefulness of our non-GAAP financial measures as tools for comparison. We urge you to review the reconciliation of our non-GAAP financial measures to the most directly
comparable GAAP financial measures set forth in Limelight Networks’ most recent Annual Report on Form 10-K on file with the Securities and Exchange Commission (the “SEC”) and our other filings with the SEC,
and not to rely on any single financial measure to evaluate our business.

This presentation also contains estimates and other statistical data made by independent parties and by Limelight Networks relating to market size and growth and other industry data. These data involve a number
of assumptions and limitations, and you are cautioned not to give undue weight to such estimates. Limelight Networks has not independently verified the statistical and other industry data generated by
independent parties and contained in this presentation and, accordingly, it cannot guarantee their accuracy or completeness. In addition, projections, assumptions and estimates of its future performance and the
future performance of the markets in which it competes are necessarily subject to a high degree of uncertainty and risk due to a variety of factors. These and other factors could cause results or outcomes to differ
materially from those expressed in the estimates made by the independent parties and by Limelight Networks.

                                                                                                                                                                                                           2
Investor Presentation - 3Q 2020
Limelight Management Team

                                                                                                                                           316
                                                                                                                                           years of
   Robert Lento            Sajid Malhotra                 Dan Boncel                    Michael DiSanto               Dan Carney
Chief Executive Officer   Chief Strategy Officer      Chief Financial Officer       Chief Administrative & Legal   Senior VP, Operations   collective
   37 years of exp.         35 years of exp.             23 years of exp.               Officer & Secretary           29 years of exp.
                                                                                          22 years of exp.                                 experience

  Thomas Marth             Christine Cross            Mike Palackdharry                  Kurt Silverman            Sandra Brisentine
   Senior VP, Sales         Senior VP, CMO         Senior VP, Strategic Solutions   Senior VP, Development &       VP, Human Resources
   35 years of exp.         26 years of exp.              35 years of exp.                   Delivery                 35 years of exp.
                                                                                         39 years of exp.

                                                                                                                                                        3
Investor Presentation - 3Q 2020
From Millions in Seconds to Billions in Milliseconds

                                                   9000M

                              90M         900M
                     9M

Population Reached

                                                                 Latency
                                                                           *Illustrative Purposes Only

                                                  90ms     9ms
                                          900ms

                             9000ms

          High Expectations for Quality
                  Viewing Experiences

                                                                                                         4
Investor Presentation - 3Q 2020
Connecting Content to Consumers

                                                    CDN
                                           (Content Delivery Network)
     A geographically distributed network of connected servers purpose built, to distribute content to end users

                                                                                                                   5
Investor Presentation - 3Q 2020
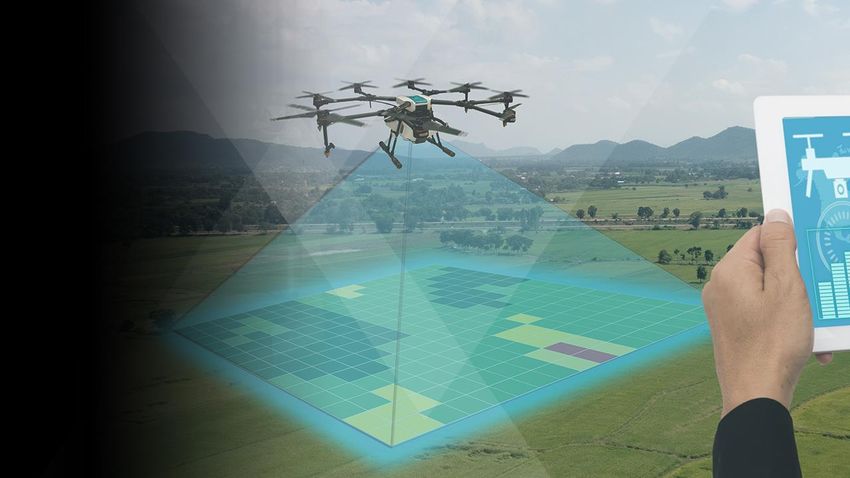
Limelight By the Numbers1

                                        >95% cache hit efficiency worldwide

                                        Revenue of over    $100K per customer, per
                                        quarter

                                        Over     1 billion objects purged in less
                                        than one second

                                        Backbone 8x the Earth’s
                                        circumference
                            1As   of June 30, 2020

                                                                                    6
Investor Presentation - 3Q 2020
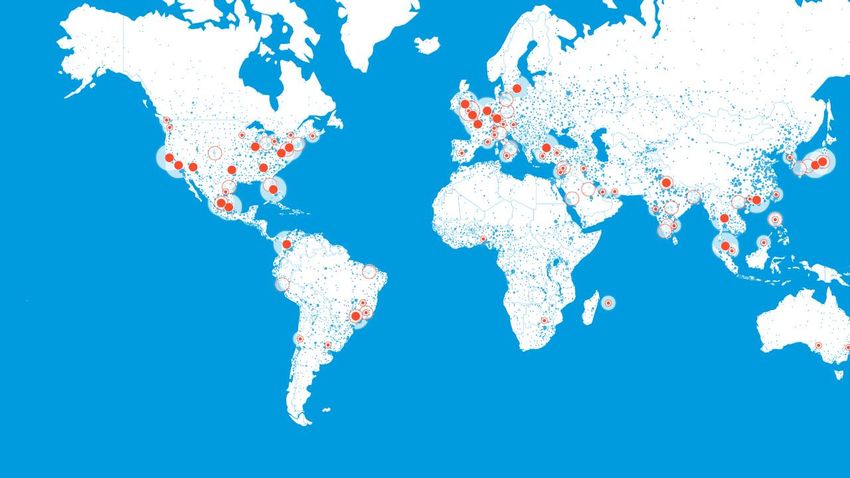
Limelight's Global Footprint: Coverage Growing with Demand

70+ Tbps
Egress Capacity

~120
Delivery Locations

1000+ ISPs
                                                      PoP             Planned PoP
Network Connections
                                                      Multiple PoPs   Population Density

                                                                                           7
Investor Presentation - 3Q 2020
Strategically Located Points
                 of Presence
                 +   Connectivity, storage, bandwidth, computing
The                  resources worldwide

Foundation       +   Densely configured, high capacity servers
of Our Network
                 +   Global private network with local presence

                 +   Managed by proprietary intelligent software

                                                                 8
Investor Presentation - 3Q 2020
Global Services
combine private
infrastructure,
intelligent software,
and expert support
                        PLATFORM OF
                         THE FUTURE

                                      9
Investor Presentation - 3Q 2020
Why We Win

                Working with Limelight, we’re able to create and deliver a broadcast quality experience low on
                buffering, low on start-up times, and high on picture quality. Limelight is a key supplier in our
                strategy and a partner in our success.

                      We had a great Limelight team before, during and after the implementation.
  It went so smoothly that we experienced not even a ripple; my boss didn’t even know when we
                                                                                    moved over.

                To improve our go-to learning app, we conducted extensive testing with multiple CDNs and
                chose Limelight because it had the lowest buffer rate by far.

                                                                                                                    10
COVID-19 Response/Developments
+   Activated Pandemic Response Plan

+   Adapted to Supply Chain and Operational
    Restrictions

+   Reached Out to Help ISPs Manage Traffic

+   24x7 Support to Customers Worldwide

+   Financial Growth and Increased Guidance

     $ Millions
                               $230-$240
       $220-$235

         Initial                Current

                                              11
Well positioned for future growth

             Edge network built to reduce latency and
Investment   deliver video

Highlights
             Customer-first business model

             Profitable financial profile

             Proven management team

                                                        12
Use Cases: Present to Future

      TODAY                    TOMORROW

                                          13
5.8
Global Video Traffic
Expected To

By 2024                                                                             4.6
                                                                           1.7

                                                   0.9
                                                                           1.3
               Millions of Petabytes               0.7

                                               2017                    2019        2024

Video Streaming as a % of Total               74%                      76%         80%

                                   Video Traffic         Rest of Traffic         Source: Omdia

                                                                                                 14
Edge Accelerating Revenue

                                                 $235*
                                   $201
                  $168

                                                         3.7

$ Millions

                   2016            2019          2020          Future

                            Base          Edge
* Guidance mid-point

                                                                        15
Global CDN Revenue by Region

                                                                 $6.9B
              $5.9B

  $3.7B
                                         $3.2B

                                                 $1.7B
                          $1.3B

  2019         2024        2019          2024    2019             2024
    North America                 EMEA                   APAC
                                                                Source: IDC

                                                                              16
Global Services
meet current and
future customer needs

                        PLATFORM OF
                         THE FUTURE

                                      17
We Connect People to the World Around Them

                                             18
Customer Net Promoter Score

             Traffic Delivered                       Support Tickets           Net Promoter Score

                                                                                        +84
                                                                                                    +84 pt
                                                                                                    Improvement in NPS
                                                                                                    Since 2013

                                                                                        -56%

            2014               2015              2016           2017        2018        2019
                                                                                                    -56%
                                                                                                    Drop in Support Tickets
   NPS
   Benchmarks

                          32
                      Average
                                                                 45    47             57            3X
                       NPS                                                                          Increase in Traffic
Source: Survey Monkey Global Benchmark Data, Customer Guru

                                                                                                                          19
Delivering Low-Latency Video, Exploring Edge Opportunities

                                                               Expand

2-Year Revenue CAGR                                      Awarded incremental
                                                         traffic through
from a Top Customer                                      best-in-class quality
                                   Adopt
                                                         We are now their CDN
                             Worked side-by-side         provider of choice
                             throughout process
                             ensuring smooth
       Land
                             execution and world-class
                             quality
  Dedicated focus to video
  delivery landed first
  contract

                                                                                 20
Establishes a higher run rate
$ Millions
             +37%                                             +28%
                                          +32%

             $60.1                        $57.0               $58.5
   $44.0                        $43.3               $45.9

  Q4 2018    Q4 2019            Q1 2019   Q1 2020   Q2 2019   Q2 2020

                                                                        21
In Year-over-year Adjusted EBITDA Margin1 Expansion

                                 19.0%                                                                                                                       16.6%

                                                                                             9.8%

         10.4%

                                                                                                                                        3.1%

                                                                     (1.4)%

        Q4 2018                 Q4 2019                              Q1 2019                 Q1 2020                                   Q2 2019                 Q2 2020
1 Adjusted EBITDA margin calculated as Adjusted EBITDA divided by total revenue. Adjusted EBITDA defined as U.S. GAAP net (loss) income add depreciation and amortization add
interest experience add interest and other (income) expense add share-based compensation. See slide 29 for non-GAAP reconciliation.

                                                                                                                                                                                22
The Immediate                          $20.1B
Opportunity is

                       $9.2B

                                       $15.1B

                       $6.3B

                       2019            2024

                 CDN      Edge Cloud   Source: IDC, Cisco

                                                            23
$80.00

                                                                                                        $70.00

In Footprint Growth                                                                     $57.2           $60.00
and Capabilities
                                     $46.1                                                              $50.00

                                                            $40.2
                                                                                         $34.7          $40.00

                                     $20.7
                                                            $16.1                                       $30.00

                                                                                                        $20.00

                                     $25.3                  $24.1                        $22.5          $10.00

                                                                                                        $0.00
                                      2017                  2018                          2019

                      Research & Development ($ Millions)           Capital Expenditures ($ Millions)

                                                                                                                 24
Strategy for

                                                               2019                                         2020 Guidance                                        Long Term Target

     Revenue Growth                                            2.5%                                                  17.1%                                                    15%

    Adj. EBITDA Margin1                                        9.0%                                                  13.4%                                                   >25%

        Capex as % of
                                                              17.3%                                                  11.7%                                                    10%
          Revenue

       Free Cash Flow
                                                              -8.3%                                                   1.7%                                                   >15%
          Margin2
1 Adjusted EBITDA margin calculated as Adjusted EBITDA divided by total revenue. Adjusted EBITDA defined as U.S. GAAP net (loss) income add depreciation and amortization add interest experience add
interest and other (income) expense add share-based compensation; refer to slide 28 for reconciliation.
2 Free Cash Flow defined as Adjusted EBITDA less Capex.

                                                                                                                                                                                                        25
Thank You
  info@llnw.com
  ir@llnw.com

  twitter.com/llnw

  linkedin.com/company/limelight-networks

  facebook.com/LimelightNetworks
Reconciliation of Non-GAAP Figures

                                                         Year Ended 31-Dec
$ Millions                             2017                    2018                  2019
U.S. GAAP Net (Loss) Income                   $(7,630)                   $9,842             $(16,044)

Depreciation and Amortization                  20,514                    18,590               20,065

Interest Expense                                   80                          86                    76

Interest and Other (Income) Expense             (946)                        (406)              (507)

Income Tax Expense                                426                         538                750

EBITDA                                        $12,444                   $28,650               $4,340

Settlement and Patent License Income                –                   (14,900)                      –

Share-Based Compensation                       12,744                    15,830               13,778

Litigation Expenses                             5,518                        2,907                    –

Adjusted EBITDA                               $30,706                   $32,487              $18,118

                                                                                                27
Reconciliation of Non-GAAP Figures (Cont’d)

$ Millions                             Q3 2018       Q4 2018       Q1 2019       Q2 2019       Q3 2019       Q4 2019       Q1 2020       Q2 2020
U.S. GAAP Net (Loss) Income               $(272)      $(5,193)      $(8,559)      $(7,192)      $(2,751)       $2,458       $(5,257)      $(1,727)

Depreciation and Amortization             4,377         4,417         4,562         4,755         5,133         5,616         5,491         5,683

Interest Expense                             10            10            10            10            10            45            10               71

Interest and Other (Income) Expense          69          (320)         (206)          (40)          (68)         (194)           85           306

Income Tax Expense                          113           190           124           255           166           206           176           136

EBITDA                                   $4,297         $(896)      $(4,069)      $(2,212)       $2,490        $8,131          $505        $4,469

Settlement and Patent License Income             –             -             -             -             -             -             -             -

Share-Based Compensation                  3,421         5,485         3,456         3,649         3,358         3,315         5,064         5,251

Litigation Expenses                          19                3             -             -             -             -             -             -

Adjusted EBITDA                          $7,737        $4,592         $(613)       $1,437        $5,848       $11,446        $5,569        $9,720

                                                                                                                                             28
ANALYST DAY
  SEPTEMBER 24, 2019
AGENDA

Welcome                 Sajid Malhotra, CFO
Limelight Opportunity   Bob Lento, CEO

Break

Accelerating Edge       Mike Palackdharry, SVP Strategic Initiatives
Sales Update            Tom Marth, SVP Sales
Financials              Sajid Malhotra, CFO
Q&A

Lunch

                                                                       30
SAFE HARBOR STATEMENT
Certain statements in this presentation and webcast relate to future results that are forward-looking
statements as defined in the Private Securities Litigation Reform Act of 1995. This presentation and
webcast contain statements involving risks and uncertainties, including statements relating to
Limelight Networks’ market opportunity, solutions, services, and feature functionalities, revenues,
gross profit, earnings, adjusted EBITDA, capital expenditures, free cash flow, and future business
prospects. Actual results may differ materially and reported results should not be considered as an
indication of future performance. Factors that could cause actual results to differ are included in the
Limelight Networks’ Annual Report on Form 10K and our periodic reports on Form 10Q.

In addition, the statements in this presentation and webcast represent Limelight Networks'
expectations as of today. We anticipate that subsequent events and developments may cause these
expectations and beliefs to change. However, while we may elect to update these forward-looking
statements at some point in the future, we specifically disclaim any obligation to do so. These
forward-looking statements should not be relied upon as representing our expectations or beliefs as
of any date subsequent to the date of this presentation and webcast.

.                                                                                                         31
LIMELIGHT
OPPORTUNITY
Bob Lento | CEO
VIDEO HAS BEEN THROUGH 3 MAJOR PHASES

                                1948
                                U.S. cable television is
                                introduced                           1972
                                                                     HBO founded as 1st                                                         2011                  2017
      1930                                                                                     1988                                             Amazon
                                         1954                        US pay-TV network;                                2006        2008                               YouTube TV
OTT PHASE: RAPID AND BROAD ADOPTION
 Penetration
      100%

                        12 years to reach 69%                                               Cable
       80%                 of US consumers
                             (still growing)
                    OTT
       60%                                                                                 60 years to reach
                                                                                           87% of US
       40%                                                                                 households
                                                                                           (now declining)

       20%

        0%
               0   10            20                  30                    40   50             60
                                                                                Years since launch
                                           Source: Fortune, Multichannel

                                                                                                               34
OTT PHASE: PROLIFERATION OF OFFERINGS
              Cumulative Number of OTT Platforms Launched

 250

 200

 150

 100

  50

   0
       2010        2012          2014                    2016      2018

                                  Source: KPMG, Parks Associates

                                                                          35
OTT PHASE: RAPIDLY GOING GLOBAL
GLOBAL OTT TV AND VIDEO REVENUE BY REGION

                      $24.4B

             $18.1B                                   $18.4B                $18.4B

                                         $9.2B
                                                                   $7.9B

              2016     2021                 2016         2021       2016      2021

             North America                     EMEA                        APAC

                                       Source: Broadband TV News

                                                                                     36
OTT PHASE: INCREASINGLY LIVE
LIVE INTERNET VIDEO TRAFFIC EXPECTED TO GROW 15-FOLD BETWEEN 2017 AND 2022

                                       73%
                                       CAGR

             2018                        2020                     2022
                                       Source: Cisco

                                                                             37
OTT PHASE: INCREASINGLY INTERACTIVE

       9-FOLD                   12-FOLD                             $60B+
    INCREASE IN INTERNET      INCREASE IN VR/AR                   SIZE OF GLOBAL
   GAMING TRAFFIC BY 2022       TRAFFIC BY 2022                  SPORTS BETTING
                                                                     MARKET

                            Source: Cisco, Sports Betting Dime

                                                                                   38
IMPLICATION: NEED TO REACH MORE, FASTER
                                           9000M

                                   900M
                     9M   90M

POPULATION REACHED

                                                     LATENCY

                                           90ms    9ms
                                   900ms

                          9000ms

                                                               39
WHAT’S NEEDED: A TRUE EDGE PLATFORM

                                     PERVASIVE
                                     • Security
                                     • Management and optimization
                    SERVICES
                                     • Service and support
           Content distribution •
          Service orchestration •
          APIs for user control •

                                     NETWORK
                                     • External: last mile connectivity
                                     • Internal: private backbone interconnection
               EDGE ASSETS
   Locations close to every user •
  Compute, networking, storage •

                                                                               40
WHAT’S POSSIBLE

GAMING AND
GAMBLING
We brought the theater into our homes.
How about a courtside seat in your
home, interacting in real-time –
watching multiple camera angles,
interacting with friends, switching
between games, betting on every play
and getting instantaneous settlements.

                                         41
WHAT’S POSSIBLE

MEDICAL
CARE
Transforming healthcare through
interactive 3D visualizations for surgical
planning, VR-enabled therapy and
rehab, visualize patient health
information in AR, connecting care
providers with remote patients, IoT
enabled hospital beds and real-time
data from wearables to monitor patient
health and well-being.

                                             42
WHAT’S POSSIBLE

CONNECTED &
AUTONOMOUS
VEHICLES
Self driving cars make accidents and
traffic jams a things of the past and
extend to other vehicles like drone
delivery. Autonomous vehicles will
revolutionize public transport, car
rentals, auto insurance, shipping and
commercial fleets and many others.

                                        43
WHAT’S POSSIBLE

AGRI-TECH

Make farming easier, more sustainable,
and more profitable using drone terrain
mapping, autonomous tractors, real-
time data collection and analysis.

                                          44
WHAT’S POSSIBLE

MILITARY &
DEFENSE
VR-enabled immersive training, IoT
enabled connected battlefields and
smart bases, smart lens delivering low
latency video from a robotic soldier to
central command, 5000 miles away.

                                          45
WHAT’S POSSIBLE

VIRTUAL
TOURISM
Visit any place, real or imaginary,
Bhutan or Middle Earth, ride a Bugatti or
TRex, in future or past with connected
VR and AR technology.

                                            46
THE IMMEDIATE OPPORTUNITY IS SIGNIFICANT

                                         $16.6B

                           >2x

                   $7.7B
      Edge Cloud

           CDN

                   2018                  2022
                           Source: IDC

                                                  47
OUR MISSION

     We are passionate about connecting people to the world around them.

 We remove the barriers that stand between our customers’ end users
and their entertainment, their news, their community, their educational resources.

    Our platform supports the highest quality user experience today and
 accelerates the next generation of real-time, interactive and immersive content.
 We position our customers’ content and applications right next to their end users
 at the network    edge for the most dynamic, real-time interactions no matter
                      where the end users live, work or play.

              We sweat the details, so our customers don’t have to.

                                                                                     48
WE ENABLE THE LEADING OTT PROVIDERS
From the early days…   …to now

                                      49
WE HAVE THE PLATFORM OF THE FUTURE

                                     PERVASIVE
                                     • Content and infrastructure security
                                       services
                                     • Management and optimization
                     SERVICES
                                     • Industry leading service and support
        The premier video CDN •
         Function-as-a-service •
          APIs for user control •
                                     NETWORK
                                     • Interconnected with >1,000 last mile
                                       networks
               EDGE ASSETS           • Private network connecting global
                                       locations
   100+ PoPs around the globe •
  Compute in multiple locations •
  Storage in regional and global •
                   architectures

                                                                              50
COMPETITORS ARE NOT OPTIMIZED FOR VIDEO

             CDNs                   Cloud Providers

        Most focused on web           Fewer, larger locations
      performance and security
                                  Focus on app development and
      Most not focused on video    centralized compute platform
         service innovation

                                                                  51
WE ARE FOCUSED TO WIN

   EXTEND             EXPAND                ENHANCE                 ENABLE
  CAPACITY           CONTROL               MANAGEMENT             INNOVATION

  right places,   fully API-configurable   via machine learning     live streaming,
   most peers                                    and AI           edge orchestration

                                                                                       52
SUMMARY

    Huge growth opportunity
    Aligned with Limelight platform
    Marquee customer base
    Differentiated from competition
$   Focused to win
ACCELERATING
EDGE
Mike Palackdharry | SVP Strategic Initiatives
MIKE PALACKDHARRY

                    •   Previously CEO of Aquiire, Inc.,
                        acquired by Coupa Software

                    •   20+ years of executive leadership
                        positions; emphasis on real-time
                        applications and disruptive B2B
                        technologies

                    •   SVP Strategic Solutions since
                        01/01/2019

                                                            55
OUR VISION FOR EDGE
      Enrich people’s lives by making information,
        knowledge and entertainment instantly
                   accessible to all

        The Limelight real-time distributed edge
                        platform

                                                     56
THE FOUNDATIONS OF THE LIMELIGHT EDGE

                                     PERVASIVE
                                     • Security
                                     • Management and optimization
                    SERVICES
                                     • Service and support
           Content distribution •
          Service orchestration •
          APIs for user control •

                                     NETWORK
                                     • External: last mile connectivity
                                     • Internal: private backbone interconnection
               EDGE ASSETS
   Locations close to every user •
  Compute, networking, storage •

                                                                               57
LIMELIGHT SPRINT TO THE EDGE
                                                                                                         Customer Responsibilities
Phase 1
Limelight Baseline Functionality                               2018    Network    Edge Co-               Edge      Advanced Real-Time
•   RTS and other IP developed                                         Services    location             Compute      Edge     Apps
•   Build out locations and capacity                                                                               Services
•   Launched Neustar as edge customer and partner
•   Signed Edge Gravity partnership for accelerated
    network advancement

Phase 2
Distributed Edge Cloud Buildout                                2019    Network    Edge Co-     Edge               Advanced   Real-Time
•   EG / LLNW execution                                                Services    location   Compute               Edge       Apps
•   Build compute infrastructure                                                                                  Services
•   Implement large global gaming customer
•   Implement live sports customer on global edge compute

Phase 3
Limelight Edge Service Applications                        2020-2021
and Management                                                         Network    Edge Co-     Edge     Advanced             Real-Time
•   Complete compute roll-out                                          Services    location   Compute     Edge                 Apps
•   Continue EG execution                                                                               Services
•   Introduce serverless compute (FaaS)
•   Advance Real-Time Application Suite and IP Portfolio

                                                                                                                                         58
FUTURE WITH THE LIMELIGHT EDGE
 Limelight Real-Time Distributed
         Edge Platform                               Use Cases
                                                        Gaming
     SERVICES
                                                       Gambling
     Process
     •   Analyze                                     Entertainment
     •   Rate & bill
     •   Notify
     •   Communicate
                                                          IOT

                                                        Medical
     Secure
     • Protect
                                                 Autonomous Vehicles
     • Predict
     • Isolate
                                                    Video Security
                                    +Many more
     Deliver
     •   Intelligent Distribution                Legacy IT Applications

                                                                          59
POTENTIAL OF AN ORCHESTRATED PLATFORM
ORCHESTRATED SERVICES PROVIDE FLEXIBILITY AND HIGH UTILITY
   Edge Services are applicable to many verticals.
   Orchestrated services drive customers to a desired outcome as they capture, hold and add value to data
    processed at the edge.
   Application of Process, Secure and Deliver dimensions varies.

          PROCESS                                PROCESS                               PROCESS

DELIVER                 SECURE       DELIVER                  SECURE       DELIVER                  SECURE

     VIDEO ADVERTISING                   AUTONOMOUS VEHICLES                           GAMING

                                                                                                             60
BUILDING AN EDGE SERVICES SET
GROWING PARTNER ECOSYSTEM FOR ACCELERATION AND DIFFERENTIATION

                                                                  HIGH VELOCITY

Partners provide expansion,
                                                    OTHER                             NEUSTAR
infrastructure and co-developed
                                                                  LIMELIGHT
applications for Edge Services                                    NETWORKS

                                                       APPLICATIONS          EDGE GRAVITY

                                                                                                61
LIMELIGHT + ERICSSON EDGE GRAVITY

 Expands capacity and Edge
    - Within service providers and closer to the edge
    - Access locations that were previously hard to reach

 Limelight reduced CapEx model

 Faster performance with caching in the
  last mile

 Private CDN for operators

 Service provider revenue share

                                                            62
LIMELIGHT + NEUSTAR

 10+Tbps DDoS mitigation capability

 Collaborating towards a real-time
  security application suite

                                       63
EXISTING EDGE SERVICES USE CASES

   Significant advancement in partner ecosystem and technology IP
   Examples of current edge use cases

Real-time simultaneous   Live quiz show deployed at     Enhanced live sports      Global console-less game
viewing and control of   edge for simultaneous player   viewing experience with   streaming, live content and
underwater drones for    performance and capabilities   synchronized data         VOD platform at the edge
research                 along with improved            distribution and cross-
                         performance on next            device playback
                         generation of streaming

                                                                                                                64
THE FUTURE WITH THE LIMELIGHT EDGE

              PAST                        PRESENT                          FUTURE

•   Infrastructure and partner   • Expand Real-Time Edge          • Delivering unprecedented and
    eco-system                     Platform and Services            patented platform capabilities
                                                                    for real-time events
•   Large targeted               • Deploy orchestration and API
    implementations                led services                   • Replacing applications with
                                                                    edge applications
•   IP and patent portfolio      • Accelerate penetration of
                                   existing customer base         • Leading the world in distributed
                                                                    edge services

                                                                                                       65
SALES UPDATE

Tom Marth | SVP Sales
TOM MARTH
             Led teams for 13 years
             Enterprise Tech & ERP
             Primavera in Americas

               6 years at Workday
               Pre-IPO
               Growth: $134M to $2.5B
               Market Cap: $650M to $24B

             SVP Sales since 1/1/2019
             Culture; timing is exciting
             Make an impact and drive
              consistent growth

                                            67
LEADERSHIP PHILOSOPHY

    ACCOUNTABILITY               COLLABORATION         CONTINUOUS LEARNING

  Customer Focus               Customer Focus          Customer Focus
  • Prepare                    • Transparency with     • Question
  • Plan your work               leadership            • Listen Learn
  • Work your plan             • Communicate           • Be a student
  • Discipline                 • Team selling          • Best practices

                     SENSE OF URGENCY AND PASSION!

                        We are helping to change the

                                                                             68
NEAR-TERM PRIORITIES

       ADD        REDUCE   ACQUIRE DESIRABLE
    HEADCOUNT     CHURN         LOGOS

                                               69
DESIRED OUTCOME

 IMPROVE    INCREASE   STRENGTHEN   ACCELERATE
 PIPELINE   SHARE OF      CORE      MOMENTUM
             WALLET                  ON EDGE

                                                 70
FINANCIALS

Sajid Malhotra| CFO
FINANCIAL SUMMARY

                                               $
               ATTRACTIVE                   MULTIPLE
  IMPROVING                 POSITIONED TO
               FINANCIAL                    EXPANSION
 PERFORMANCE                    LEAD
                 MODEL                      POTENTIAL

                                                        72
PERFORMANCE HAS BEEN IMPROVING

   REVENUE PROGRESSION                            GROSS PROFIT/MARGIN                                   ADJUSTED EBITDA
$ Millions                                    $ Millions           47.6%              47.8%    $ Millions

                                     $195.7                                           $93.5                                          $32.5
                    $184.4                         42.4%                                                           $30.7
                                                                     $87.8
      $168.2                                                                           $17.9
                                     $44.0                                                                                            $4.6
                    $48.2                            $71.3           $23.0                           $22.8          $8.7
       $43.8
                                                                                                                                      $7.7
                                     $49.3            $19.7                            $24.0
                    $46.1                                            $22.3                             $7.5
       $39.5                                                                                                        $7.4
                                                      $16.2                                                                          $9.2
                                     $50.2                                            $24.8
                                                                                                       $5.1
       $43.6        $45.4                                            $21.4
                                                                                                                   $7.9
                                                     $18.8
                                                                                                      $6.2
                                     $52.1                                            $26.7                                          $11.0
       $41.4        $44.7                                            $21.2                                         $6.7
                                                     $16.6
                                                                                                      $4.0

       2016         2017             2018            2016            2017             2018           2016          2017              2018
               Q1   Q2     Q3   Q4                            Q1     Q2     Q3   Q4                           Q1   Q2      Q3   Q4

                                                                                                                                             73
OPERATIONAL PERFORMANCE

        >90%                     >120%
      YoY increase in total    YoY increase in average
            capacity               server capacity

           83+                      50%
      Point increase in Net    YoY increase in number
   Promoter Score since 2013     of POPs worldwide

                                                         74
LEADING CUSTOMER SATISFACTION
                      NPS Benchmarks                                       LLNW NPS vs. Support Tickets
LLNW matches up favorably against other tech brands:           Support
                                                               Tickets
                      57                         57                                         +83
                      45                         45

                      29                         -7
                                                           Net
                                                           Promoter
 LLNW exceeds top range for streaming media industry:                                              -64%
                                                           Score

                 24            39       49

              Low NPS         Avg.    High NPS
                                                        2013        2014       2015       2016      2017   2018

Source: Temkin Group, Customer Guru

                                                                                                                  75
KEY HEADLINES

“   Limelight Sets Record for
      a Single Purge of 1.1
    Billion Objects Globally in
                                   “    Limelight Wins IABM
                                          BaM™ Award for
                                       Breakthrough Realtime
                                                                   “    Limelight Expands
                                                                       Developer Toolkit With
                                                                        New API and Portal
          Under a Second                 Streaming Service                Enhancements

      “                           ”“                       ”                                ”
         Limelight and
          Ericsson to
       Accelerate Content
       Delivery and Edge
                                        Limelight Named a
                                           Leader in IDC
                                       MarketScape Report on
                                        Worldwide Content
                                                                   “   Limelight Opens 100th
                                                                       Point-of-Presence and
                                                                          Increases Global
                                                                        Capacity 40 Percent

                                                                                           ”
        Cloud Adoption                   Delivery Networks

                        ”                                      ”                                76
2019 PERFORMANCE – TALE OF TWO HALVES
                                                Analyst
$ millions, except per share data
                                    Actual    Expectations            2H2019 Growth
                                    1H 2019    2H 2019       Sequential               YoY

           Revenue                   $89         $109           22%                   17%

         GAAP EPS                   -$0.14       $0.01         107%               120%

      Non-GAAP EPS                  -$0.08       $0.06         175%               100%

     Adjusted EBITDA                 $0.8         $18          2,150%                 46%

    Capital Expenditure              $16          $10          -38%                   -2%

                                                                                            77
ANALYST VIEWS

      “                                                      “
                                              1H2019                                                        1H2018

 Reported Mixed 2Q, Cuts Annual Guide as Growth              Reports Solid 1Q Beat, Quality Over Quantity Strategy
 Initiatives are Pushed Out; Lowering Estimates, PT from     Paying Off; Increasing Estimates, PT; Reiterate Buy – B.
 $4.90 to $2.90; Maintain Buy – B. Riley                     Riley

 Another Soft Quarter; Are Numbers Low Enough? – D.A.        SOLID 1Q18 RESULTS; HITTING ON ALL CYLINDERS –
 Davidson & Co.                                              Cowen

 Soft 2Q Results, 2019 Guide Lowered; Reiterate Market       LLNW 1Q18 Earnings: Turnaround Momentum Evidenced
 Perform – Raymond James                                     by Historic Quarter, Raising PT to $6.50 – Oppenheimer

 DISAPPOINTING 1Q19 RESULTS; MAINTAINED 2019                 Delivering Content for Customers, Results for Investors –
 GUIDANCE – Cowen                                            D.A. Davidson & Co.

 LLNW 1Q19: Weak Quarter, Management Highly Confident        Fourth consecutive quarter of double digit growth – JMP
 in Strategy Though – Oppenheimer                            Securities

 Weak Quarter Likely To Throw Many Off The Scent.            As Limelight's quality of service has improved, we believe
 Valuation Implies Death, Yet Sequential Results Over Next   they have become increasingly competitive in this segment
 Several Quarters Likely To Be Among, If Not The Best, In    of the market, driving a mix shift to higher priced traffic that
 Company History. Maintaining BUY Rating – Craig-Hallum      benefitted average company pricing (ASPs) this quarter –

                                                                                                                          ”
                                                             Raymond James

                                                                                                                                78
PATH TO LONG TERM TARGETS
                        2012     2018     LONG TERM TARGET

  Revenue Growth        5.2%      6.1%            15%

    Gross Margin        38.0%     47.8%           55%

 Non GAAP Income
                        -12.2%    7.0%           >10%
      Margin

 Adj. EBITDA Margin     5.5%      16.6%          >25%

   Capex as % of
                        10.2%     8.2%            10%
     Revenue

Free Cash Flow Margin   -3.3%     8.4%           >15%

                                                             79
LONG TERM TARGETS: REVENUE GROWTH
                        2012                         2018                     LONG TERM TARGET

  Revenue Growth        5.2%                           6.1%                           15%

    Gross Margin        38.0%    KEY DRIVERS:          47.8%                          55%

 Non GAAP Income                 • Base business at 8-9% growth
                        -12.2%                           7.0%                        >10%
      Margin                     • New initiatives driving remaining growth

 Adj. EBITDA Margin     5.5%                           16.6%                         >25%

   Capex as % of
                        10.2%                          8.2%                           10%
     Revenue

Free Cash Flow Margin   -3.3%                          8.4%                          >15%

                                                                                                 80
LONG TERM TARGETS: GROSS MARGIN
                        2012                         2018                LONG TERM TARGET

  Revenue Growth        5.2%                            6.1%                     15%

    Gross Margin        38.0%                          47.8%                     55%

 Non GAAP Income                 KEY DRIVERS:
                        -12.2%                          7.0%                    >10%
      Margin
                                 • Better mix of business
 Adj. EBITDA Margin     5.5%     • Increased utilization 16.6%
                                                         with scale             >25%
                                 • Improving cost profile & efficiency
   Capex as % of
                        10.2%                           8.2%                     10%
     Revenue

Free Cash Flow Margin   -3.3%                           8.4%                    >15%

                                                                                            81
LONG TERM TARGETS: NON GAAP INCOME AND
ADJUSTED EBITDA MARGINS
                        2012                        2018                 LONG TERM TARGET
                          KEY DRIVERS:
  Revenue Growth         5.2%                           6.1%                     15%
                          • Strong revenue growth
                          • Disciplined increase in COGS expense
    Gross Margin        38.0%                          47.8%                     55%
                          • Effective management of operating expenses

 Non GAAP Income
                        -12.2%                         7.0%                     >10%
      Margin

 Adj. EBITDA Margin     5.5%                          16.6%                     >25%

   Capex as % of
                        10.2%                          8.2%                      10%
     Revenue

Free Cash Flow Margin   -3.3%                          8.4%                     >15%

                                                                                            82
LONG TERM TARGETS: CAPEX AND FCF MARGIN
                         2012                       2018               LONG TERM TARGET

  Revenue Growth        5.2%                          6.1%                     15%

    Gross Margin        38.0%                         47.8%                    55%

 Non GAAP Income          KEY DRIVERS:
                        -12.2%                          7.0%                  >10%
      Margin
                          • R&D efficiency reducing Capex dependence
                          • Strong revenue growth
 Adj. EBITDA Margin      5.5%                          16.6%                  >25%
                          • Leverage in business model

   Capex as % of
                        10.2%                         8.2%                     10%
     Revenue

Free Cash Flow Margin   -3.3%                         8.4%                    >15%

                                                                                          83
GLOBAL REVENUE MIX, LOW CURRENCY EXPOSURE

    Americas                EMEA                          APAC
   61% of revenue     16% of revenue                 23% of revenue
                    (8% non-USD currency)           (8% non-USD currency)

                    Note: Based on 1H2019 revenue

                                                                            84
STRONG BASE OF ENTERPRISE CUSTOMERS
                                                ENTERPRISE CUSTOMERS                                                   QUARTERLY AVG. REVENUE PER
                                                REVENUE AS % OF TOTAL                                                          CUSTOMER
                                                                                                                                                           $73k
                                                                            92%
                                                           86%

       ENTERPRISE
      CUSTOMERS AS
       % OF TOTAL
                                                                                                                                          $28k

                          24%
          16%

     Competitor          LLNW                          Competitor          LLNW                                                       Competitor          LLNW
        A                                                 A                                                                              A
Note: Enterprise customers are defined as customers with revenue in excess of $100,000 over the previous 12-month period. Excludes customers that termed within the reporting quarter.
Sourced from 2Q2019 disclosures.

                                                                                                                                                                                  85
TARGETS COMPARE FAVORABLY WITH PEERS
                                                                                                                                  COMPETITOR A                                                  COMPETITOR B

                                                             2019E                           2021E                          2019E                           2021E                         2019E                 2021E

Revenue                                                        $198                            $241                           $193                            $322                        $2,860                $3,241
  YoY Growth                                                      1%                              9%                           33%                             29%                             5%                  6%

Gross Profit                                                     $86                        $139                              $109                         $204                           $1,890                $2,141
 Margin Improvement 2019 vs 2021                                                       +1,500 bps                                                       +600 bps                                                 +0 bps

Implied Opex                                                     $87                           $119                           $148                            $228                        $1,071                $1,160
  Opex Increase 2019 vs 2021                                                                   +$32                                                           +$80                                               +$89

Adj. EBITDA(1)                                                   $18                             $45                         ($23)                             ($3)                       $1,185                $1,409
  2019-21 Cumulative Adj EBITDA                                                                  $93                                                          ($51)                                             $3,891

FCF                                                            ($14)                             $17                         ($55)                            ($49)                         $483                 $800
  2019-21 Cumulative FCF                                                                         $10                                                         ($169)                                             $1,985

  Source: Financials based on Wall Street research estimates as of September 18, 2019.
  Note:   Dollars in millions.
  (1)     Limelight adjusted EBITDA adjusted for stock-based compensation. Competitor A adjusted EBITDA includes adjustments for stock-based compensation and other income/loss. Competitor B adjusted EBITDA
          include adjustments for stock-based compensation, one time charges and legal / stockholder matter costs.

                                                                                                                                                                                                                          86
MULTIPLE BELOW PEER GROUPS
              Revenue Multiple vs. Growth                                                                                                 Revenue Multiple vs. Growth + Margin
 14.0x                                                                                                                           14.0x

 12.0x                                                                                                                           12.0x

 10.0x                                                                                                                           10.0x

  8.0x                                                                                           Core Peers(1)
                                                                                                                                  8.0x
                                                                                                 Proxy Peers(2)

  6.0x                                                                                           LLNW
                                                                                                                                  6.0x

  4.0x                                                                                                                            4.0x

  2.0x                                                                                                                            2.0x

  0.0x                                                                                                                            0.0x
         0%         10%          20%          30%          40%           50%          60%                                                0%         10%          20%        30%   40%   50%   60%

 Source: Factset as of September 18, 2019. Financials based on Wall Street research consensus estimates.
 (1)     Core Peers include Akamai, Brightcove, Fastly.
 (2)     Proxy Peers include Carbonite, Boingo, Care.com, Channeladvisor, Digi, Five9, Glu Mobile, Internap, LivePerson, Mobileiron, Model N, QAD, QuinStreet and Tucows.

                                                                                                                                                                                                    87
ACCELERATING REVENUE GROWTH
                                             1Q2019    2Q2019    3Q2019 (1)   4Q2019 (1)
     Revenue:
      LLNW                                   $43.28    $45.90     $49.89       $58.79
      Competitor A                           $45.56    $46.17      $48.1       $53.17
      Competitor B                           $706.51   $705.07    $701.25      $746.96

      Sequential Revenue Growth:
       LLNW                                   -2%        6%          9%         18%
       Competitor A                           12%        1%          4%         11%
       Competitor B                           -1%        0%         -1%         7%

      YoY Revenue Growth:
       LLNW                                   -17%      -9%        1%           34%
       Competitor A                            40%      34%        31%          30%
       Competitor B                             6%       6%        5%           5%
Note: Dollars in millions
(1)   Represents analyst consensus amounts

                                                                                           88
FINANCIAL SUMMARY

                                               $
               ATTRACTIVE                   MULTIPLE
  IMPROVING                 POSITIONED TO
               FINANCIAL                    EXPANSION
 PERFORMANCE                    LEAD
                 MODEL                      POTENTIAL

                                                        89
LIMELIGHT OFFERS
  A UNIQUE OPPORTUNITY
IN AN ATTRACTIVE INDUSTRY

        Q&A
info@llnw.com

twitter.com/llnw

linkedin.com/company/limelight-networks

facebook.com/LimelightNetworks

                                          91
APPENDIX: NON-GAAP INCOME RECONCILIATION
                                                                             LLNW           COMPETITOR A        COMPETITOR B
                                                                         1Q2019 2Q2019      1Q2019 2Q2019      1Q2019 2Q2019

GAAP Net Income/Loss                                                     (8.56)    (7.19)     (9.73) (15.59)    107.13    113.92
Adjustments:
   Stock-based Comp                                                         3.46    3.65       1.47     2.24     45.31     48.14
   Interest Expense - acceleration of deferred debt costs due to early
   repayment                                                                                      -     1.79
   Other Expense - mark-to-market warrant liability                                            0.71     1.70
   Amortization of acquired Intangible Assets                                                                     9.60      9.65
   Amortization of Capitalized stock-based comp and capitalized
   interest exp                                                                                                   9.23      8.05
   Restructuring Charge                                                                                           6.39      0.79
   Acquisition-related Costs                                                                                      0.45      0.52
   Transformation Costs                                                                                           4.19      1.34
   Amortization of debt discount and issuance costs                                                              11.62      8.01
   (Gain) Loss on Investments                                                                                    (0.69)     0.25
   Income tax-effect of above non-GAAP adjustments and certain
   discrete tax items                                                                                           (12.30)   (14.45)

Non-GAAP Net Income/Loss                                                 (5.10)    (3.54)     (7.55) (9.86)     180.92    176.21

                                                                                                                                92
You can also read