Automotive - Summer 2020 - INDUSTRY INSIGHTS - Duff & Phelps
←
→
Page content transcription
If your browser does not render page correctly, please read the page content below

INDUSTRY INSIGHTS

Automotive – Summer 2020

Industry Insights: Automotive – Summer 2020

                                                                                     2020 BY
Highlights                                                                        THE NUMBERS
The automotive industry slowed considerably in the first half of 2020 as
COVID-19 decimated economies and eroded consumer confidence
worldwide. As plants shut their doors and auto manufacturers and suppliers
trimmed costs wherever possible, the auto industry suffered meaningfully.
While the fallout of the virus remains to be seen, hope for a quick rebound       Global light vehicle sales decreased by 32.0%
waned as expectations for long-term consumer spending, especially on              in H1 2020 compared to H1 2019.1
durable goods, including automobiles, dimmed.1

Global light vehicle sales declined 32.0% in H1 2020 relative to the same
period in 2019 as COVID-19 depressed the market throughout the first
quarter. In the U.S., light vehicle sales declined 24.0% year-over-year to 6.5     For H1 2020, China’s auto sales plummeted
million units in the half.2 In June 2020, U.S. light vehicle sales remained low    17.1%, with 9.9 million units sold.1,4
at 13.1 million units at a seasonally adjusted annual rate (SAAR), up slightly
from the 11.4 million mark in March 2020.3

Interest rates on consumer installment loans for new automobiles were              In June 2020, U.S. light vehicle SAAR was
5.13% in May 2020 in the U.S., down from 5.29% in February 2020 and
                                                                                   13.1 million units, considerably down from the
5.35% in May 2019, as the Fed’s rate cuts began filtering through the
                                                                                   17.2 million mark in June 2019.2
economy.4

In H1 2020, auto sales in China declined 17.1%, compared to the same
period in 2019. New energy vehicles suffered with a greater impact,
                                                                                   New passenger registrations decreased by
contracting 56.4% year-over-year.5
                                                                                   26.5% in Europe in Q1 2020, driven by
In Europe, decreases in new passenger registrations occurred throughout Q1         declines in all three months year-over-year.6
2020 which culminating in a 26.5% decline in the YTD March 2020 period
relative to the same period ending March 31, 2020.6                                Duff & Phelps’ market-weighted indices of
                                                                                   Automotive OEMs and Dealers decreased
M&A activity in the automotive sector experienced a significant decrease in        12.7% and 0.5% respectively, while
the first half of 2020 compared to the final quarters of 2019. Deal count in Q1    Automotive Aftermarket Parts and Repair and
2020 consisted of 8 deals and Q2 2020 had 6 closed transactions, decreases         Suppliers are up 4.6% and 2.1% respectively
from 13 and 21 in Q1 and Q2 2019, respectively. It appears COVID-19 has            since the beginning of 2020.7
impacted automotive M&A volume as upwards of 20 transactions were
completed in each of Q2, Q3 and Q4 2019.7                                          U.S. electric vehicle (EV) sales reached a
                                                                                   2.5% market share in March 2020.8 EVs in
Public company equity performance in the Automotive Original Equipment             China reached a 5.7% market share at month-
Manufacturer (OEM), Dealer, Aftermarket and Supplier sectors all trended           end March 2020.9
downward in the first quarter of 2020 with modest upticks in the second
quarter.7
                                                                                                                                    2
See page 21 for data sources.
Industry Insights: Automotive – Summer 2020

Table of Contents

4       Automotive Industry – H1 in Review        20 Duff & Phelps’ Recent Transactions

8       Automotive Landscape by Geography         21 Sources

11      Public Companies’ Trading Statistics      22   About Duff & Phelps

17      M&A Activity by Quarter

                                                                                          3
Industry Insights: Automotive – Summer 2020

Summer 2020:                                                COVID-19 Halts Global Sales while Uncertainty Looms
                                                           Q1 2020 began normally for all regions of the world except for China, where COVID-19 has

Global Auto                                                impacted sales since January. In March, sales across every other region of the world flattened due
                                                           to the effects of COVID-19, with no indications of a rebound in sight.10

Sales Trends                                               EU and U.S. year-over-year declines were 39.7% and 24.0%, respectively, while China, despite
                                                           battling the virus since the start of the year, was hit 17.1%.These depressed sales trends will likely
                                                           continue throughout 2020, with analyst estimates indicating a 20% fall of global light vehicle
                                                           production for the full year to 71 million vehicles, levels not seen in over 10 years.10 Slower sales
                                                           are expected to be driven by U.S. markets as high inventories and spikes in COVID-19 continue to
                                                           impact consumer spending sentiment and overall economic performance.11
                                                           Despite these numbers, experts still forecast the gradual transition from fossil fuel to electric
                                                           vehicles to continue without much hindrance. The International Energy Agency predicts roughly the
                                                           same number of electric vehicles sold in 2020 as were sold in 2019. With this level of sales in 2020,
                                                           analysts project 10 million electric cars on the roads by year end. In a widely declining market, flat
                                                           year-over-year sales would represent a great success and positions the overall industry for positive
                                                           long-term growth.12

  H1 2020 Global Vehicle Sales                                                                        H1 2020 Global Best-Selling Brands (% of Global Market Share)

                100.0                                         93.9 95.3 94.8 97.8
                                                  88.3 89.7
                                        82.1 85.6                                       2020E          1.          Toyota Group                                                                12.8%
                        75.0 78.2                                                        71.0
                 75.0
                                                                                                                    Volkswagen
                                                                                                       2.                                                                                      10.9%
                                                                                                                      Group
     Millions

                 50.0
                                                                                       35.7                       Renault Nissan
                                                                                                       3.                                                                                       9.1%
                                                                                                                     Alliance
                 25.0
                                                                                                                  Hyundai Motor
                                                                                                       4.                                                                                       8.3%
                                                                                                                     Group
                  0.0
                        2010 2011 2012 2013 2014 2015 2016 2017 2018 2019               Q2
                                                                                                       5.         General Motors                                                                8.2%
                                                                                       2020

Source: Global Market Trends. Focus2Move. July 15, 2020.                                                                                    Source: Global Market Trends. Focus2Move. July 7, 2020.
                                                                                                   All trademarks, trade names, or logos referenced herein are the property of their respective owners.   4
Industry Insights: Automotive – Summer 2020

Summer 2020:                                                 New Developments in the $50 Billion Merger
                                                            In December 2019, Fiat Chrysler Automobiles NV and Peugeot S.A. agreed to a $50 billion merger

Fiat Chrysler /                                             of equals. The combined company would be the fourth largest auto maker in the world, selling 8.7
                                                            million vehicles per year. As part of the pending deal, Fiat Chrysler would pay a €5.5 billion special
                                                            dividend to its investors, and both companies would each pay a €1.1 billion ordinary dividend to
Peugeot Merger                                              their shareholders in 2019.13
                                                            As the COVID-19 pandemic affected the automotive market, some terms of the initial deal have
Update                                                      changed. In mid-May, both companies announced that they were cancelling the €1.1 billion
                                                            ordinary dividend to be paid to each company’s shareholders. Fiat Chrysler is still expected to pay
                                                            the €5.5 billion special dividend to its shareholders. While the dividends were canceled, the
                                                            companies communicated that the deal is still on track to close in early 2021.14
                                                            In June 2020, the European Commission (EC) launched an in-depth investigation into the merger,
                                                            after the companies failed to address initial anti-trust concerns put forward by the EC. Specifically,
                                                            the EC is worried the merger would reduce competition in the light commercial vehicles market.
                                                            The companies released a joint statement reiterating: “the substantial benefits of the proposed
                                                            merger to our customers, the European industry and each company”. A decision is anticipated to
                                                            come from the EC on October 20, 2020.15

  Fiat Chrysler and Peugeot Stock Data – June 24, 2019 to June 22, 2020                          Fiat Chrysler and Peugeot Fast Facts

    30.0%
    20.0%
    10.0%
     0.0%
   -10.0%
   -20.0%                                                                                        Headquarters                         London, UK                             Rueil-Malmaison, France
                                                                                       -30.47%
   -30.0%
   -40.0%
                                                                                       -35.34%   2019 Revenues                         €108 billion                                     €75 billion
   -50.0%
   -60.0%
                                                                                                                                                                          France- 56%
                                                                                                 Geographic               North America- 68%
                                                                                                                                                                          Rest of Europe- 23%
                                                                                                 Segments                 Other- 32%
                                                                                                                                                                          Other- 21%

                 Fiat Chrysler Automobiles N.V. (BIT:FCA)   Peugeot S.A. (ENXTPA:UG)             Select Brands

Source: CapIQ.                                                                                                                                           Sources: CapIQ, FCA and PSA company websites
                                                                                                         All trademarks, trade names, or logos referenced herein are the property of their respective owners.   5
Industry Insights: Automotive – Summer 2020

Summer 2020:                                                                 Sales and Production Stalls Invoke Fear Among Suppliers
                                                                           The impact of the economic shutdown and the ensuant stop on production of durable consumer

Automotive                                                                 goods, including vehicles, spread quickly throughout the global supply chain. In the automotive
                                                                           supplier and parts market, experts predict waves of COVID-19-related bankruptcy filings towards the
                                                                           latter half of 2020. At the outset of the year, during what can be referred to as normal-course
Supply Chain                                                               operations, bankruptcy likelihoods stood around 5% for the industry, generally on par with 2019
                                                                           levels. As soon as COVID-19 began to spread globally in mid-March, probabilities of Chapter 11
                                                                           filings rose to near-2008 levels at 20%.16
                                                                           With thousands of jobs hanging in the balance, industry lobbyists estimate a need for $20 to $25
                                                                           billion of cash influxes to avoid widespread layoffs and bankruptcies. While auto manufacturers
                                                                           stockpiled cash having learned a valuable lesson from the 2008 recession, supply chain businesses
                                                                           began to see cash inflows cease as ordering halted and Paycheck Protection Program (PPP) loans
                                                                           ran dry.17
                                                                           As production facilities try to reopen across the globe, parts shortages are being realized. Assembly
                                                                           plants require a reboot from throughout the production line as inventory backlogs and WIP are
                                                                           limited.17 General Motors stopped production on March 18, planning for a restart of operations by the
                                                                           end of the month; a delay that extended well into May. Such stoppages posed meaningful threats to
                                                                           small supplier businesses that remain in the balance awaiting economic improvement or
                                                                           government-provided stimulus.18
  Automobile Parts and Equipment Suppliers 1-Year Probability of Default (%)                                         Auto Supplier Survey – COVID-19 Impact (March 27, 2020)

                                                                                                                                                  No Business
                                                                                                                                                    Impact
                                                                                                                                                     20%
                                                                                                                                                                                Limited
                                                                                                                              Severe
                                                                                                                                                                               Business
                                                                                                                             Business
                                                                                                                                                                                Impact
                                                                                                                              Impact
                                                                                                                                                                                 46%
                                                                                                                                9%
                                                                                                                                                      Moderate
                                                                                                                                                      Business
                                                                                                                                                       Impact
                                                                                                                                                        25%

Source: “Auto Suppliers see Spike in Probability of Default During COVID-19 Pandemic.” S&P Global. April 30, 2020.    Source: “COVID-19 Pandemic Impact on Automotive Suppliers.” HIS Markit. March 27, 2020.
                                                                                                                                                                                                                6
Industry Insights: Automotive – Summer 2020

Summer 2020:                                     Impact on Recognizable, International Brands
                                                Driven by the economic stoppage and ensuing impact on supply chains, many OEMs, parts and

Automotive                                      component businesses have been downgraded by ratings agencies or have filed for bankruptcy.
                                                Immediately after plants closed, S&P, Fitch and Moody’s all placed major auto manufacturers under
                                                credit watch. Ford was downgraded to official “junk” status of BB+ by S&P on March 25.19 This was
Bankruptcies                                    followed shortly by a Moody’s announcement that 25 U.S. auto and commercial vehicle parts
                                                suppliers were placed under review for potential downgrade.20 Among the list of beleaguered

and Downgrades                                  suppliers, Tenneco and subsidiary Federal-Mogul were downgraded shortly afterwards by Fitch.21
                                                Two significant bankruptcies were filed in May, despite some modest reopening activities in the U.S.
                                                and worldwide. Techniplas, a Wisconsin-based auto supplier and innovator with nearly $500 million
                                                in sales, filed for Chapter 11 after a deal with a potential PE suitor fell through.22 In a highly
                                                publicized filing, Hertz declared bankruptcy on May 22 after weeks of speculation. With upwards of
                                                $24 billion of debt and only $1 billion of cash, the company was unable to find additional funding
                                                sources, laying off 12,000 and scrambling to try and sell unissued shares to a public market
                                                unusually enticed by the bankruptcy as the stock has remained heavily traded post-bankruptcy.23
                                                Later filings and outlook declines include APC Automotive Technologies, who relinquished ownership
                                                to lender Apollo Global Management.24 Publicly-listed Jason Industries filed as part of a restructuring
                                                agreement.25 Faurecia’s outlook was downgraded to ‘Negative’ by Fitch, citing two to three years of
                                                cash flow issues forecasted due to an overall slowdown in auto production.26
Representative Notable Bankruptcy Filings and Credit Downgrades

                    Downgraded to BB+                               Chapter 11 Filed                                                 Chapter 11 Filed
                    March 25, 2020                                  May 8, 2020                                                      June 3, 2020

                    Downgraded to A1                                Downgraded to B                                                  Chapter 11 Filed
                    March 26, 2020                                  May 13, 2020                                                     June 8, 2020

                   Downgraded to B+                                 Chapter 11 Filed                                                 Revised Outlook to “Negative”
                   April 30, 2020                                   May 22, 2020                                                     June 12, 2020

                                                                                                                                        Sources: Company Filings, Capital IQ, Bloomberg
                                                                                       All trademarks, trade names, or logos referenced herein are the property of their respective owners.   7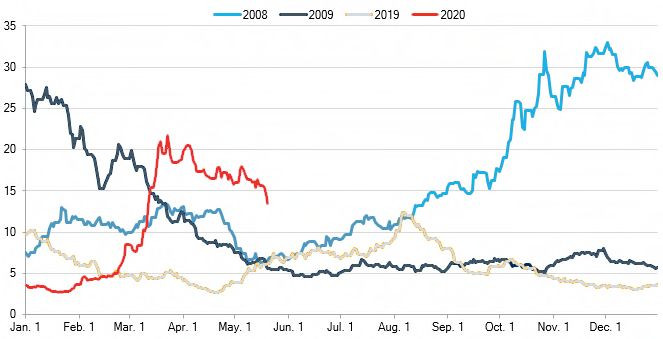
Industry Insights: Automotive – Summer 2020

North American                                                          Sharp Decline in Car Sales Amid COVID-19 Pandemic
                                                                      H1 2020 showed a weak start to the year for North American auto sales, particularly in the U.S.

Auto Sales                                                            Compared to H1 2019, U.S. light vehicle sales declined 24.0%.27 Current sales trends indicate
                                                                      North Americans continue to buy pickup trucks and SUVs over sedans and hatchbacks, as
                                                                      evidenced by seven of the top ten best-selling vehicles for the quarter in this category. Even though
Trends                                                                sales declined 5.5% the Toyota Camry was the sixth best-selling vehicle, and remained the top-
                                                                      selling sedan in America for the 17th straight year.28
                                                                      Sales declined steeply through the first half, as the Seasonally Adjusted Annual Rate (SAAR) of
                                                                      vehicle sales in H1 was 13.0 million vehicles, down from over 17 million in full year 2019, despite
                                                                      relatively strong car sales in January and February. As dealerships shut down amid the COVID-19
                                                                      pandemic and states issued various stay-at-home orders, March SAAR fell to 11.9 million, the
                                                                      lowest level since the Great Recession, a mark that rebounded slightly through June 2020, up to
                                                                      13.1 million units.29
                                                                      Year-over-year production for the YTD period ending in June 2020 declined 43.0%, driven primarily
                                                                      by near-zero production in April 2020. As a result of the pandemic, many automakers have
                                                                      completely shuttered production plants and furloughed workers as uncertainty hangs over the
                                                                      economy. In Mexico, where much production resides, serious declines and stoppages in production
                                                                      throughout the first half of the year look to translate into limited supply levels for the foreseeable
                                                                      future.30
  Q1 2020 North American Vehicle Sales                                                                          H1 2020 U.S. Best-Selling Vehicles (Units)

                20.0
                                                                 17.5 17.5 17.2 17.3 17.1                        1.          Ford F-Series                                                             367,387
                                                       16.5
                                              15.6
                                     14.5
                15.0          12.8                                                                                              Chevrolet
                       11.6                                                                                      2.                                                                                    267,166
                                                                                                                                Silverado
     Millions

                10.0
                                                                                                 6.5             3.            Ram Pickup                                                              246,253

                 5.0
                                                                                                                 4.           Toyota RAV4                                                              183,360
                 0.0
                       2010 2011 2012 2013 2014 2015 2016 2017 2018 2019 2020                                    5.           Honda CR-V                                                               138,898
                                                                          Q2

Source: “US Automotive Brand Sales by Quarter.” GoodCarBadCar. June 2, 2020                                                                 Source: Best-Selling Cars of 2020… So Far. autoNXT. July 3, 2020.
                                                                                                             All trademarks, trade names, or logos referenced herein are the property of their respective owners.   8
Industry Insights: Automotive – Summer 2020

Chinese                                                            China’s auto sales in Q1 2020 suffered one of the worst periods in history.2,5 Sales volume for
                                                                   the first three months of the year was significantly lower over the same period in 2019, a quarter
                                                                   that was already historically low. In addition to a slowing auto market, China was severely
Automotive                                                         impacted by the COVID-19 crisis, particularly in February, as dealerships remained closed and
                                                                   the Chinese New Year holiday was extended. Despite the early slow in sales, Q2 proved to be

Landscape                                                          strong for Chinese auto sales with monthly increases reported for each month in the quarter.31
                                                                   Production of automobiles in China stalled due to the crisis as well, only restarting at the end of
                                                                   the quarter as overall economic output in the country increased to near-normal levels.32 Due to
                                                                   the extended production pause and inevitable economic dip to follow, analysts estimate that
                                                                   overall auto production will dip around 11.5% for the full year. To compensate this drop, 2021 is
                                                                   expected to be a major rebound year, with early estimates indicating a 7.5% pickup from 2020.33
                                                                   China has continued to pump billions of government investment into electric vehicles to match
                                                                   the increasing popularity of the vehicles. However, as Tesla has made a push into the market,
                                                                   regional producers have suffered. NIO, Tesla’s largest regional competitor, has been beset with
                                                                   problems and has cut jobs as revenue slips. With overall quality in question, consumers tend to
                                                                   lean towards the consistent and reliable option.34
    Monthly Auto Sales

           3.0                                                                                                                                                                                      30%
                                                                     16.5%
                                                                                11.9%                                                                                                               20%
                                                           5.7%
           2.5                                                                                                                                                                       0.7%           10%
                                                                                               -4.3%                                              -7.7%            -7.5%
                                           -10.2%                               -11.6%                         -11.6%           -10.1%                                                              0%
                    -15.8%     -15.2%                     -16.5%     -18.1%
           2.0                                                                                                                                                                                      -10%
Millions

                                                                                                                                                                                                    -20%
           1.5                                                                                                                                                                                      -30%
                    -20.7%                 -44.3%
                                                                                                                                                                                                    -40%
           1.0                                                                                                                                                                                      -50%
                                                                                                                                                                                                    -60%
           0.5                 -80.7%                                                                                                                                                               -70%
                                                                                                                                                                                                    -80%
           0.0                                                                                                                                                                                      -90%
                      Jan        Feb      Mar               Apr      May       Jun        Jul                    Aug      Sep        Oct                            Nov              Dec
                 2018 Sales       2019 Sales              2020 Sales     2019 Y o Y Sales Growth                    2020 Y o Y Sales Growth

                                                                                        Sources: China Association of Automobile Manufacturers; “China Light Vehicle Sales Update.” LMC Automotive Public Data.   9
Industry Insights: Automotive – Summer 2020
European New passenger vehicle registrations in Europe suffered throughout H1 2020, with significant
declines recorded in each month of the half. New registrations decreased 24.3% in June YoY
to 1.1 million, a decline from the 1.5 million recorded in June 2019. Overall, H1 2020
Automotive passenger vehicle registrations in the EU dipped 39.7% compared to Q1 2019, with the
decrease led by shrinkage in Spain (-50.9%), Portugal (-49.6%) and the UK (-48.5%), three of
Landscape the nations hit hardest by COVID-19. Through the first half of 2020, none of the 27 countries
showed new passenger vehicle registration growth over Q1 2019, with the majority
experiencing declines greater than 30%.6
The U.S. political landscape impacted the European markets in the first half of the year as well
as the U.S. administration threatened to levy tariffs on EU auto imports if a new trade deal
cannot be reached. While the pandemic stalled any potential tariffs, the threat continues to
loom, awaiting a restart of the global economy.35 At the turn of the year, the UK still has to work
through Brexit negotiations with no progress towards an auto deal. The major overlap in
production in sales between the UK and the rest of the EU complicates a deal as negotiators
New Passenger Vehicle Registrations try to work through the current environment.36
1.6 10.0
1.45
1.40
1.30 8.19
8.0
1.2 1.10
Millions
6.0
Millions
4.94
0.8
0.60
4.0
0.4
0.28
2.0
0.0
0.0
2019 2020 2019 2020 2019 2020
2019 2020
April May June
Note: Europe is defined as the European Union Source: “Passenger Car Registrations: -38.1% in First Half of 2020; -22.3% in June.” European Automobile
Source: “Passenger Car Registrations: -38.1% in First Half of 2020; -22.3% in June.” European Automobile Manufacturers Association. July 16, 2020
Manufacturers Association. July 16, 2020 10Industry Insights: Automotive – Summer 2020
Public Company Over the past 12 months, all indices posted a decline, with both Automotive Dealers (-9.7%) and
Automotive OEMs (-21.2%) declining more than the S&P 500 (-6.2%). Automotive Aftermarket
Parts and Repair performed the best, only contracting 4.8% while Automotive Suppliers fell 5.1%.7
Equity All indexes experienced significant volatility and visible troughs through the first half of 2020 due to
COVID-19. Despite the initial crash, each group rebounded slightly through the end of H1 with
Performance Automotive Aftermarket Parts and Repair up 4.6% for the year, ahead of the overall S&P 500’s
performance, up 3.4%. Automotive Suppliers also increased by 2.1% while Automotive Dealers
slipped slightly, down 0.5%. However, Automotive OEMs continue to suffer, they are down 12.7%
since the start of the year.7
LTM June 2020 Equity-Market Performance Q2 2020 Equity-Market Performance
10%
30%
20% 0%
4.6%
3.4%
10% (4.8%) 2.1%
-10%
(5.1%)
0% (0.5%)
(6.2%)
(9.7%) -20% (12.7%)
-10%
(21.2%)
-20% -30%
-30%
-40%
-40%
-50%
-50%
-60% -60%
Jul Aug Sep Oct Nov Dec Jan Feb Mar Apr May Jun Jan '20 Feb '20Mar '20 Apr '20 May '20 Jun '20
'19 '19 '19 '19 '19 '19 '20 '20 '20 '20 '20 '20
S&P 500 Automotive Dealers Automotive Suppliers Automotive Aftermarket Parts and Repair Automotive OEMs
Note: Represents most actively traded public automotive sector companies
Source: S&P Global Market Intelligence as of June 30, 2020. 11Industry Insights: Automotive – Summer 2020
Public Companies’
Trading Statistics
($ in millions, except per-share data)
Stock Price as a
6/30/20 % of % Change Enterprise Value as a Multiple of Multiple of LTM
Stock 52-Wk from Market Enterprise Revenue EBITDA LTM 2020 EBITDA Revenue
Company Price High 12/31/19 Capitalization Value LTM 2020E 2021E LTM 2020E 2021E EPS EPS Margin Growth
Automotive OEMs
North American OEMs
Fiat Chrysler Automobiles N.V. $10.07 60.5% (32.2)% $15,785 $18,532 0.16x 0.19x 0.17x 1.8x 3.2x 1.7x NA NM 8.8% (4.5)%
Ford Motor Company $6.08 57.6% (34.6)% $24,180 $8,258 0.06x 0.07x 0.06x 0.8x 9.6x 0.9x NM NM 7.9% (5.0)%
General Motors Company $25.30 60.4% (30.9)% $36,206 $98,311 0.82x 0.83x 0.74x 7.0x 13.0x 8.9x 4.5x 45.2x 11.7% (7.7)%
Tesla Inc. $1,079.81 99.3% 158.1% $200,166 $232,275 8.93x 8.66x 6.38x NM NM NM NA 292.2x 11.7% NM
Asian OEMs
Faw Car Co. Ltd. $1.52 90.4% 7.7% $7,008 $3,381 0.90x 0.40x 0.42x NM 9.1x 6.7x NM NM -2.1% (45.1)%
Geely Automobile Holdings Limited $1.57 73.9% (19.9)% $15,446 $12,259 0.89x 0.90x 0.79x 9.8x 7.0x 5.6x 12.7x 12.6x 9.1% (8.6)%
Honda Motor Co. Ltd. $25.56 84.6% (11.1)% $44,133 $80,175 0.67x 0.68x 0.59x 5.2x 11.9x 7.3x 6.2x 18.1x 12.8% (8.3)%
Hyundai Motor Company $81.45 68.8% (18.9)% $17,356 $48,019 0.60x 0.57x 0.52x 8.8x 8.0x 6.5x NM 10.0x 6.8% 7.9%
Nissan Motor Co. Ltd. $3.70 50.6% (37.2)% $14,486 NM NM NM NM NM NM NM NA NM 12.1% (16.7)%
SAIC Motor Corporation Limited $2.41 61.8% (28.8)% $28,099 $23,190 0.22x 0.21x 0.20x 8.1x 5.3x 3.7x 13.8x 8.9x 2.7% (13.6)%
Suzuki Motor Corporation $33.92 68.0% (19.9)% $16,464 $15,487 0.48x 0.55x 0.47x 3.4x 8.3x 4.8x 6.9x 48.6x 14.1% (9.9)%
Tata Motors Limited $1.30 48.7% (46.9)% $4,288 $12,890 0.38x 0.38x 0.35x -80.2x 4.1x 3.0x NA 29.4x -0.5% (14.1)%
Toyota Motor Corporation $62.73 84.3% (12.3)% $173,508 $41,631 0.16x 0.18x 0.15x 1.3x 2.0x 1.6x 13.2x 19.0x 12.3% (1.6)%
European OEMs
BMW AG $63.94 73.7% (22.3)% $41,268 $94,225 1.14x 0.91x 0.83x 12.2x 8.8x 7.2x NA 15.8x 9.3% 6.8%
Daimler AG $40.68 66.3% (26.8)% $43,517 $9,471 NM NM NM 3.3x 1.0x NM NM 38.9x 1.8% (0.0)%
Peugeot S.A. $16.30 53.5% (32.0)% $14,582 $6,913 0.08x 0.10x 0.09x 0.8x 1.0x 0.8x 3.8x 12.3x 10.3% 0.7%
Renault SA $25.41 38.9% (46.5)% $6,841 NM NM NM NM NM NM NM NM NM 7.6% (3.8)%
Volkswagen AG $151.86 71.9% (23.4)% $78,901 $17,689 NM NM NM NM NM NM 3.9x 15.8x 16.3% 0.2%
Median 67.2% (25.1)% 0.54x 0.48x 0.44x 3.4x 7.5x 4.8x 6.5x 18.1x 9.2% (5.0)%
Mean 67.4% (15.4)% 1.11x 1.05x 0.84x -1.4x 6.6x 4.5x 8.1x 43.6x 8.5% (7.2)%
Note: Represents most actively traded public automotive companies; EBITDA and Enterprise Value adjusted for pension liabilities; Enterprise Value adjusted for noncontrolling interests, equity investments and financial services segments.
For definitions, See page 15. 12
Source: S&P Global Market Intelligence as of June 30, 2020 and company filings.Industry Insights: Automotive – Summer 2020
Public Companies’
Trading Statistics
($ in millions, except per-share data)
Stock Price as a
6/30/20 % of % Change Enterprise Value as a Multiple of Multiple of LTM
Stock 52-Wk from Market Enterprise Revenue EBITDA LTM 2020 EBITDA Revenue
Company Price High 12/31/19 Capitalization Value LTM 2020E 2021E LTM 2020E 2021E EPS EPS Margin Growth
Automotive Suppliers
Adient plc $16.42 56.1% (22.7)% $1,541 $3,906 0.25x 0.32x 0.27x 6.6x 7.4x 4.2x NA NM 3.8% (8.4)%
Aisin Seiki Co. Ltd. $29.13 68.6% (22.9)% $7,850 $14,653 0.42x 0.48x 0.42x 4.5x 7.5x 4.2x 17.3x NM 9.3% (6.4)%
American Axle & Manufacturing Holdings Inc. $7.60 59.7% (29.4)% $859 $4,001 0.65x 0.89x 0.75x 4.3x 7.9x 5.3x NA NM 15.1% (13.7)%
Aptiv PLC $77.92 78.7% (18.0)% $21,040 $23,304 1.66x 1.96x 1.60x 11.6x 17.3x 10.3x 19.1x 78.7x 14.4% (2.6)%
Autoliv Inc. $64.51 74.1% (23.6)% $5,633 $7,259 0.88x 1.04x 0.87x 5.6x 9.6x 6.3x 9.2x 22.4x 15.7% (4.6)%
BorgWarner Inc. $35.30 75.8% (18.6)% $7,317 $8,573 0.87x 1.07x 0.87x 5.4x 8.3x 5.9x 10.7x 20.2x 16.1% (4.2)%
Continental AG $98.09 65.5% (25.0)% $19,618 $24,424 0.50x NA NA 2.5x NA NA NA NA 19.7% (2.6)%
Cooper-Standard Holdings Inc. $13.25 26.1% (60.0)% $224 $782 0.27x 0.33x 0.28x 5.7x 108.5x 4.7x NA NM 4.7% (18.4)%
Dana Incorporated $12.19 60.8% (33.0)% $1,761 $3,864 0.46x 0.59x 0.50x 4.3x 7.1x 4.8x NA 34.8x 10.6% 2.6%
DENSO Corporation $39.01 81.3% (15.3)% $30,225 $30,052 0.63x 0.71x 0.63x 8.6x 8.3x 5.4x 43.9x 22.2x 7.3% (3.9)%
Faurecia S.A. $39.13 65.6% (27.6)% $5,356 $8,296 0.41x 0.50x 0.43x 4.2x 5.0x 3.4x 6.3x 46.4x 9.8% (1.8)%
Lear Corporation $109.02 76.0% (20.5)% $6,532 $8,199 0.43x 0.52x 0.43x 4.9x 8.7x 5.2x 8.0x 41.1x 8.7% (7.1)%
Magna International Inc. $44.45 80.3% (15.1)% $13,268 $14,238 0.38x 0.48x 0.40x 3.9x 6.3x 4.3x 8.3x 29.3x 9.8% (7.7)%
Schaeffler AG $7.51 63.4% (30.7)% $4,999 $7,681 0.48x 0.54x 0.49x 3.5x 4.9x 3.5x NA 22.2x 13.7% (1.6)%
The Goodyear Tire & Rubber Company $8.95 52.0% (42.5)% $2,081 $7,616 0.54x 0.63x 0.57x 6.2x 15.0x 5.3x NA NM 8.7% (6.8)%
Valeo SA $26.29 63.1% (25.6)% $6,284 $10,724 0.49x 0.57x 0.49x 3.8x 5.7x 4.0x 8.1x NM 12.8% 1.8%
Visteon Corporation $68.50 64.6% (20.9)% $1,906 $2,123 0.74x 0.85x 0.67x 11.1x 17.3x 8.1x NA NM 6.7% (1.9)%
Median 65.5% (23.6)% 0.49x 0.58x 0.49x 4.9x 8.1x 5.0x 9.2x 29.3x 9.8% (4.2)%
Mean 65.4% (26.6)% 0.59x 0.72x 0.60x 5.7x 15.3x 5.3x 14.5x 35.3x 11.0% (5.1)%
Note: Represents most actively traded public automotive suppliers.
For definitions, See page 15. 13
Source: S&P Global Market Intelligence as of June 30, 2020 and company filings.Industry Insights: Automotive – Summer 2020
Public Companies’
Trading Statistics
($ in millions, except per-share data)
Stock Price as a
6/30/20 % of % Change Enterprise Value as a Multiple of Multiple of LTM
Stock 52-Wk from Market Enterprise Revenue EBITDA LTM 2020 EBITDA Revenue
Company Price High 12/31/19 Capitalization Value LTM 2020E 2021E LTM 2020E 2021E EPS EPS Margin Growth
Automotive Dealers
Asbury Automotive Group Inc. $77.33 62.6% (30.8)% $1,492 $2,446 0.34x 0.39x 0.36x 7.8x 10.0x 7.8x 10.6x 13.5x 4.4% 3.0%
AutoNation Inc. $37.58 70.7% (22.7)% $3,278 $5,456 0.26x 0.29x 0.27x 6.8x 6.9x 5.8x NA 12.2x 3.8% (0.5)%
CarMax Inc. $89.55 86.8% 2.1% $14,575 $28,676 1.49x 1.62x 1.34x 26.5x 27.5x 20.7x NA 27.3x 5.6% (2.3)%
Group 1 Automotive Inc. $65.97 59.9% (34.0)% $1,155 $2,766 0.23x 0.26x 0.24x 6.5x 7.8x 6.9x 8.5x 7.5x 3.5% 3.3%
Lithia Motors Inc. $151.33 91.6% 2.9% $3,445 $4,835 0.38x 0.41x 0.37x 10.0x 10.9x 8.4x 17.3x 17.0x 3.8% 5.1%
Penske Automotive Group Inc. $38.71 71.9% (22.9)% $3,115 $3,777 0.17x 0.20x 0.17x 6.1x 7.6x 4.8x 9.8x 15.4x 2.8% 0.1%
Sonic Automotive Inc. $31.91 90.1% 2.9% $1,370 $2,068 0.20x 0.22x 0.19x 5.4x 8.3x 6.5x NA 15.3x 3.7% 4.4%
Median 71.9% (22.7)% 0.26x 0.29x 0.27x 6.8x 8.3x 6.9x 10.2x 15.3x 3.8% 3.0%
Mean 76.2% (14.6)% 0.44x 0.48x 0.42x 9.8x 11.3x 8.7x 11.6x 15.5x 4.0% 1.9%
Note: Represents most actively traded public automotive dealers; EBITDA and Enterprise Value adjusted for floor plan debt and interest expense.
For definitions, See page 15. 14
Source: S&P Global Market Intelligence as of June 30, 2020 and company filings.Industry Insights: Automotive – Summer 2020
Public Companies’
Trading Statistics
($ in millions, except per-share data)
Stock Price as a
6/30/20 % of % Change Enterprise Value as a Multiple of Multiple of LTM
Stock 52-Wk from Market Enterprise Revenue EBITDA LTM 2020 EBITDA Revenue
Company Price High 12/31/19 Capitalization Value LTM 2020E 2021E LTM 2020E 2021E EPS EPS Margin Growth
Automotive Aftermarket Parts and Repair
Advance Auto Parts Inc. $142.45 83.1% (11.1)% $9,805 $10,306 1.09x 1.06x 1.05x 11.7x 11.0x 9.8x 22.3x 21.9x 9.3% (2.1)%
AutoZone Inc. $1,128.12 88.5% (5.3)% $26,352 $34,856 2.89x 2.88x 2.74x 13.6x 13.7x 12.8x 17.6x 17.9x 21.3% 5.6%
Monro Inc. $54.94 62.5% (29.7)% $1,829 $2,585 2.06x 2.23x 2.07x 14.7x 18.2x 13.7x 28.8x 58.4x 14.0% 4.7%
O'Reilly Automotive Inc. $421.67 92.8% (3.8)% $31,299 $35,823 3.51x 3.47x 3.25x 16.4x 16.7x 15.3x 23.6x 24.7x 21.4% 5.7%
Median 85.8% (8.2)% 2.47x 2.55x 2.41x 14.1x 15.2x 13.3x 22.9x 23.3x 17.7% 5.1%
Mean 81.7% (12.5)% 2.39x 2.41x 2.28x 14.1x 14.9x 12.9x 23.1x 30.7x 16.5% 3.5%
Definitions
EBITDA: Earnings Before Interest, Taxes, Depreciation, and Amortization
Enterprise Value: Market Capitalization + Total Debt + Preferred Equity + Minority Interest – Cash and Short-Term Investments Note: Represents most actively traded public automotive aftermarket companies
LTM: Last Twelve Months Source: S&P Global Market Intelligence as of June 30, 2020 and company filings.
EPS: Earnings Per Share 15Industry Insights: Automotive – Summer 2020
Historical On average, Automotive OEMs are trading at 10.1x FY 2019 EPS, over 1.0x lower than their five-
year average price-to-earnings (P/E) multiple. Automotive Suppliers (4.2x) and Automotive Dealers
(6.8x) are both trading at average EBITDA multiples about 2x lower than their 5-year average. The
Trading Automotive Aftermarket index is currently trading 4.3x lower than 2018 and 1.9x lower than its five-
year average. The Aftermarket index was elevated in 2018, with strong multiples from Monro and
Multiples O’Reilly.7
Historical P/E Multiples Since 2014 Historical EBITDA Multiples Since 2014
20.0x 20.0x
5-Year Mean: 11.3x 5-Year Mean: 12.1x
16.0x 14.9x 16.0x
14.5x
13.0x 5-Year Mean: 8.9x 13.2x13.3x
11.6x 11.9x
12.0x 10.7x 10.9x 12.0x 10.6x 10.7x
9.8x 9.6x 9.4x 10.2x
10.1x 5-Year Mean: 6.2x
8.6x
7.6x
8.0x 8.0x 7.0x 7.3x 6.8x
6.6x
5.1x 4.2x
4.0x 4.0x
0.0x 0.0x
Automotive OEMs Automotive Suppliers Automotive Dealers Automotive Aftermarket
FY 2014 FY 2015 FY 2016 FY 2014 FY 2015 FY 2016 FY 2017 FY 2018 FY 2019
FY 2017 FY 2018 FY 2019
Note: Multiples have been adjusted historically to reflect corresponding adjustments made on pages 12-15
Source: S&P Global Market Intelligence as of December 31, 2019 and company filings. 16Industry Insights: Automotive – Summer 2020
YTD 2020 M&A M&A activity in the automotive sector bounced back significantly over the past 12 months with 64
transactions completed from Q2 2019 through the second quarter of 2020. With 26 transactions,
Q3 2019 represented the most robust quarter by deal volume since 2016. With concerns arising
Activity by around COVID-19 in H1 2020, volumes dropped significantly to only 14 transactions compared to
34 in H1 2019.7
Quarter
Automotive Industry M&A Trends
30
26
25
25 24
23
21
20
20
16
15
13
12
11
10
8
6
5 4
2
0
Q1 2017 Q2 2017 Q3 2017 Q4 2017 Q1 2018 Q2 2018 Q3 2018 Q4 2018 Q1 2019 Q2 2019 Q3 2019 Q4 2019 Q1 2020 Q2 2020
Note: All transactions with available target financials 17
Source: S&P Global Market Intelligence.Industry Insights: Automotive – Summer 2020
Notable M&A Activity
Selected M&A Transactions
($ in millions)
Enterprise LTM LTM EBITDA EV/ EV/
Announced Target Name Target Business Description Acquirer Name Value Revenue EBITDA Margin Revenue EBITDA
Designs, manufactures and distributes power
Dec-19 TRANSTECNO S.R.L. transmission components, reduction gears and Interpump Group S.p.A. $67.2 $50.3 $9.7 19.3% 1.34x 6.9x
gearmotors
Veoneer-Nissin Brake
Designs and manufactures brake control and brake Honda Motor Co., Ltd.;
Oct-19 Systems (Zhongshan) $137.3 $127.6 NM NA 1.08x NA
actuation systems Nissin Kogyo Co., Ltd.
Co., Ltd.
Chongqing Sokon
Dongfeng Xiaokang Manufactures, markets and distributes passenger
Sep-19 Industry Group Stock $1,214.9 $2,451.7 NM NA 0.50x NA
Motor Company Limited vehicles
Co.,Ltd.
Fortress Resources, Manufactures and sells a range of vehicle bodies, Spartan Motors USA,
Sep-19 $90.1 $40.0 NM NA 2.25x NA
LLC work trucks and accessories Inc.
Seoyon Electronics Co.,
Engages in the manufacture and sale of automotive
Sep-19 Ltd. (nka:Mobase MOBASE Co.,Ltd. $265.6 $640.0 $27.9 4.4% 0.42x 9.5x
products in South Korea and internationally
Electronics Co.,Ltd.)
Manufactures and sells engineered automotive
Autokiniton US
Jul-19 Tower International, Inc. structural metal components and assemblies primarily $1,050.3 $1,492.9 $136.2 9.1% 0.70x 7.7x
Holdings, Inc.
for original equipment manufacturers
Webasto Donghee Develops an electric power transmission apparatus
Apr-19 Webasto SE $184.4 $402.2 $16.3 4.0% 0.46x 11.3x
Holdings Co., Ltd. of sunroof for motor vehicles
Magna Powertrain Hanon System EFP
Mar-19 Engages in the manufacture and sale of car parts $95.8 $218.4 NA NA 0.44x NA
Campiglione S.r.l. Corporation
Mean $685.1 $828.4 $112.1 11.4% 1.68x 10.8x
Median $172.2 $156.5 $27.9 9.3% 1.11x 11.1x
Note: Listed transactions represent a select group of most relevant M&A activity in the last twelve months, selecting based on transaction relevance, size metrics and multiple availability.
Source: S&P Global Market Intelligence and company filings. 18Industry Insights: Automotive – Summer 2020
Notable M&A Activity
Selected M&A Transactions
($ in millions)
Enterprise LTM LTM EBITDA EV/ EV/
Announced Target Name Target Business Description Acquirer Name Value Revenue EBITDA Margin Revenue EBITDA
Aurangabad Electricals Manufactures and sells automotive components in Mahindra CIE
Mar-19 $119.2 $113.8 $10.7 9.4% 1.05x 11.1x
Ltd. India and internationally Automotive Limited
Develops, manufactures, and sells electric motors, Danfoss Power
Nov-18 UQM Technologies, Inc. generators, power electronic controllers and fuel cell Solutions (US) $100.9 $10.9 NA NA 9.24x NA
compressors Company
Manufactures suspension systems and components
Nov-18 Öhlins Racing AB Tenneco Inc. $160.0 $130.0 NA NA 1.23x NA
for the automotive and motor sport industries
Designs, manufactures and distributes industrial
Nov-18 Vignal Systems SA vehicle signalling products and systems to EMZ Partners $134.3 $119.6 NA NA 1.12x NA
aftermarkets in Europe
Designs and manufactures alternative fuel storage
Agility Fuel Solutions Hexagon Composites
Nov-18 and delivery systems, and cylinders for medium- and $248.4 $157.3 $14.7 9.3% 1.58x 16.9x
LLC ASA
heavy-duty trucks, buses and specialty vehicles
Designs and develops interior and exterior lighting
Methode Electronics
Aug-18 Grakon Parent Inc. systems and engineered trim components for original $496.6 $155.7 $37.8 24.3% 3.19x 13.1x
Inc.
equipment vehicle manufacturers worldwide
Sage Automotive Designs, develops and manufactures automotive Asahi Kasei
Jul-18 $1,060.0 $474.9 NA NA 2.23x NA
Interiors Inc. interior solutions for automotive manufacturers Corporation
Manufactures and distributes tires, tracks and track Compagnie Générale
Jul-18 Camso Inc. systems, as well as OEM undercarriages for material des Établissements $1,611.0 $976.0 $136.0 13.9% 1.65x 11.8x
handling, agriculture and other industries Michelin
Disc Brakes Australia Manufactures, designs and markets disc brake
Jun-18 GUD Holdings Limited $16.8 $15.2 NA NA 1.11x NA
Pty Ltd. rotors, brake drums and disc brake pads
Mean $685.1 $828.4 $112.1 11.4% 1.68x 10.8x
Median $172.2 $156.5 $27.9 9.3% 1.11x 11.1x
Source: S&P Global Market Intelligence and company filings. 19Industry Insights: Automotive – Summer 2020
Duff & Phelps’ Recent Transactions
Board Advisor Sell Side Advisor Fairness Opinion Board Advisor
BMW Group and Daimler AG has been acquired by has acquired Exclusive financial advisor in
combined their mobility connection with a Series B
services in an equally owned funding round for Oply
joint venture
Power Solutions business
Fairness Opinion Fairness Opinion Sell Side Advisor Buy Side Advisor
has announced a transaction has been acquired by has been acquired by has acquired
to be acquired by
and
20Industry Insights: Automotive – Summer 2020
Sources
1. Barua, Akrur. “What Might be Expected of Consumer Spending in a COVID-19- 20. “Rating Action: Moody’s Places Ratings of 25 US Auto and Commercial Vehicle Parts
Driven Business Cycle?” Deloitte Insights. April 29, 2020. Suppliers, and Certain Logistics Providers Under Review for Downgrade.” Moody’s.
2. “Global Light Vehicle Sales Update.” LMC Automotive Public Data. June 2020. March 26, 2020.
3. “U.S. Light Vehicle Sales.” WardsAuto Public Data. 21. “Fitch Downgrades Tenneco's IDR to 'B+'; Outlook Negative.” Fitch Ratings. April 30,
4. Federal Reserve Economic Data (FRED). 2020.
5. China Association of Automobile Manufacturers. 22. Thomas, Arthur. “Techniplas Files for Bankruptcy after COVID-19 Stalls Private Equity
6. “Passenger Car Registrations: -25.6% First Quarter of 2020; -55.1% in March.” Deal.” BizTimes. May 8, 2020.
European Automobile Manufacturers Association. April 17, 2020. 23. Cohan, William. “’This Is Just F--king Unbelievable!’: Bankrupt Hertz Is a Pandemic
7. S&P Global Market Intelligence. Zombie.” Vanity Fair. June 15, 2020.
8. Kane, Mark. “Global Plug-In Electric Car Sales In March 2020 Were Stronger Than 24. Yerak, Becky. “Auto-Parts Supplier APC Files for Bankruptcy.” The Wall Street Journal.
Expected.” Inside EVs. April 30, 2020. June 3, 2020.
9. Kane, Mark. “China: Plug-In Electric Car Sales Rebound In March 2020 With Tesla 25. Thomas, Arthur. “Jason Industries Plans Bankruptcy Filing as Part of Restructuring
Model 3 #1.” Inside EVs. April 23, 2020. Agreement.” BixTimes. June 8, 2020.
10. “Global Pandemic Impacts Automobile Industry Figures in Q1 2020.” Powder 26. “Fitch Revises Faurecia's Outlook to Negative; Affirms IDR at 'BB+’.” Fitch Ratings. June
Metallurgy Review. April 22, 2020. 12, 2020.
11. “IHS Slashes 2020 Global Light Vehicle Sales Outlook on Coronavirus Hit.” Reuters. 27. Thiel, Wade. “2020 US Vehicle Sales Figures by Brand.” Good Car Bad Car. Updated
April 21, 2020. June 2, 2020.
12. “Global Pandemic Won’t Stop The Switch To Electric Cars.” Forbes. June 30, 2020. 28. Stern, Perry. “Best-Selling Cars of 2020… So Far.” autoNXT. April 2, 2020.
13. Dummett, Ben and Kostov, Nick “Fiat Chrysler Agrees to Binding Merger With 29. Feltmate, Thomas. “U.S. Vehicle Sales.” TD Economics. July 1, 2020.
Peugeot Maker to Create $50 Billion Auto Giant.” Wall Street Journal. December 18, 30. “Mexico Car Production.” Trading Economics. May 19, 2020.
2019 31. “LMC Automotive Global Light Vehicle Sales Update (February 2020).” MarkLines. March
14. Dummett, Ben. “Fiat Chrysler, Peugeot Scrap Billion-Dollar Dividends as Merger 16, 2020.
Faces Pressure.” Wall Street Journal. May 14, 2020. 32. Yang, Tian and Zhang, Chunying. “Chinese Plants Start Up as the Rest of the World
15. Zachariah, Ben. “Fiat-Chrysler-Jeep and Peugeot-Citron-Opel Merger Under Shuts Down.” Automotive News. March 25, 2020.
Threat.” Drive.com. June 22, 2020 33. Strong, Michael. “China Auto Production for 2020 Predicted to Drop 11.5 Percent.” The
16. “Auto Suppliers see Spike in Probability of Default During COVID-19 Pandemic.” Detroit Bureau. April 6, 2020.
S&P Global. April 30, 2020. 34. cent, Danny. “The Uncertain Future for China’s Electric Car Makers.” BBC News. March
17. Boudette, Neal. “Autoworkers Are Returning as Carmakers Gradually Crank Up 27, 2020.
Factories.” New York Times. May 17. 2020. 35. “Trump Threatens Big Tariffs on Car Imports from EU.” Reuters. January 22, 2020.
18. “General Motors to Temporarily Suspend Production.” General Motors Corporate 36. “Britain is Leaving the EU, but the Auto Industry Still Needs to “Get Brexit Done.”
Newsroom. March 18, 2020. Automotive World. January 31, 2020.
19. “Ford Credit Downgraded to Junk by S&P.” Automotive News. March 25, 2020. 21Industry Insights: Automotive – Summer 2020
Contact Us About Duff & Phelps
Duff & Phelps is the global advisor that protects, restores and
North America Europe
maximizes value for clients in the areas of valuation, corporate finance,
Mark Kwilosz Andreas Stoecklin disputes and investigations, cyber security, claims administration and
Head of North American Automotive M&A Country Head of Germany
Advisory Frankfurt regulatory issues. We work with clients across diverse sectors on
Chicago +49 697 191 8466
+1 312 697 4677 andreas.stoecklin@duffandphelps.com matters of good governance and transparency. With Kroll, the leading
mark.kwilosz@duffandphelps.com
global provider of risk solutions, and Prime Clerk, the leader in complex
Klaus Pflum business services and claims administration, our firm has nearly 4,000
Steve Burt Senior Advisor, Corporate Finance
Global Head of M&A Advisory Munich professionals in 25 countries around the world. For more information,
Chicago +49 893 8888 4110
+1 312 697 4620 klaus.pflum@duffandphelps.com visit www.duffandphelps.com.
steve.burt@duffandphelps.com
Paul Teuten M&A advisory, capital raising and secondary market advisory services in the United
David Althoff Managing Director, M&A Advisory States are provided by Duff & Phelps Securities, LLC. Member FINRA/SIPC. Pagemill
Global Head of Diversified Industrials M&A London
+44 (0) 20 7089 4840 Partners is a Division of Duff & Phelps Securities, LLC. M&A advisory, capital raising and
Advisory
Chicago paul.teuten@duffandphelps.com secondary market advisory services in the United Kingdom are provided by Duff &
+1 312 697 4625 Phelps Securities Ltd. (DPSL), which is authorized and regulated by the Financial
david.althoff@duffandphelps.com
Nicolas Depardieu Conduct Authority. M&A advisory and capital raising services in Germany are provided
Managing Director, Pagemill Partners, by Duff & Phelps GmbH, which is a Tied Agent of DPSL. Valuation Advisory Services in
Howard Johnson Technology Division of Duff & Phelps India are provided by Duff & Phelps India Private Limited under a category 1 merchant
Managing Director, M&A Advisory Paris
banker license issued by the Securities and Exchange Board of India.
Toronto +33 1 40 06 40 46
+1 416 597 4500 nicolas.depardieu@duffandphelps.com
howard.johnson@duffandphelps.com
For more information, please visit:
South America Asia
Alexandre Pierantoni David Lu
www.duffandphelps.com
Managing Director, M&A Advisory Managing Director, M&A Advisory
The material in this report is for information purposes only and is not intended to be
São Paolo Shanghai
relied upon as financial, accounting, tax, legal or other professional advice. This report
+1 55 11 3192 8103 +86 21 6032 0608
does not constitute, and should not be construed as soliciting or offering any investment
alexandre.pierantoni@duffandphelps.com david.lu@duffandphelps.com
or other transaction, identifying securities for you to purchase or offer to purchase, or
recommending the acquisition or disposition of any investment. Duff & Phelps does not
Katsumi Asai guarantee the accuracy or reliability of any data provided from third party resources.
Although we endeavor to provide accurate information from third party sources, there
Managing Director, Valuation Advisory
can be no guarantee that such information is accurate as of the date it is received or that
Tokyo
it will continue to be accurate in the future.
+81 (0)3 3593 0183
22
katsumi.asai@duffandphelps.com Copyright © 2020 Duff & Phelps LLC. All rights reserved.You can also read