GLOBAL AUTOMOTIVE - Euler Hermes
←
→
Page content transcription
If your browser does not render page correctly, please read the page content below

Economic Research

GLOBAL
AUTOMOTIVE
September 2018

                                                                                    Photo by Matt Duncan on Unsplash
BUMPY ROAD AHEAD
04   Worldwide vehicle sales to exceed 100mn units in
     2019 and 110mn units in 2022

06   Short-term challenges for manufacturers and suppliers:
     Transition to electric vehicle and instability in international
     trade

11   Weakening Margin, Lower Capex
Special Report Global Automotive by Euler Hermes Economic Research
EXECUTIVE The automotive market is set to grow by +3.0% in 2018
compared to +3.1% in 2017 and to slow down to +1.9% in
2019, with new vehicle registrations expected to exceed
SUMMARY 100mn units in 2019, worldwide.
Medium-term prospects remain favorable, with annual
sales to reach 110 million units by 2022 mainly driven by
the demand in China and to a lesser extent India.
However, for manufacturers and suppliers, transition to
electric vehicle and protectionism are leading to greatly
increased uncertainty and rising costs, notably inputs
costs, relocation of production and upheaval of supply-
chains.
Maxime Lemerle, Head of Sector and Insolvency Research
+33 1 84 11 54 01 Some car makers will be forced to dedicate CAPEX to
maxime.lemerle@eulerhermes.com meeting short term challenges and therefore not be able
to deploy the significant amounts required to take ad-
vantage of opportunities stemming from the future of
mobility.
Chart 1 Contributions to Growth in Global Vehicle Sales (in pp)
6%
4,2% 4,7%
5%
3,2%
4% 1,5% 3,1%
3,0%
3%
1,9%
2%
1%
0%
-1%
-2%
-3%
13 14 15 16 17 18F 19F
China UK Rest of the world
Japan India France
Germany US Brazil
Canada Italy All countries
Sources: OICA, IHS, Bloomberg, Allianz Research
2
September 2018

                                          Photo by Chuttersnap on Unsplash

100mn
 Vehicle sales in 2019

                                                          3
Special Report Global Automotive by Euler Hermes Economic Research
GLOBAL AUTOMOTIVE
BUMPY ROAD AHEAD
A positive global market: Driven by demand from China and In-
dia after two years of growth (+ 3% in 2018 and + 1.9% in 2019),
new vehicle registrations are expected to exceed 100mn units in
2019, worldwide.
Short-term yet high-pressure for manufacturers and suppliers:
Transitioning to electric vehicle and the protectionism increase
are two challenges weighing down on their financial prospects
and their ability to invest in future mobility markets.
The global automotive market ing countries (iv) growing second- market, with new vehicle registra-
continues to grow, with still hand markets (in China, the U.S., the tions increasing by + 12% in 2018 (to
U.K.) that will maintain the price 4.5mn units) and + 9% in 2019
favorable medium-term pro-
differential with new vehicles and (4.9mn units), before reaching the
spects mainly driven by the continue to surpass new-vehicle de- podium in 2020. Japan, after experi-
demand in EM. liveries in most mature markets encing several years of a volatile
(where the ratio of used-vehicle to market, should stabilize in 2018 be-
After a healthy eight year recovery-
new-vehicle sales stand between 2 fore a small increase in 2019 (+1%)
time and a still dynamic first half in
and 2.5). to 5.2mn units.
2018, the automotive market is set
Europe will follow, thanks to deceler-
to grow by +3.0% in 2018 compared Asia will lead the way as the largest
ating, yet still increasing sales in the
to +3.1% in 2017 and to slow down contributor to sales growth, thanks
E.U., specifically in the German and
to +1.9% in 2019. Worldwide vehicle to China and India generating to-
French markets, with the U.K. and
sales will reach 99.7mn in 2018. They gether more than 55% and 75% of
Italy as key exceptions, and to the
will cross the 100mn unit threshold in the additional global sales, respec-
strong performance in the Eastern
2019 with 101.6mn annual sales tively in 2018 and 2019. China is on
countries, boosted by the rebound in
despite some hurdles that will im- course to strengthening its position
Russia and double digit growth in
pede additional sales in different as the world's largest automotive
smaller markets. Germany continues
countries. They are the following: (i) market, despite a slight downshift in
to host Europe’s largest market with
the decelerating economic momen- new registrations. These are ex-
3.9mn units in 2018 (+3%) and al-
tum (Asia, Europe) (ii) the global pected to increase by + 4% in 2018
most 4.0mn in 2019 (+1%); still lower
tightening of financial conditions and + 3.5% in 2019, after a CAGR of
than the peak reached in 2009. After
that will raise borrowing costs for + 8.6% between 2012 and 2017 to
3 years of a steady recovery-time
households (iii) the renewed ten- 29.2mn in annual sales. India, for
(+5.6% cagr over 2015-2017), in
sions on some currencies that will now, should maintain its position of
2018, France is to regain the histori-
penalize the demand from import- 4th place in the global automotive
cal high, reached in 2009, with
4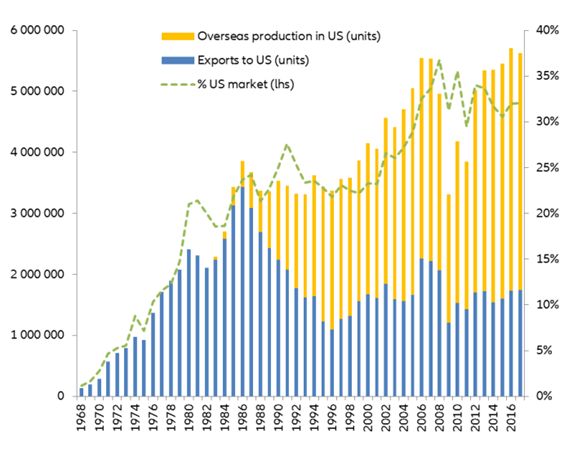
February 2018

                                                                                                                                    Photo by Ed259 on Unsplash

2.7mn (+4%) before 2.8 in 2019 (+2%).        port the markup to new records in the       case for three major countries—Brazil
On the other hand, Italy should post ex-     next five years.                            (210), China (120) and India (25). With
perience a small decline (-1%) both in       First, let’s talk about the unsatisfied     this in mind, we expect to see emerging
2018 and 2019, and continue to register      needs for mobility around the world. De-    markets with positive economic forecasts
a lot less new vehicles than in 2007         spite the impressive number of more         and a growing middle-class. All in all,
(2.8mn) despite four consecutive years of    than 1300mn vehicles in use worldwide,      annual sales in emerging markets should
a strong rebound between 2013 and            there is a huge disparity between coun-     increase by +13mn in 2022, compared to
2017 (+11.4% cagr). The U.K. will contin-    tries and numerous markets that are still   2017. We expect, a noticeable extra
ue to be a key exception, with a set of      posting a (very) low motorization rate,     +6mn to +35mn vehicles in China (i.e.
declines in registrations due to diesel      with the lowest averages at 60 per 1000     34% of global sales), and +2mn to +6mn
taxation, air-quality plans, waning con-     inhabitants in Africa/Middle East, 100      in India (i.e. almost 6% of global sales),
sumer purchasing power and Brexit-           per 1000 in Asia and 200 per 1000 in        with the potential to double the market
related uncertainties. In our central sce-   South America, compared to more than        size in the next ten years when reaching
nario of a last minute agreement, we         800 per 1000 inhabitants in North Ameri-    8mn units.
expect a decrease of -6% in 2018 and -       ca and 600 in Western Europe, as is the
3% in 2019 (after -5% in 2017) for new
car sales that will push them down to                                       Chart 2 Global Vehicle Sales Medium-term forecasts (in million)
2.8mn in 2018 and less than 2.7mn in
2019, compared to the highest sales of
3.1mn in 2016.
In this context, the U.S. market will re-
main key - as the second largest market
with more than 18% of global sales -
however its contribution to the increase
in global sales will mainly come from the
recovery of the Brazilian market. Cur-
rently, the U.S. market should reach a
plateau in 2018 at 17.6mn units, just
slightly down from the high level
reached in 2016 at 17.9mn units, before
a moderate decrease in 2019 (-1.5% to
17.3 min).

Medium-term prospects remain favora-
ble at global level, with annual sales to
reach the 110 million threshold by 2022.
Despite the slower pace expected in the
short term, two key factors should sup-
                                                                                              Sources: OICA, Oxford Economics, Allianz Research

                                                                                                                                               5
Special Report Global Automotive by Euler Hermes Economic Research
Second, let’s address the needs and               mercial success of Sport Utility Vehi-   for the first time in 2017 (+54% after
appetite for replacement in mature                cles (SUVs) globally (+14% in H1         +38% in 2016) and will keep on post-
markets. We believe that mature                   2018 to almost 15mn units) and the       ing record annual sales in 2018 after
markets should no longer be a                     Advanced Driver Assistance Systems       another staggering increase (+45%),
strong foundation for growth in                   (ADAS). (iii) The environmental needs    as well as in 2019 (+46%) when ap-
global sales, posting at best a mod-              arising from both consumer demand        proaching the threshold of 2.5mn.
erate increase by 2022, but we still              and public authority restrictions,       Thanks to this rapid expansion, the
expect them to remain broadly sta-                through regulation and standards,        worldwide fleet of EV will climb from
ble at around 43 million vehicles per             that are driving up the electric vehi-   3.1mn in 2017 to 4.7mn in 2018 and
year. Here are three points that sup-             cle (EV) market.                         more than 7.2mn in 2019.
port this point of view: (i) the natural
                                                  The transition to EV has be-        However, this growth still only comes
need for replacement, coming with
                                                  come increasingly challenging       from few countries, particularly Chi-
the size and average age of the fleet
                                                                                      na, and EV market shares remain
of vehicles in use. The purchase of               in the short term for auto mak-
                                                                                      limited with a large dispersion across
replacement vehicles accelerated in               ers. They are entering a critical   countries, reflecting in practice the
recent years as households previous-
                                                  phase, because the timing and       state of policy support and regulato-
ly postponed purchasing after the
                                                  costs of adapting to a large        ry frameworks. China is by far the
global financial crisis. Yet, since
                                                  variety of specific market con-     largest contributor to growth, with
2010, the growth in the number of
                                                                                      more than half of global EV sales,
vehicles in use (more than 250mn)                 texts, notably regulations, can
                                                                                      followed by the U.S. It now has a
still exceeds the growth in new sales             be challenging and the end of       larger EV market than the U.S. and
in Europe, meaning that the average
                                                  diesel is arriving faster than      Europe combined and the set of poli-
vehicle age remains high (with a
                                                  expected.                           cy measures in place, in terms of sub-
use/sales ratio exceeding fourteen
                                                                                      sidies and regulation, will guarantee
years). (ii) The consumer’s appetite              The global EV market is enjoying a
                                                                                      its leadership position. Yet, almost
for innovation and new technology                 strong double-digit momentum.
                                                                                      all the mature markets are expected
and services, as seen with the com-               Global EV sales surpassed 1mn units
                                                                                      to explode with double-digit growth

Chart 3 Global EV Sales (in thousand)

 3000                                                                                                  3,0%
                           China
                           UK
                           Rest of the world                                                 2,4%
 2500                                                                                                  2,5%
                           Japan
                           India
                           France
 2000                                                                                                  2,0%
                           Germany
                                                                                  1,7%
                           US
                           Brazil
 1500                                                                                                  1,5%
                           Italy
                                                                        1,2%
                           Canada
                           Global share of EV sales (lhs)
 1000                                                         0,8%                                     1,0%
                                                   0,6%

    500                                    0,4%                                                        0,5%
                            0,2%
              0,1%

      0                                                                                                0,0%
                12           13            14       15         16        17       18F         19F

Sources: IAE-EVI, EAFO, Allianz Research

6
September 2018
in EV sales in the coming two years. after a double-digit growth (+37% in appetite for EVs by enabling long
We foresee annual EV sales to ex- 2017 after +71% in 2016). However, distance travel and optimizing instal-
ceed 320K units in the U.S. and 100K this rate is not enough to significant- lation in cities with land availability
units in Japan by 2019. The Europe- ly increase the concentration of sta- constraints, notably in China. More
an countries will reach 400K units in tions, still at 374 chargers per 1000 importantly, the installation of
2018. EV on average in 2017 (compared to charging stations is highly different
340 in 2015). Moreover almost 3 out from one country to another, with
Despite this momentum, EV market
of 4 publicly accessible charging almost three-quarters of the world’s
shares will remain low for the short
stations have slow charging outlets, stock of chargers in China as of end-
term, totaling less than 1.7% of glob-
while fast and ultra-fast chargers are 2017 (213K chargers) – even if other
al sales in 2018 and 2.4% in 2019,
essential to increasing the consumer countries have accelerated the de-
from 1.2% in 2017. The same is true
at the country level, since most coun-
tries were posting a lower than 1.5%
market share for EV in 2017, with Chart 4 Charging Infrastructure and Share of EV Sales
only a few key exceptions such as
600 2,5%
the U.K. (1.6%), China (2%), Sweden
(4.6%) and Norway (31%). In China, 500 2,0%
the adoption rate at the national 400
level mainly results from strong sales 1,5%
in a limited number of large cities 300
1,0%
such as Beijing and Shanghai. Nor- 200
way stands out as the world’s most 0,5%
100
advanced market of electric cars in
terms of sales shares since 2011 and 0 0,0%
the first market to have reached a
critical mass.
In the case of Norway, where policy Fast Chargers per K EV Slow Chargers per K EV
support has been a key factor for EV
Share of EV sales
deployment, and conversely in the
Netherlands, where a shift in the
Sources: IAE-EVI, Allianz Research
incentive system lead to a trend re-
versal in EV sales in 2016 (-44%) and Chart 5 Market share of Diesel in new registrations (in %)
2017 (-55%), both show that EV suc-
cess continues to be dependent on
two critical features that limit the EV
expansion to a small set of countries
and keep it dependent on all kinds
of policy support, and thus vulnera-
ble to any changes.
Constraint 1: The charging infra-
structure. Households use private
charging stations at home and at
the workplace, but access to publicly
accessible charging stations, particu-
larly along major road networks, is
an important factor in increasing EV
sales. At a global level, the number
of charging stations continues to
Sources: ACEA, Allianz Research
increase, with 430,151 installations
7Special Report Global Automotive by Euler Hermes Economic Research
ployment of charging stations last dal in 2015 and recently accelerated In Europe, the result of this was the
year (+39% in Germany, +24% in the throughout Western Europe where transition into the Worldwide Har-
U.S., +21% in the U.K. compared to diesel accounts for more than half of monized Light Vehicle Test Proce-
+51% in China) and most often an- new car registrations. This has been dure (WLTP) that came into play
nounced their ambition to support the case for more than a decade but September 1St.. The obligation for all
large-scale infrastructure. dropped below -40% in H1 2018 new car registrations to meet tough-
regionally and below 33% in Germa- er emission standards created short-
Constraint 2: The value proposition
ny and the U.K. This trend was ac- term turbulences on production and
of EVs (too expensive for most
centuated when a wave of an- sales. Consequently, modifications
households). Battery cost, which,
nouncements were made by na- of models were costly and there was
despite a strong decrease since
tional/local authorities about ICE a (temporary) stop in production,
2010, is now being reduced at a
vehicle bans, access restrictions and and accelerating sales with signifi-
much slower pace and continues to
intentions to end sales/registrations cant discounts to wholesalers and
be the main reason for the higher
of new ICEs. This had a significant retailers up to September for non-
prices of EVs in comparison with in-
impact on suppliers specializing in compliant models. There is yet an-
ternal combustion engine vehicle
diesel car parts, who were forced to other more difficult challenge in
(ICEs). Further battery cost reduc-
endure drastic adjustments, includ- sight— compliance in 2020 with EU
tions are expected with increased
ing job losses and potential insol- rules governing CO2 emissions with
production, but even if simultane-
vencies. At the same time, this weak- the ultimate threat of a penalty of
ously the battery performances con-
ening demand for diesel has been EUR95 per gram exceeding the tar-
tinues to improve, the role of finan-
benefiting ICEs more than EVs be- get. In China, this is the New Energy
cial incentives, such as subsidies and
cause of their value proposition (and Vehicle (NEV) credit scheme that set
tax exemptions, remains crucial for
the low oil price context that re- a minimum requirement for the car
individuals deciding on purchasing
duced the operating-cost ad- industry, in terms of production of
an EV.
vantage of EVs). The latter is an ex- new energy vehicles, with a system
Consequently, the accelerated end tra matter of complexity for au- of EV credit that can be obtained by
of diesel and the tightening of regu- tomakers since they are facing an producing and importing EVs, and
lations are adding pressure on au- acceleration of regulatory con- purchasing NEV credits from other
tomakers, by forcing them to adapt straints linked to the implementation manufacturers.
faster and more cost-effectively. The of new standards and threats of fi- For manufacturers, both challenges
decline in Diesel’s market share nancials penalties. (in Europe and China) already
started after the VW emission scan- pushed a faster roll-out of new mod-
Chart 6 Bilateral Net Balance in Trade in Automotive (USDbn, 2017)
Surplus in green, Deficit in red. Example: China (line 3) has a trade deficit with Germany (column 5). Conversely Germany (line 5)
has a trade surplus with China (column 3)
Sources: UNCTAD, Allianz Research
8September 2018
els compliant with the regulatory based foreign automakers have key aluminum mechanically drives up
targets. This will weigh on associat- positions, notably the Japanese the input costs for the US-based
ed costs (R&D, industrial deploy- Toyota, Honda and Nissan (40% of manufacturers continuing to import
ment, marketing, etc.) and push for total production). Uncertainties on metals. On average enacted tariffs
flexible platforms, since there are no the Brexit outcome have already on metals already increased by
certainties at this stage on the win- impacted investments in the sector, about USD250 the cost of producing
ning engine in the medium term, with a decline of -33% in 2017 and - a new car in the US. For the local
whether it be fully-electric, hybrid, 46% in H1 2018 to less than manufacturers, this will be at the
plug-in hybrid or another one. GPB350mn. expense of the margin for the entry-
level cars, on which the price compe-
The major turbulence comes from
tition is intense, and the consumer
multiple initiatives of the Trump ad-
The increase of instability on for the higher-level/premium cars.
ministration.
international trade adds more Secondly, by being the starting point
Sanctions on Iran have had a very
unpredictability to financial for tariff escalation with China on a
limited impact. From a global point
expectations, corporate strat- of view, there has mainly been a variety of parts and components
egies and investments. (temporary) loss of a promising mar-
used on US-based assembly lines.
Brexit-related uncertainties continue ket for all automakers since new This will continue to drive up the cost
to threaten the Western European of the US vehicle, while the latter
registrations reached 1.7mn units in
automotive sector specifically, since 2017 (i.e. 1.7% of global sales mean- already approaches USD35000 in
the U.K. is both a significant market ing just slightly less than the South average and is pushing vehicles
for exporters and a major hub. After Korean market). loans to record levels.
a -5% slump in 2017, we expect sales Trade agreement renegotiations
U.S. steel and aluminum duties have
to decline by another -6% in 2018 and (threats of) additional trade
a stronger impact. First directly, since
and -3% in 2019 in our central sce- barriers targeting the auto sector is
metals represent more than half of
nario of a last minute Brexit agree- a double shock of uncertainty. Presi-
the components in a vehicle: the
ment. This will push the annual new dent Trump has directly targeted the
increase in imports tariffs to 25%
sales down to 2.8mn in 2018 and automotive sector with his objective
and 10% respectively for steel and
less than 2.7mn in 2019, from a high
of 3.1mn in 2016, suggesting that
the U.K. would lose one rank in the Chart 7 Global Exports in Automotive (USDbn)
Western European market and fall
to third place behind Germany and China UK Rest of the world
France. Yet, a hard Brexit scenario Japan India France
1600 Germany US Brazil
has the potential for a perfect storm. Italy Canada 1 440
Not only because auto exports to- 1 374
1400 1 326 1 306 1 334
taled USD51.9bn in 2017 (10% of
1 220 1 259 1 281
British exports) and auto imports 1200
totaled USD79.5bn, but also since: (i) 1 065
almost 80% of the cars sold in the 1000
U.K. are imported, notably 66% from 828
the EU (ii) the local-based auto in- 800
dustries import three times more
600
components from the EU than they
export to the EU; (iii) the domestic 400
production, which amounted to
1.7mn units in 2017, despite a -3% 200
decline for the first time in nine
years, is at 80% dedicated to exports, 0
08 09 10 11 12 13 14 15 16 17
including 50% to the EU (iv) local-
Sources: UNCTAD, Allianz Research
9Special Report Global Automotive by Euler Hermes Economic Research
of rebalancing the U.S. trade bal- after an increase of (+8%) 25% tariff for pickup and truck vehi-
ance and supporting domestic pro- USD1,439bn, and came at 68% from cle imports to the U.S.). That being
duction. Firstly, the U.S. is by far the automobiles and 32% from auto said, lowering tariffs could remain a
world's largest auto importer parts. Top exporters are Germany favorable option for German manu-
(USD291bn), accounting for 20% of (USD252bn), Japan (144), the U.S. facturers, but it may not increase the
the total, registering significant defi- (127), Mexico (101) and China (72), interest of European consumers for
cit in net trade (USD165bn). Second- while top importers are the U.S. US vehicles, poorly adapted to local
ly, President Trump initiated a na- (USD291bn), Germany (126), U.K. needs, since it would disadvantage
tional security investigation into au- (79) and China (73). However, key European manufacturers in their
tomotive imports, using section 232 concerns are for the top 3 imbalanc- trade with other countries with which
of the Trade Expansion Act of 1962, es in trade between: US-Mexico they would have to adjust tariffs in
and bilateral actions with trade (USD62bn deficit), US-Japan (49) application of WTO rules.
partners of the automotive sector on and US-Germany (23). One risk is the 20-point increase in
tariff issues (customs duties) as well Negotiations with Germany has a US import tariffs on imported vehi-
as on non-tariff questions (local specific complexity since they need cles from Europe. This would in-
sourcing, labor costs) as seen in the to involve the EU while all EU mem- crease the average price of a Euro-
outcome of the negotiations with bers do not have the same kind of pean car imported to the U.S by
Mexico. The still on-going negotia- exposure in their trade with the U.S. EUR6.5K, decrease the number of
tion with the EU and escalation in when it comes to the automobile cars imported by 270K and gener-
trade barriers with China is a double industry— apart from the U.K., Ger- ate a shortfall of around EUR10bn
concern. many is the only European manufac- for the European automotive indus-
turer massively exporting (resp. im- try, the year after the new tariffs are
The first uncertainty is on level of
porting) to (and from) the U.S., most- introduced (i.e. 1.5% of total Europe-
trade. Global exports of vehicles
ly premium cars. The tariff differen- an vehicle exports). Another risk is a
represent 9% of global trade of
tial was the starting point for discus- trade escalation scenario with Chi-
goods (6.5% of global trade of
sions with US cars imported to the na, who has already retaliated to
goods and services). Total exchang-
EU subject to 10% tariffs versus 2.5% the U.S. tariffs by increasing tariffs
es reached a record high in 2017,
the other way (not to mention the for US-made vehicles to 40%, mak-
ing them less competitive. Both risks
Chart 8 Percentage of locally-produced cars on total sales would further limit global trade in
automobiles, already expected to
India 99% decelerate to +5.5% in 2018 and
95% +4.8% in 2019 to USD1,600bn in
Japan 92%
89% 2019.
Malaysia 87%
85% The second uncertainty is for imple-
Russia 85% mentation strategies and supply-
83%
Vietnam 62% chain interconnections, because
58% most operators are global players
South Africa 47% who produce and export in and
41%
France 39% from several countries. They have
36% established global or regional wide
Germany 34%
30% network of parts and vehicle assem-
Spain 21% bly plants. The variety of business
20% models, brand by brand, deeply
Canada 18%
16% complicates the negotiations at gov-
UK 15% ernment levels. German automakers
7%
Australia 5% are the best example: In 2017, they
exported around 494k cars from
0% 25% 50% 75% 100%
Germany to the U.S. and produced
Sources: JATO, Allianz Research
10September 2018
Photo by Alexander Popov on Unsplash
more than 800K cars in the U.S. All the announcements resulted in and that is to optimize production
while more than half of this US- adaptation costs (higher input costs (entry-level cars in low-labor costs
based production was exported in the U.S. and Mexico, lower expec- plants), possibly with more local-
(430K cars), notably to Asia. At the tation of exports for cars targeted by based production in specific cases.
same time, German manufacturers higher tariffs). On-going negotia- One new and proactive objective
have major differences in terms of tions have wait-and-see attitude could be to avoid further protection-
US-based production with, for exam- costs that are unfavorable for invest- ist policies, possibly by creating fac-
ple, major production plants for ment decisions. Finally, the outcome tories in markets that should be less
BMW and Mercedes, specifically for of those on-going negotiations will targeted by tariff threats, notably in
SUVs that are exported to China, generate additional adaptation the emerging ASEAN or South Asian
and for Daimler’s Mercedes, which is costs, since corporations will contin- markets.
ue fine-tuning their business models,
the largest US-heavy-truck manufac-
eventually brand by brand, meaning
turer, while none of VW Group’s pre-
more or less reshuffling for current Margin of the sector will most
mium-brand, such as Porsche and
production hubs and supply chains. likely weaken, while the indus-
Audi, has production capacity in the
One objective will be maintained, try must continue massively
U.S.
investing to benefit from the
future of mobili-
Chart 9 Revenue and EBIT (USDbn)
ty/automobiles.
The automotive sector probably
reached a high point in its cycle in
2017. The automotive sector regis-
tered eight years of recovery-time
since the collapse of the global mar-
ket that led most automotive players
to severe financial difficulties and
large scale bankruptcies, particular-
ly in the U.S. (GM and Chrysler). In
2017, the global amount of revenue
reached record highs at
USD2,335bn for manufacturers and
USD0,620bn for suppliers, as
demonstrated in our panel of the
top 60 listed manufacturers and the
top 100 listed suppliers. For both,
this corresponds to a +5.7% cagr
increase since the 2009 slump. Same
story for the operating profits with
Sources: Bloomberg, Allianz Research EBIT totaling USD140bn for the
11Special Report Global Automotive by Euler Hermes Economic Research
manufacturers and USD31bn for the
suppliers in 2017, meaning an oper-
ating margin (EBIT margin) on local
currencies, on average of 5% for
manufacturers and 7.2% for equip-
ment manufacturers. We expect
operating margins to weaken in the
face of adaptation costs of short-
term challenges and to continue
presenting disparities between
countries, notably due to the differ-
ences in business models (shares of Chart 10 EBIT Margin Suppliers vs Manufacturers
premium segment versus low cost
10%
segment and shares on EV produc-
tion). Subsequently, manufacturers 9%
will continue pressuring suppliers to 8%
reduce their spread in the operating 7%
margin.
EBIT Margin 2017 6%
CAPEX under closer watch. CAPEX 5%
totaled USD140bn in 2017 – a new
4%
record high after rebounding +8% in
absolute terms when cumulating 3%
manufacturers and suppliers. In rela- 2%
tive terms, however, the intensity of
1%
the effort has already reached a
plateau since 2016, with a ratio of 0%
0% 5% 10% 15%
CAPEX to global sales at 4.8% in
2017 compared to a high at 5.3% in Revenue Growth 2015-2017 cgar
2015. We expect a decrease in profit Sources: Bloomberg, Allianz Research
margin expectations to revive debt-
sustainability concerns for some in- Chart 11 CAPEX
dustry players and force them to
reduce/postpone part of their long-
term investment plan. This context is
less supportive for mergers and ac-
quisitions (both cross and inner-
sectors), but more favorable for all
types of cooperation and partner-
ships, such as joint ventures and stra-
tegic alliances. The risk, otherwise, is
to lose ground in the competition for
autonomous vehicles and more
broadly all the new growth markets
related to mobility, while they con-
centrate revenue prospects.
Maxime Lemerle Sources: Bloomberg, Allianz Research
12September 2018
FOCUS: China’s ambition to become the
automotive worldwide center
China has already been leading the automotive market in terms of annual sales since 2008. In 2008, new car reg-
istrations in China surpassed new car registrations in the U.S., the world's former leader of the automobile market,
and has continued growing ever since. It reached a new record in 2017 and accounts for more than a third of
global vehicle sales since 2016 (compared to 18% for the U.S.). Based on the still-low equipment rate in the coun-
try, especially in rural areas, and demographically, such as the growing middle-class, China’s leadership will
strengthen in the coming years. In other words, the Chinese automotive market remains pretty young compared
to mature markets like the fleet, currently at around 200mn units and the second-hand market, currently at
12.4mn units despite a +19% surge in 2017, but it will continue to massively grow and has tremendous potential.
China also has the world’s biggest automotive factories, with many JVs and foreign manufacturers, but is not a
key exporter and importer. Domestic production of automobiles reached 29mn units in 2017 (24.8mn passenger
cars and 4.2mn commercial vehicles) thanks to more than 100 companies. Yet, more than 95% of this production
is sold in China. Foreign brands, either imported or locally-produced, represent more than 55% of domestic sales
of passenger cars and dominate the upper- and high-end sales, while domestic brands concentrate on the low
end. Exports are on the upside, but so far remain limited to 1mn units (USD72bn in 2017). The same is true for im-
ports: they reached USD74bn in 2017 but should benefit from the reduction of import duties from 25% to 15%.
Thanks to the EV transition, the next step is to become a global player with global champions, as the Japanese
did in the 90’s. (see chart 12). China already has the largest EV market both in terms of sales and fleet, with local
brands such as BAIC, BYD, JAC and Geely accounting for more than 70% of sales, while creation of EV startups
continue, partnerships with digital giants (e.x. Baidu, Alibaba and Tencent) to explore mobility solutions are in-
creasing and more than half of the capac-
ity production of Lithium-ion batteries are Chart 12 Japanese Success Story in the US
in China.
All the latest measures dedicated to both
boosting EV production and competition
(NEV scheme, relaxing foreign ownership
restrictions, etc.) as well as forcing the Chi-
nese brands to join forces might be the
crucial turning point needed to becoming
strong enough to start exploring interna-
tional markets.
Sources: JAMA, Allianz Research
13Director of Publications: Ludovic Subran, Chief Economist
Euler Hermes Allianz Economic Research
1, place des Saisons | 92048 Paris-La-Défense Cedex | France
Phone +33 1 84 11 35 64 |
A company of Allianz
http://www.eulerhermes.com/economic-research
research@eulerhermes.com
euler-hermes
eulerhermes
CAUTIONARY NOTE REGARDING FORWARD-LOOKING STATEMENTS
The statements contained herein may include prospects, statements of future expectations and other forward -looking state-
ments that are based on management's current views and assumptions and involve known and unknown risks and uncer-
tainties. Actual results, performance or events may differ materially from those expressed or implied in such forward -looking
statements.
Such deviations may arise due to, without limitation, (i) changes of the general economic conditions and competitive situa-
tion, particularly in the Allianz Group's core business and core markets, (ii) performance of financial markets (particularly
market volatility, liquidity and credit events), (iii) frequency and severity of insured loss events, including from natural catas-
trophes, and the development of loss expenses, (iv) mortality and morbidity levels and trends, (v) persistency levels, (vi) p ar-
ticularly in the banking business, the extent of credit defaults, (vii) interest rate levels, (viii) currency exchange rates includ-
ing the euro/US-dollar exchange rate, (ix) changes in laws and regulations, including tax regulations, (x) the impact of ac-
quisitions, including related integration issues, and reorganization measures, and (xi) general competitive factors, in each
case on a local, regional, national and/or global basis. Many of these factors may be more likely to occur, or more pro-
nounced, as a result of terrorist activities and their consequences.
NO DUTY TO UPDATE
The company assumes no obligation to update any information or forward-looking statement contained herein, save for any
information required to be disclosed by law.
14You can also read