STOCK STATUS UPDATE OF SCALLOP (PLACOPECTEN MAGELLANICUS) IN SCALLOP PRODUCTION AREAS 1 TO 6 IN THE BAY OF FUNDY - DFO-MPO
←
→
Page content transcription
If your browser does not render page correctly, please read the page content below
Canadian Science Advisory Secretariat
Maritimes Region                                                   Science Response 2021/005

 STOCK STATUS UPDATE OF SCALLOP (PLACOPECTEN
MAGELLANICUS) IN SCALLOP PRODUCTION AREAS 1 TO 6
               IN THE BAY OF FUNDY
                                             Context
Advice on the status of Scallop in Scallop Production Areas (SPAs) 1 to 6 in the Bay of Fundy
(BoF) is requested annually by Fisheries and Oceans Canada (DFO) Resource Management to
help determine a Total Allowable Catch (TAC, meat weight) in support of the fishery. Scallop in
SPAs 1 to 6 is assessed on a multiyear assessment schedule, with update reports produced in
interim years. The last full assessment of the BoF Scallop occurred in 2015 (DFO 2016,
Nasmith et al. 2016). A stock status update was provided for the 2018/2019 fishing season in
2018 (DFO 2019).
The objectives of this report are to: identify the consequences of different harvest levels in
SPAs 1A, 1B, 3, 4, 5, and 6 from the 2019/2020 season, provide advice on the interim harvest
levels for the start of the 2020/2021 season for SPAs 1A, 1B, 3, and 4, and identify all
information on fishery bycatch of non-target species. If information is available, identify any
notable changes in occurrence of bycatch species relative to previous years. Interim harvest
levels are provided for the following fishing year to allow the fishery to start in October prior to
final TACs being set (December). The fishery season runs from October 1 to September 30 of
the following year. Fishery data from the 2019/2020 season are preliminary (as of June 15,
2020) and do not cover the full fishing year.
This Science Response Report results from the Science Response Process of August 24, 2020,
on the Stock Status Update of Bay of Fundy Scallop in Scallop Production Areas (SPAs) 1A,
1B, and 3-6.

                                          Background
Population surveys are conducted annually by DFO Science. The population dynamics of
commercial and recruit scallops for all SPAs (Appendix 1) were modelled using a Bayesian
state-space model with modifications presented in Smith et al. (2012) and Smith and Hubley
(2014). A detailed description of survey design and strata boundaries is presented in Nasmith
et al. (2016). In this report, scallops with a shell height of 80 mm and greater are referred to as
commercial size. Scallops with a shell height of 65-79 mm are referred to as recruits and are
expected to grow to be commercial size in the following year. Scallops less than 65 mm are
defined as pre-recruits.
Scallop removals accounted for in assessments include commercial landings from all three
inshore scallop fleets, and Food, Social and Ceremonial (FSC) catch by scallop drag. There
was no FSC catch by drag caught in the BoF in the 2018/2019 fishing season (hereafter
referred to as the 2019 fishing year), or in the 2019/2020 fishing season as of June 15, 2020
(hereafter referred to as the 2020 fishing year). Landed recreational and FSC catch by dip
netting, diving, tongs, and hand are not available and are not accounted for in the assessment.

January 2021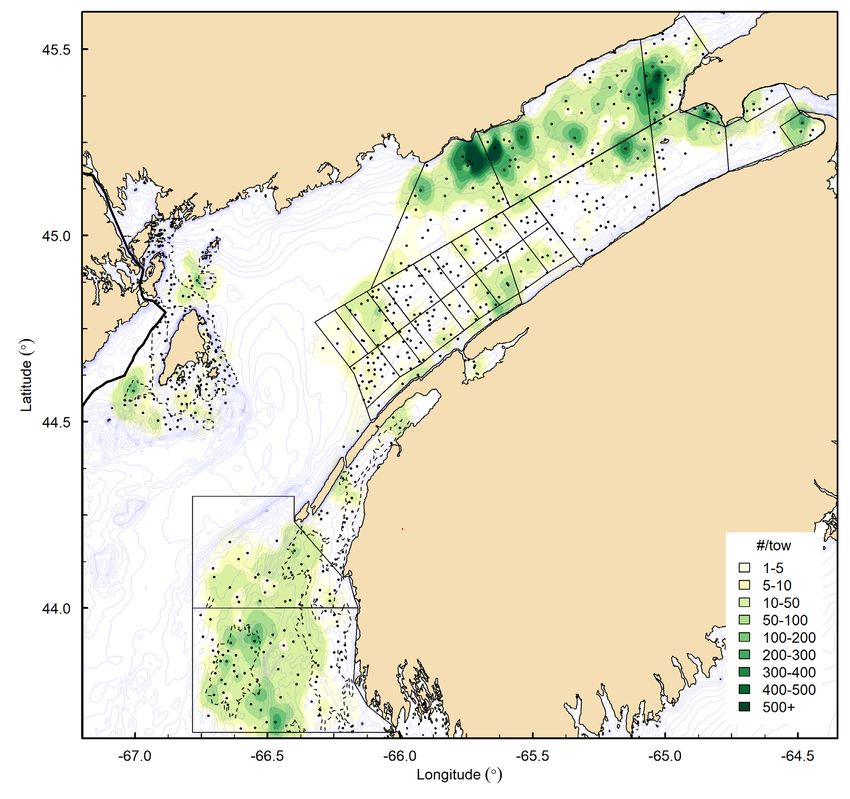
Science Response: Scallop Production
Maritimes Region Areas 1 to 6 in the Bay of Fundy
There were 4 fisheries observer trips in the BoF Scallop fishery in the 2019 fishing year and 2
fisheries observer trips in the 2020 fishing year as of June 15, 2020. Currently, there is no DFO
requirement that Scallop Fishing Areas (SFA) 28A-D (Appendix 1) trips be observed. Refer to
Sameoto and Glass (2012) for past analysis of discards from the inshore scallop fishery.
Description of the Fishery
There are three fleets (Full Bay, Mid Bay, and Upper Bay) in the inshore BoF Scallop fishery.
Full Bay license holders are permitted to fish throughout the BoF. Mid Bay license holders have
access to all areas north of the Mid Bay line. Upper Bay license holders are restricted to the
upper reaches of the Bay (Appendix 1). The fishery is managed using limited entry, drag gear
size limits, seasonal closures, minimum shell height, and meat count. The drag gear width limit
is 5.5 metres (m) with a ring size of not less than 82 mm inside diameter. The Full Bay Fleet
operates under an Individual Transferable Quota (ITQ) system, while the Mid Bay and Upper
Bay fleets fish with competitive quotas. Landings and TACs are reported in terms of meat
weights (adductor muscles).
Analysis and Response
Indicators of Stock Status
Scallop Production Area 1A Stock Status
The Full Bay Fleet caught a total of 467.49 tonnes (t) against a TAC of 455.02 t (450 t before
post-quota reconciliation) during the 2019 fishery in SPA 1A, of which 29% came from outside
the area used for the population model of SPA 1A. In the 2020 fishery as of June 15, 2020,
preliminary landings were 289.29 t against a TAC of 415 t; of which 3% have come from outside
the modelled area. Recent TAC and landings are summarized in Appendix 2. The commercial
catch rate in the 2019 fishing year was 27.7 kilograms per hour (kg/h), a decrease from 2018
(29.6 kg/h). As of June 15, 2020, the preliminary catch rate for 2020 was 26.1 kg/h.
In 2019, survey condition (measured in grams per a 100 mm shell height scallop) was 10.0 g, a
decrease from 2018 (11.4 g) and below the long-term (1997-2018) mean of 11.2 g. Pre-recruits
were observed in patches in SPA 1A; there were small pre-recruits (25-35 mm shell height) near
the northern border of Mid Bay South (Figure 1, Appendix 1; see Nasmith et al. 2016 for
detailed description of the strata). The biomass estimate of recruit scallops in 2019 was 12.1 t, a
decline from 2018 (25.3 t) and below the long-term (1997-2018) median of 58.4 t. Recruits were
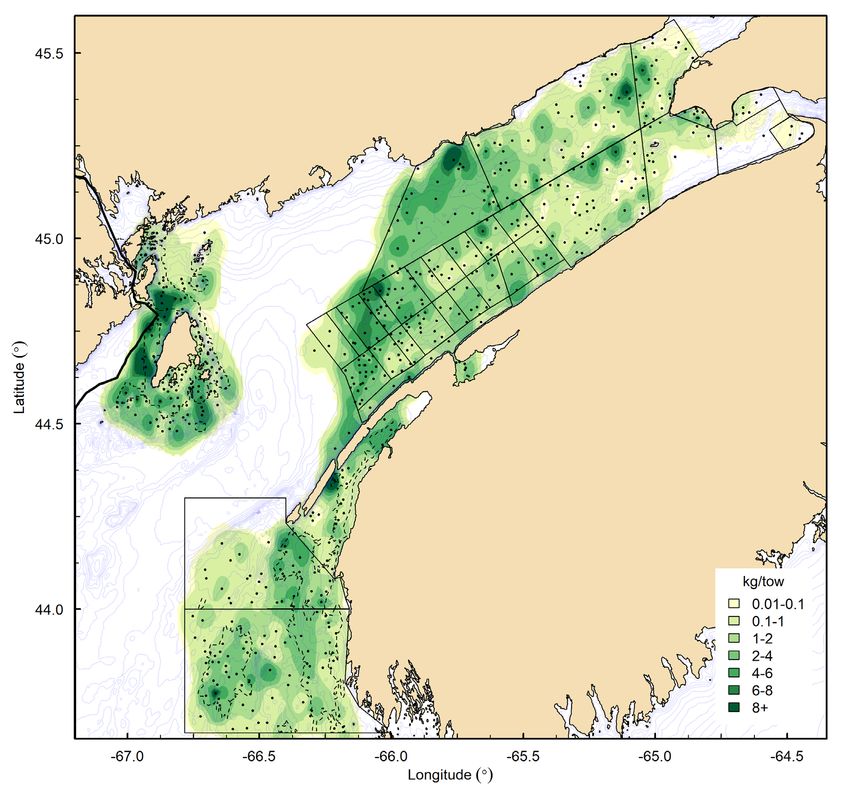
absent from large portions of SPA 1A (Figure 2). Commercial scallop biomass was
predominately observed in the 8 to 16-mile strata, with localized regions of relatively high
abundance observed in the eastern portion of the 8 to 16-mile strata and the Middle Bay South
stratum (Figure 3). The biomass estimate of commercial scallops in 2019 was 2268 t (meats), a
decline from 2018 (3365 t), but above the long-term median of 1732 t, and in the Healthy Zone
(Figure 4).
Catch scenarios for the 2019/2020 fishing season are presented in Table 1. Biomass
projections use the current year estimates of growth, and natural mortality is the average over
the last 5 years. The 2019/2020 TAC for SPA 1A was 415 t; for this catch level, Table 1 is
interpreted as follows: a catch of 415 t corresponds to an exploitaiton of 0.18 and is projected to
result in a 16% decline in commercial biomass, the probability of commercial biomass increase
is 27%, the probability that a catch of 415 t will result in the population remaining above the
Lower Reference Point (LRP) is >99%, and the probability of the population remaining above
2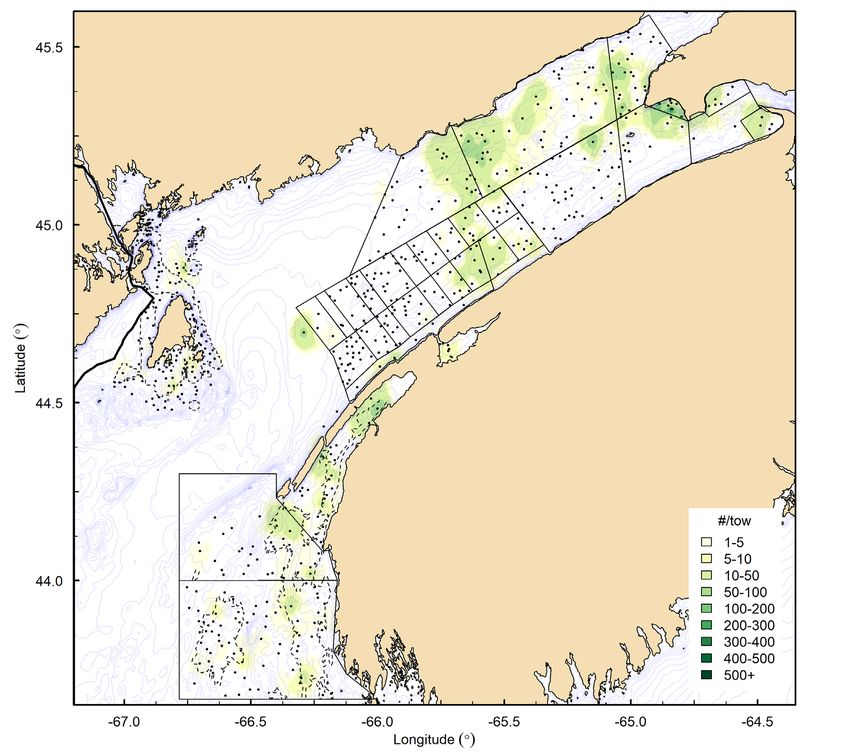
Science Response: Scallop Production
 Maritimes Region                                                 Areas 1 to 6 in the Bay of Fundy

the Upper Stock Reference (USR) is 94%. In the following fishing year (2020/2021), a catch of
172 t would have a probability of 10% of exceeding a reference exploitation of 0.15.

Figure 1. Spatial distribution (number/tow) of pre-recruit scallops (< 65 mm shell height) in the Bay of
Fundy and approaches in 2019. Dots represent survey stations. Solid black lines are survey strata;
dashed black lines are survey strata representing high (inside dashed lines) and low (outside dashed
lines) fishing effort, based on Vessel Monitoring System (VMS) analysis (see: Smith et al. 2012).

                                                      3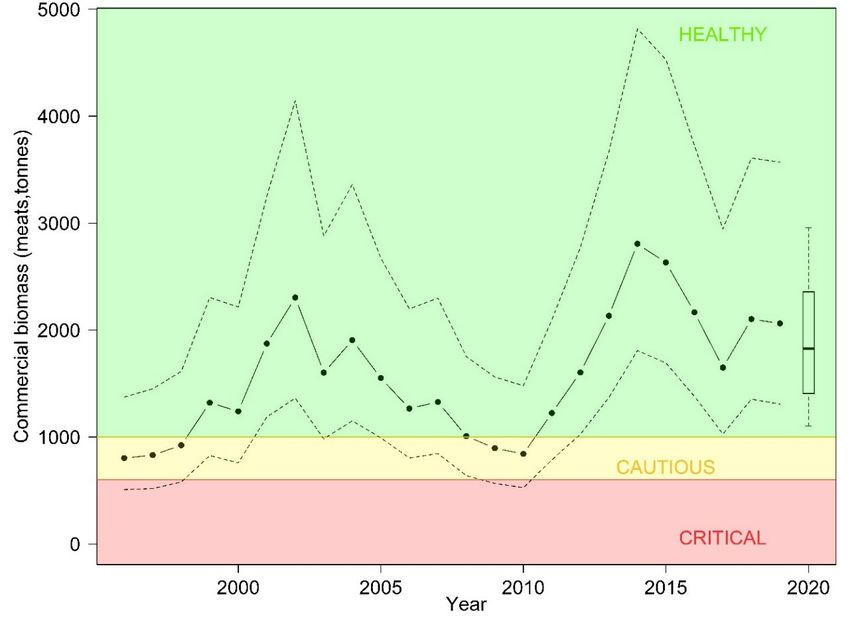
Science Response: Scallop Production
 Maritimes Region                                                Areas 1 to 6 in the Bay of Fundy

Figure 2. Spatial distribution (number/tow) of recruit scallops (65-79 mm shell height) in the Bay of Fundy
and approaches in 2019. Dots represent survey stations. Solid black lines are survey strata; dashed black
lines are survey strata representing high (inside dashed lines) and low (outside dashed lines) fishing
effort, based on Vessel Monitoring System (VMS) analysis (see: Smith et al. 2012).

                                                     4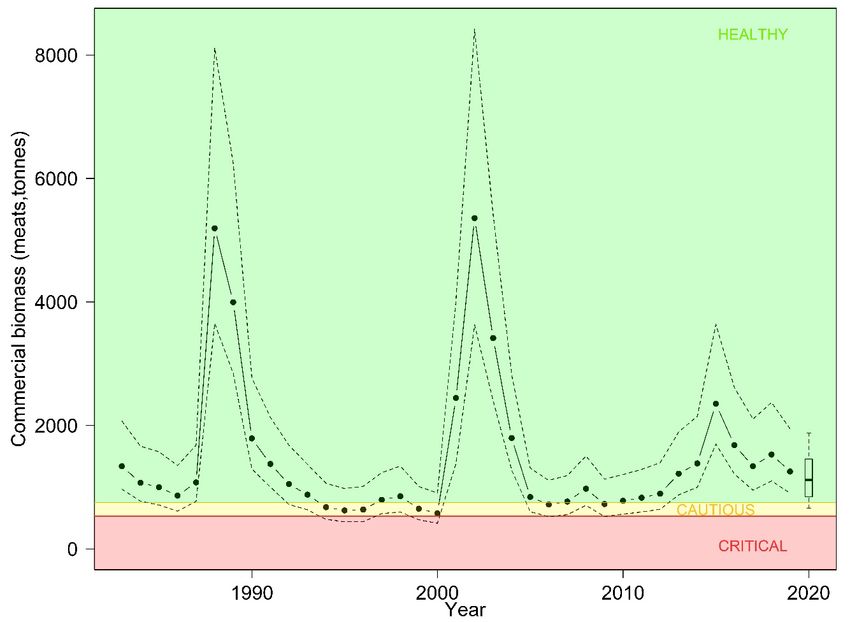
Science Response: Scallop Production
 Maritimes Region                                               Areas 1 to 6 in the Bay of Fundy

Figure 3. Spatial distribution of commercial (≥ 80 mm shell height) biomass (kg/tow) in the Bay of Fundy
and approaches in 2019. Dots represent survey stations. Solid black lines are survey strata; dashed black
lines are survey strata representing high (inside dashed lines) and low (outside dashed lines) fishing
effort, based on Vessel Monitoring System (VMS) analysis (see: Smith et al. 2012).

                                                    5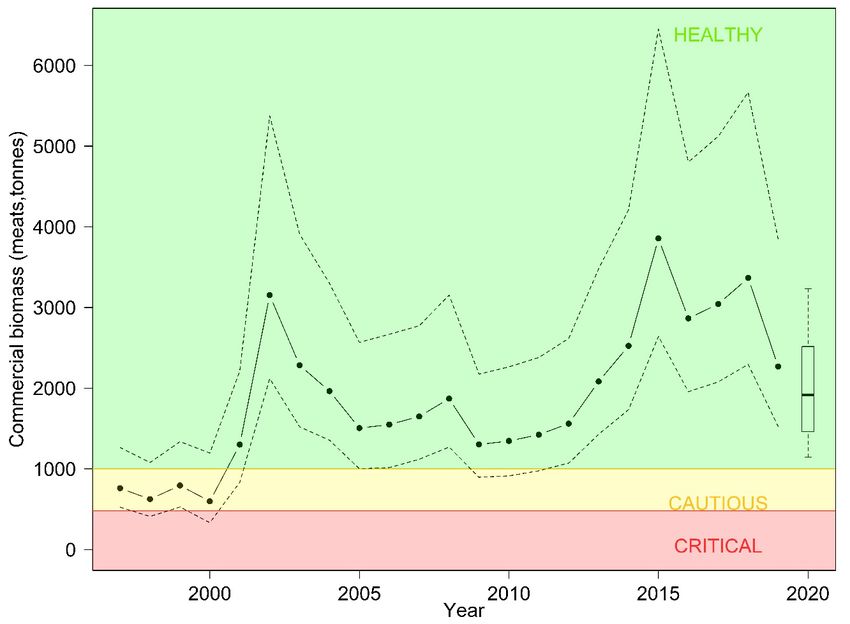
Science Response: Scallop Production
 Maritimes Region                                                       Areas 1 to 6 in the Bay of Fundy

Figure 4. Median biomass estimates in SPA 1A for commercial size scallops in meat weight (tonnes) from
the assessment model fit to the survey and commercial data. Dashed lines are the upper and lower 95%
credible limits on the estimates. The predicted commercial size biomass for 2020, assuming the
2019/2020 TAC of 415 t, is displayed as a box plot with median, 50% credible limits (box) and 80%
credible limits (whiskers). The green-shaded area represents the Healthy Zone (based on an Upper Stock
Reference (USR) of 1000 t), the yellow-shaded area represents the Cautious Zone, and red-shaded area
represents the Critical Zone (based on Lower Reference Point (LRP) of 480 t; Nasmith et al. 2014).

Table 1. Harvest scenario table for SPA 1A to evaluate 2019/2020 catch levels in terms of resulting
exploitation (e), expected changes in commercial biomass (%), probability (Pr) of commercial biomass
increase, probability that after removal the stock will be above the Upper Stock Reference (USR; 1000 t),
and above the Lower Reference Point (LRP; 480 t). Potential catches (t) in 2020/2021 are evaluated in
terms of the posterior probability of exceeding an exploitation rate of 0.15. The catch level and associated
scenario that corresponds to the TAC from 2019/2020 is shown in bold.
               2019/2020 Fishing Season                                2020/2021 Fishing Season

                                                                     Probability Exploitation >0.15
 Catch     e       %          Pr       Pr       Pr
                                                                          Potential Catch (t)
  (t)            Change    Increase   >LRP     >USR
                                                            0.1       0.2     0.3     0.4      0.5     0.6
  290    0.12      -11       0.34     >0.99     0.96       186       221     250     278      307     339
  315    0.14      -12       0.33     >0.99     0.96       183       219     248     275      304     336
  340    0.15      -13       0.31     >0.99     0.96       180       215     244     272      300     330
  365    0.16      -14       0.29     >0.99     0.95       178       212     240     268      295     326
  390    0.17      -15       0.28     >0.99     0.95       175       209     237     263      292     323
  415    0.18      -16       0.27     >0.99     0.94       172       205     234     260      288     319

                                                       6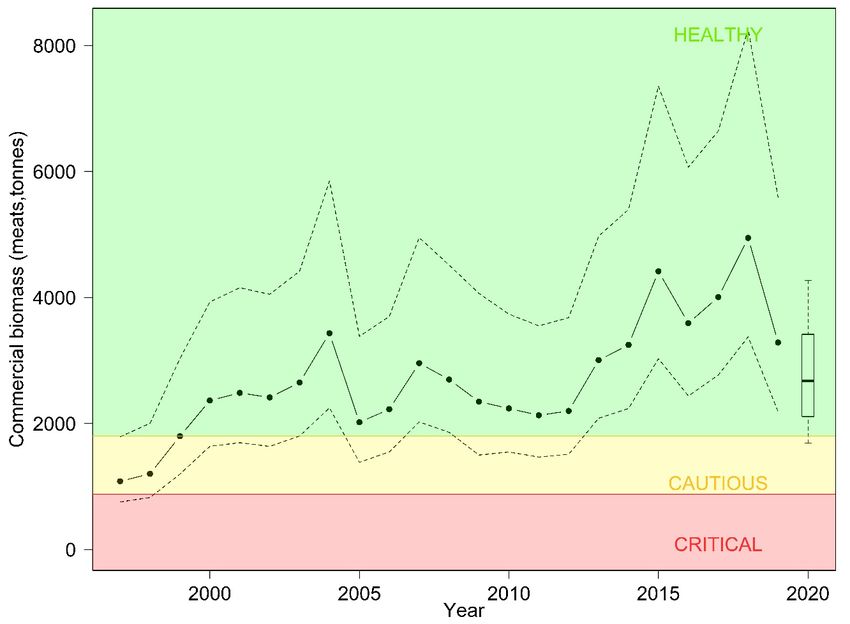
Science Response: Scallop Production
 Maritimes Region                                           Areas 1 to 6 in the Bay of Fundy

   Scallop Production Area 1B Stock Status
The total 2019 landings for all fleets in SPA 1B was 739.85 t against a combined TAC of
772.89 t (750 t before post-quota reconciliation). The Full Bay Fleet caught 380.85 t against a
quota of 384.87 t (380.63 before post-quota reconciliation), the Mid Bay Fleet caught 301.25 t
against a quota of 290.99 t (267.90 t before post quota-reconciliation), and the Upper Bay Fleet
caught 57.75 t against a quota of 97.03 t (101.48 t before post-quota reconciliation). In the 2020
fishery as of June 15, 2020, Full Bay Fleet has caught 191.89 t against a quota of 304.50 t, Mid
Bay Fleet has caught 206.20 t against a quota of 212.92 (214.32 t before post-quota
reconciliation), and Upper Bay Fleet has caught 21.07 t against a quota of 96.40 t (81.18 t
before post-quota reconciliation). Recent TAC and landings are summarized in Appendix 2.
Catch rates in SFA 28B decreased from 40.7 kg/h in 2018 to 32.4 kg/h in 2019 for the Full Bay
Fleet and 38.3 kg/h to 31.3 kg/h for the Mid Bay Fleet. As of June 15, 2020, preliminary catch
rates for 2020 in SFA 28B were 26.8 kg/h for Full Bay and 20.1 kg/h for Mid Bay. In SFA 28C,
catch rates for the Upper Bay Fleet decreased from 18.5 kg/h in 2018 to 16.3 kg/h in 2019, and
were 35.9 kg/h in 2019 for the Mid Bay Fleet. The Full Bay Fleet did not fish SFA 28C in 2019.
As of June 15th, 2020, there has been no fishing by the Full Bay Fleet in SFA 28C in the 2020
fishing year and not enough records from the Mid Bay Fleet to report a catch rate for this
subarea due to Privacy Act considerations. Preliminary 2020 catch rates for SFA 28C are
13.5 kg/h for the Upper Bay Fleet. In SFA 28D, catch rates for the Upper Bay Fleet remained
similar between 2018 and 2019 (16.9 kg/h and 17.0 kg/h, respectively). There are not enough
records from the Full Bay Fleet in 2019 to summarize these data for this subarea. As of June
15, 2020, the 2020 catch rate for the Upper Bay Fleet in SFA 28D was 11.8 kg/h, and there has
been no fishing by the Full Bay Fleet.
Condition from the survey declined throughout SPA 1B in 2019. Over the entire SPA 1B,
condition declined from 11.1 g in 2018 to 10.1 g in 2019, and it was below the long-term (1997-
2018) mean of 11.6 g. Pre-recruits were observed throughout SPA 1B, with the highest
densities in Advocate Harbour (28D), SFA 28C, and along the boundary between Mid Bay North
and Cape Spencer (28B; Figure 1, Appendix 1; see Nasmith et al. 2016 for detailed description
of the strata). The biomass estimate of recruit scallops in 2019 was 84.5 t, a decrease from
96.3 t in 2018, and below the long-term (1997-2018) median of 144.2 t. Recruits were observed
in all subareas of SPA 1B (Figure 2). Commercial biomass was spread throughout SPA 1B with
the beds of highest biomass observed in Cape Spencer (28B) (Figure 3). The biomass estimate
of commercial scallops in 2019 was 3286 t (meats), which was lower than 2018 (4945 t), above
the long-term median of 2593 t, and in the Healthy Zone (Figure 5).
Catch scenarios for the 2019/2020 fishing season are presented in Table 2. Biomass
projections use the current year estimates of growth, and natural mortality is the average over
the last 5 years. The 2019/2020 TAC for SPA 1B was 614 t; the catch level from Table 2 that
corresponds most closely is 615 t and is interpreted as follows: a catch of 615 t corresponds to
an exploitaiton of 0.19 and is projected to result in a 19% decline in commercial biomass, the
probability of commercial biomass increase is 17%, the probability that a catch of 615 t will
result in the population remaining above the Lower Reference Point (LRP) is >99%, and the
probability of the population remaining above the Upper Stock Reference (USR) is 87%. In the
following fishing year (2020/2021), a catch of 254 t would have a probability of 10% of
exceeding a reference exploitation of 0.15.

                                                7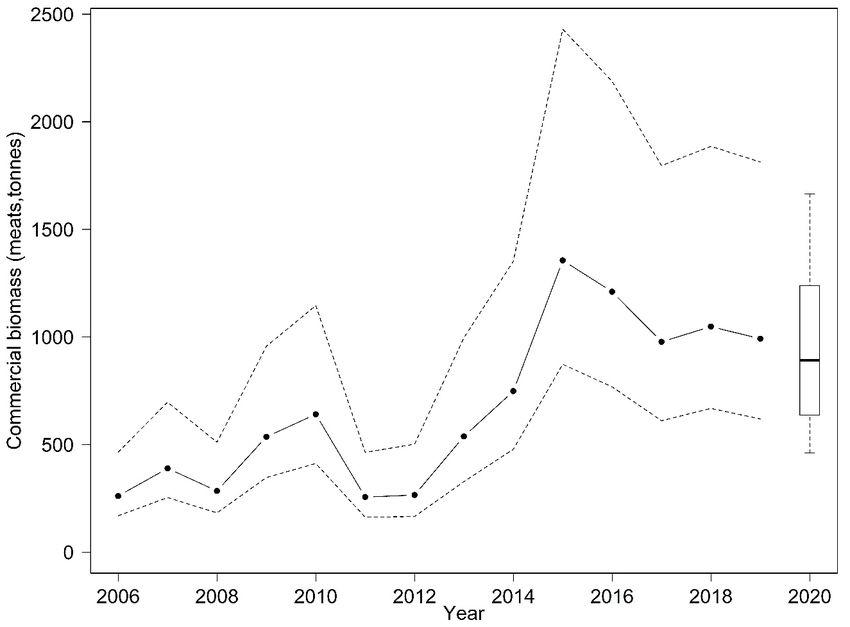
Science Response: Scallop Production
 Maritimes Region                                                       Areas 1 to 6 in the Bay of Fundy

Figure 5. Median biomass estimates in SPA 1B for commercial size scallops in meat weight (tonnes) from
the assessment model fit to the survey and commercial data. Dashed lines are the upper and lower 95%
credible limits on the estimates. The predicted commercial size biomass for 2020, assuming the
2019/2020 TAC of 614 t, is displayed as a box plot with median, 50% credible limits (box), and 80%
credible limits (whiskers). The green-shaded area represents the Healthy Zone (based on an Upper Stock
Reference of 1800 t), the yellow-shaded area represents the Cautious Zone, and the red-shaded area is
the Critical Zone (based on a Lower Reference Point of 880 t; Nasmith et al. 2014).

Table 2. Harvest scenario table for SPA 1B to evaluate 2019/2020 catch levels in terms of resulting
exploitation (e), expected changes in commercial biomass (%), probability (Pr) of commercial biomass
increase, probability that after removal the stock will be above the Upper Stock Reference (USR; 1800 t),
and above the Lower Reference Point (LRP; 880 t). Potential catches (t) in 2020/2021 are evaluated in
terms of the posterior probability of exceeding an exploitation rate of 0.15. The catch level and associated
scenario that corresponds most closely to the TAC from 2019/2020 is shown in bold.
               2019/2020 Fishing Season                                2020/2021 Fishing Season
                                                                     Probability Exploitation >0.15
 Catch     e       %          Pr       Pr       Pr
                                                                           Potential Catch (t)
  (t)            Change    Increase   >LRP     >USR
                                                            0.1       0.2     0.3      0.4      0.5    0.6
  405    0.12      -13       0.26     >0.99     0.92       279       324     362      397      433    472
  435    0.13      -14       0.25     >0.99     0.91       275       320     357      392      428    467
  465    0.14      -15       0.24     >0.99     0.90       271       315     353      389      424    463
  495    0.15      -16       0.22     >0.99     0.90       268       313     350      385      420    457
  525    0.16      -17       0.21     >0.99     0.89       264       308     344      379      414    454
  555    0.17      -18       0.19     >0.99     0.88       261       305     341      374      409    448
  585    0.18      -19       0.18     >0.99     0.87       256       301     337      370      406    445
  615    0.19      -19       0.17     >0.99     0.87       254       298     334      367      401    440

                                                       8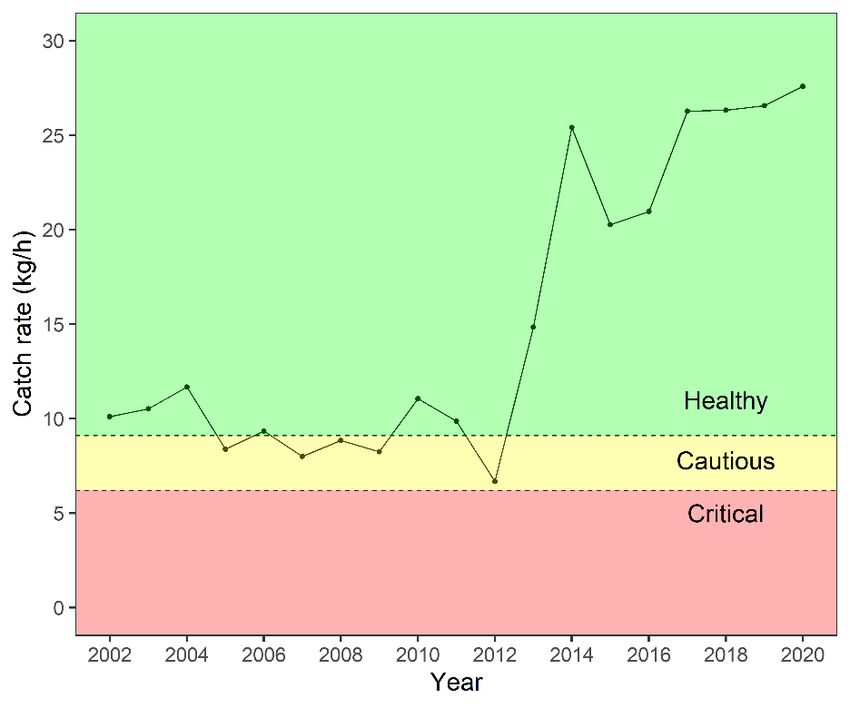
Science Response: Scallop Production
 Maritimes Region                                          Areas 1 to 6 in the Bay of Fundy

   Scallop Production Area 2
Scallop Production Area 2 is considered to be marginal habitat for scallops and is not monitored
regularly. This area was last assessed in 2006 (DFO 2007).
   Scallop Production Area 3 Stock Status
Total landings for the 2019 fishing year in SPA 3 were 75.46 t against a TAC of 125 t. In the
2020 fishery (as of June 15, 2020), preliminary landings were 36.81 t against a TAC of 175 t.
Recent TAC and landings are summarized in Appendix 2. The commercial catch rate in 2019 for
St. Mary’s Bay was 23.3 kg/h, an increase from 2018 (20.1 kg/h). Summer catch rates for SPA 3
outside of St. Mary’s Bay (Brier/Lurcher area; see Nasmith et al. 2016) in 2019 were 17.2 kg/h,
a decrease from 2018 (18.0 kg/h). In accordance with Privacy Act considerations, there are not
enough fishing records from SPA 3 outside of St. Mary’s Bay to summarize these data for the
fall of 2018. For the 2020 fishing year (as of June 15, 2020), the preliminary catch rate for St.
Mary’s Bay is 30.7 kg/h. In SPA 3, outside of St. Mary’s Bay, the catch rate for the fall of 2019
was 24.2 kg/h. As of June 15, 2020, there are not enough records from the area of SPA 3
outside of St. Mary’s Bay to summarize for the summer of 2020 in accordance with the Privacy
Act.
The survey and analysis for SPA 3 is based on two areas defined by Vessel Monitoring System
(VMS) fishing patterns from 2002-2010 (Smith et al. 2012). The highest condition was observed
in St. Mary’s Bay (13.8 g). In 2019, condition for SPA 3 within the modelled area (11.4 g)
increased from 2018 (10.9 g) and was above the long-term (1996-2018) mean of 11.1 g. Pre-
recruits were predominately observed west of 66.4˚W (Figure 1). The biomass estimate of
recruit scallops for 2019 was 42.1 t, an increase from 2018 (31.4 t), and below the long-term
(1996-2018) median of 63.5 t. Recruits were found in low abundances in isolated patches that
were largely confined to the Inside VMS area (Figure 2). Commercial biomass was distributed
throughout SPA 3 with higher biomass within the Inside VMS areas (Figure 3). The biomass
estimate of commercial scallops in 2019 was 2062 t (meats), similar to 2018 (2103 t), above the
long-term median of 1488 t, and in the Healthy Zone (Figure 6).
Catch scenarios for the 2019/2020 fishing season are presented in Table 3. Biomass
projections use the current year estimates of growth, and natural mortality is the average over
the last 5 years. The 2019/2020 TAC for SPA 3 was 175 t; from Table 3 a catch of 175 t
corresponds to an exploitation of 0.09 and is projected to result in a 13% decline in commercial
biomass, the probability of commercial biomass increase is 30%, the probability that a catch of
175 t will result in the population remaining above the Lower Reference Point (LRP) is >99%,
and the probability of the population remaining above the Upper Stock Reference (USR) is 94%.
In the following fishing year (2020/2021), a catch of 166 t would have a 10% probability of
exceeding a reference exploitation of 0.15.

                                               9
Science Response: Scallop Production
Maritimes Region Areas 1 to 6 in the Bay of Fundy
Figure 6. Median biomass estimates in SPA 3 for commercial size scallops in meat weight (tonnes) from
the assessment model fit to the survey and commercial data. Dashed lines are the upper and lower 95%
credible limits on the estimates. The predicted commercial size biomass for 2020, assuming the
2019/2020 TAC of 175 t, is displayed as a box plot with median, 50% credible limits (box), and 80%
credible limits (whiskers). The green-shaded area represents the Healthy Zone (based on an Upper Stock
Reference of 1000 t), the yellow-shaded area represents the Cautious Zone, and the red-shaded area
represents the Critical Zone (based on Lower Reference Point of 600 t; Nasmith et al. 2014).
Table 3. Harvest scenario table for SPA 3 to evaluate 2019/2020 catch levels in terms of resulting
exploitation (e), expected changes in commercial biomass (%), probability (Pr) of commercial biomass
increase, probability that after removal the stock will be above the Upper Stock Reference (USR; 1000 t),
and above the Lower Reference Point (LRP; 600 t). Potential catches (t) in 2020/2021 are evaluated in
terms of the posterior probability of exceeding an exploitation rate of 0.15. The catch level and associated
scenario that corresponds to the TAC from 2019/2020 is shown in bold.
2019/2020 Fishing Season 2020/2021 Fishing Season
Probability Exploitation >0.15
Catch e % Pr Pr Pr
Potential Catch (t)
(t) Change Increase >LRP >USR
0.1 0.2 0.3 0.4 0.5 0.6
100 0.05 -9 0.36 >0.99 0.95 174 208 235 260 285 313
125 0.06 -10 0.34 >0.99 0.95 172 204 231 256 281 310
150 0.08 -11 0.32 >0.99 0.94 169 202 228 253 279 307
175 0.09 -13 0.30 >0.99 0.94 166 198 224 249 274 302
200 0.10 -14 0.29 >0.99 0.93 164 195 221 246 271 299
225 0.11 -15 0.27 >0.99 0.92 160 192 218 243 268 295
250 0.13 -16 0.25 >0.99 0.92 159 190 215 239 263 290
275 0.14 -17 0.24 >0.99 0.91 155 186 212 236 261 288
300 0.15 -18 0.23 >0.99 0.91 152 183 208 232 257 284
10Science Response: Scallop Production
Maritimes Region Areas 1 to 6 in the Bay of Fundy
Scallop Production Areas 4 and 5 Stock Status
As of the 2014 fishing year, SPA 5 was joined with SPA 4 under one TAC. Total landings in the
2019 fishing year were 105.64 t in SPA 4 and 7.45 t in SPA 5 against a combined TAC of
124.56 t (125 t before post-quota reconciliation). For the 2020 fishing year as of June 15, 2020,
preliminary landings were 111.33 t in SPA 4 and 15.72 t in SPA 5 against a combined TAC of
135 t. Recent TAC and landings are summarized in Appendix 2. Commercial catch rates in SPA
4 and SPA 5 increased from 2018 to 2019, from 24.0 kg/h to 30.9 kg/h and 22.7 kg/h to
29.9 kg/h, respectively. In the 2020 fishing year as of June 15, 2020, catch rates were 28.7 kg/h
in SPA 4 and 28.1 kg/h in SPA 5.
Condition in SPA 4 decreased from 11.5 g in 2018 to 10.0 g in 2019 and was below the long-
term (1996-2018) mean of 11.1 g. Pre-recruit abundances were low throughout most of SPA 4
and were mostly observed towards the east of SPA 4 (Figure 1, Appendix 1; see Nasmith et al.
2016 for detailed description of the strata). The biomass estimate of recruit scallops in 2019 was
9.2 t, similar to 2018 (7.0 t) and below the long-term (1983-2018) median of 31.8 t. Recruits
were mainly observed in the east (Figure 2), whereas the distribution of commercial biomass
was relatively uniform throughout the area (Figure 3). The biomass estimate of commercial
scallops in 2019 was 1252 t (meats), a decline from 2018 (1528 t), above the long-term median
of 1061 t, and in the Healthy Zone (Figure 7).
Catch scenarios for the 2019/2020 fishing season are presented in Table 4. Biomass
projections use the current year estimates of growth, and natural mortality is the average over
the last 5 years. The 2019/2020 TAC for SPA 4 was 135 t; from Table 4 a catch of 135 t
corresponds to an exploitation of 0.11 and is projected to result in a 12% decline in commercial
biomass, the probability of commercial biomass increase is 35%, the probability that a catch of
135 t will result in the population remaining above the Lower Reference Point (LRP) is 97%, and
the probability of the population remaining above the Upper Stock Reference (USR) is 84%. In
the following fishing year (2020/2021), a catch of 99 t would have a probability of 10% of
exceeding a reference exploitation of 0.15.
11Science Response: Scallop Production
Maritimes Region Areas 1 to 6 in the Bay of Fundy
Figure 7. Median biomass estimates in SPA 4 for commercial size scallops in meat weight (tonnes) from
the assessment model fit to the survey and commercial data. Dashed lines are the upper and lower 95%
credible limits on the estimates. The predicted commercial size biomass for 2020, assuming the
2019/2020 TAC of 135 t, is displayed as a box plot with median, 50% credible limits (box), and 80%
credible limits (whiskers). The green-shaded area represents the Healthy Zone (based on an Upper Stock
Reference of 750 t), the yellow-shaded area represents the Cautious Zone, and the red-shading area
represents the Critical Zone (based on Lower Reference Point of 530 t; Nasmith et al. 2014).
Table 4. Harvest scenario table for SPA 4 to evaluate 2019/2020 catch levels in terms of resulting
exploitation (e), expected changes in commercial biomass (%), probability (Pr) of commercial biomass
increase, probability that after removal the stock will be above the Upper Stock Reference (USR; 750 t),
and above the Lower Reference Point (LRP; 530 t). Potential catches (t) in 2020/2021 are evaluated in
terms of the posterior probability of exceeding an exploitation rate of 0.15. The catch level and associated
scenario that corresponds to the TAC from 2019/2020 is shown in bold.
2019/2020 Fishing Season 2020/2021 Fishing Season
Probability Exploitation >0.15
Catch e % Pr Pr Pr
Potential Catch (t)
(t) Change Increase >LRP >USR
0.1 0.2 0.3 0.4 0.5 0.6
95 0.08 -9 0.39 0.97 0.86 103 124 140 157 173 192
115 0.09 -11 0.37 0.97 0.85 102 121 138 154 170 188
135 0.11 -12 0.35 0.97 0.84 99 119 135 151 167 184
155 0.13 -14 0.33 0.96 0.82 97 116 132 148 163 181
175 0.14 -15 0.31 0.96 0.81 95 114 130 145 161 179
195 0.16 -17 0.30 0.95 0.80 93 112 127 142 158 175
12Science Response: Scallop Production
Maritimes Region Areas 1 to 6 in the Bay of Fundy
The annual survey in SPA 5 was discontinued in 2009 after consultation with industry, and the
sampling effort was redirected to other areas in the BoF. Since the 2014 survey, a small number
of tows have been conducted in SPA 5 annually. The average number of commercial size
scallop declined, from 217.7 scallops per tow (scallops/tow) in 2018 to 130.1 per tow in 2019,
and it is above the long-term (1990-2018) median of 104.4 per tow. The weight per tow
declined, from 3.0 kilograms per tow (kg/tow) in 2018 to 1.9 kg/tow in 2019, and it is near the
long-term (1990-2018) median of 1.8 kg/tow. The average number of recruit sized scallops per
tow (recruits/tow) declined from 15.8 per tow in 2018 to 6.2 per tow in 2019 and is below the
long-term (1990-2018) recruit median of 26.9 recruits/tow. Recruit weight per tow declined, from
0.08 kg/tow in 2018 to 0.03 kg/tow in 2019, and it is below the long-term (1990-2018) recruit
median of 0.1 kg/tow.
Scallop Production Area 6 Stock Status
Total landings in SPA 6 for Full Bay and Mid Bay fleets in the 2019 fishing year were 214.53 t
against a combined TAC of 216.20 t (200 t before post-quota reconciliation). The Full Bay Fleet
caught 32.66 t against a quota of 30.34 t (30 t before post-quota reconciliation), and the Mid Bay
Fleet caught 181.87 t against a quota of 185.86 t (170 t before post-quota reconciliation).
Preliminary landings for the 2020 fishing year (as of June 15, 2020) for both fleets in SPA 6 are
212.20 t against a combined TAC of 204.37 t. The Full Bay Fleet caught 29.88 t against a quota
of 30 t and the Mid Bay Fleet caught 182.32 t against a quota of 174.37 t (170 t before post-
quota reconciliation). Recent TAC and landings are summarized in Appendix 2.
The commercial catch rate series starting in 1997 for all subareas combined is the stock status
indicator for this area, the LRP is 6.2 kg/h, the lowest catch rate observed in the time series
since 1997, and the USR is 9.1 kg/h based on the average catch rate from 2005 to 2011. The
stock status indicator catch rate was above the USR and in the Healthy Zone in 2018
(26.3 kg/h), 2019 (26.6 kg/h), and 2020 (27.6 kg/h) (Figure 8). Catch rates from 1997 to 2001
are not presented in Figure 8 due to a change in the commercial log system implemented in
2002.
The survey and analysis for SPA 6 is based on two areas defined by VMS fishing patterns from
2002-2014 (Smith et al. 2012; Nasmith et al. 2016). Indices were calculated separately for the
fished area (Inside VMS stratum) and the unfished areas (Outside VMS stratum). Condition in
the Inside VMS stratum was 9.6 g in 2019, a decrease from 2018 (10.3 g) and below the long-
term (1997-2018) mean of 10.9 g. Condition in the Outside VMS stratum in 2019 was 9.5 g, a
decrease from 2018 (10.2 g) and below the long-term (1997-2018) mean of 10.8 g. In 2019, pre-
recruit abundances were low throughout most of SPA 6 (Figure 1, Appendix 1). The modelled
area for SPA 6 is for the Inside VMS stratum only. In 2019, recruit biomass was 5.3 t, a
decrease from 14.7 t in 2018 and below the long-term (2006-2018) median of 50.8 t. Recruit
abundances were low throughout the area (Figure 2), whereas commercial biomass was well
distributed throughout the surveyed area with higher biomasses observed west of Grand Manan
(Figure 3). The biomass estimate of commercial scallops in 2019 was 992 t (meats), a decrease
from 2018 (1048 t) and above the long-term median of 568 t (Figure 9).
Usable logbook data was spatially allocated by its reported latitude and longitude to either the
Inside or Outside VMS strata or designated as not falling within a strata, and it was then used to
determine the proportion of landings between areas as per the methods described in Nasmith et
al. (2016). In 2019, the proportion of landings were 74%, 15%, and 11% for the Inside VMS
stratum, Outside VMS stratum, and not falling within a strata, respectively. In 2020, the
proportion of landings were 76%, 11%, and 13% for the Inside VMS stratum, Outside VMS
stratum, and not falling within a strata, respectively.
13Science Response: Scallop Production
Maritimes Region Areas 1 to 6 in the Bay of Fundy
Catch scenarios for 2019/2020 are presented in Table 5. Biomass projections use the current
year estimates of growth, and natural mortality is the average over the last 5 years. The
2019/2020 estimated removals from the modelled area was 161 t; the catch level from Table 5
that corresponds most closely is 160 t and is interpreted as follows: a catch of 160 t
corresponds to an exploitation of 0.15 and is projected to result in a 11% decline in commercial
biomass, the probability of commercial biomass increase is 37%.
Figure 8. Annual commercial catch rate (kilogram/hour [kg/h]) for SPA 6 for all subareas and both fleets
combined. The green-shaded area represents the Healthy Zone (based on an Upper Stock Reference of
9.1 kg/h), the yellow-shaded area represents the Cautious Zone, and the red-shaded area represents the
Critical Zone (based on Lower Reference Point of 6.2 kg/h).
14Science Response: Scallop Production
Maritimes Region Areas 1 to 6 in the Bay of Fundy
Figure 9. Median biomass estimates (solid line) in the SPA 6 modelled area for commercial size scallops
in meat weight (tonnes) from the assessment model fit to the survey and commercial data. Dashed lines
are the upper and lower 95% credible limits on the estimates. The predicted commercial size biomass for
2020, assuming a catch of 161 t in 2020, is displayed as a box plot with median, 50% credible limits
(box), and 80% credible limits (whiskers).
Table 5. Harvest scenario table for SPA 6 to evaluate 2019/2020 catch levels in terms of resulting
exploitation (e), expected changes in commercial biomass (%), and probability (Pr) of commercial
biomass increase.
2019/2020 Fishing Season
Catch e % Pr
(t) Change Increase
100 0.10 -5 0.44
120 0.11 -8 0.42
140 0.13 -10 0.40
160 0.15 -11 0.37
180 0.17 -14 0.35
200 0.19 -16 0.33
Ecosystem Considerations
There were 4 fisheries observer trips in the BoF Scallop fishery in the 2019 fishing year and 2
as of June 15, 2020, in the 2020 fishing year. Due to Privacy Act considerations, discard rates
for bycatch cannot be reported. Currently, there is no DFO requirement that SFAs 28A-D trips
15Science Response: Scallop Production
Maritimes Region Areas 1 to 6 in the Bay of Fundy
be observed. Refer to Sameoto and Glass (2012) for past analysis of discards from the inshore
scallop fishery.
Conclusions
From 2018 to 2019, scallop condition decreased in all SPAs with the exception of SPA 3 in
which condition increased. The biomass estimate of recruit scallops in 2019 decreased in SPAs
1A, 1B, and 6, was similar to 2018 in SPA 4, and increased in SPA 3. Commercial biomass
decreased in all modelled SPAs with the exception of SPA 3, which remained similar to 2018. In
2019, estimates of commercial biomass for all SPAs remained in the Healthy Zone; however,
recruitment for all SPAs was below their respective long-term medians and coincident with low
levels of pre-recruits.
Contributors
Name Affiliation
Jessica Sameoto (Lead) DFO Science, Maritimes
Jamie Raper DFO Science, Maritimes
Freya Keyser DFO Science, Maritimes
Leslie Nasmith DFO Science, Maritimes
David Keith DFO Science, Maritimes
Brad Hubley DFO Science, Maritimes
Irene Andrushchenko DFO Science, Maritimes
Lottie Bennett DFO Science, Maritimes
Alan Reeves DFO Fisheries Management, Maritimes
Approved by
Alain Vézina
Regional Director of Science
DFO Maritimes Region
Dartmouth, Nova Scotia
Ph. 902-426-3490
Date: August 31, 2020
Sources of Information
DFO. 2007. Stock Assessment Report on Scallops (Placopecten magellanicus) in Scallop
Production Areas 1 to 6 in the Bay of Fundy. DFO Can. Sci. Advis. Sec. Sci. Advis. Rep.
2007/013.
DFO. 2016. Assessment of Scallops (Placopecten magellanicus) in Scallop Production Areas 1
to 6 in the Bay of Fundy. DFO Can. Sci. Advis. Sec. Sci. Advis. Rep. 2016/004.
DFO. 2019. Stock Status Update of Scallop (Placopecten magellanicus) in Scallop Production
Areas 1 to 6 in the Bay of Fundy. DFO Can. Sci. Advis. Sec. Sci. Resp. 2019/039.
Nasmith, L., Sameoto, J., and Glass, A. 2016. Scallop Production Areas in the Bay of Fundy:
Stock Status for 2015 and Forecast for 2016. DFO Can. Sci. Advis. Sec. Res. Doc.
2016/021. vi + 140 p.
16Science Response: Scallop Production
Maritimes Region Areas 1 to 6 in the Bay of Fundy
Nasmith, L., Hubley, B., Smith, S.J., and Glass, A. 2014. Scallop Production Areas in the Bay of
Fundy: Stock Status for 2013 and Forecast for 2014. DFO Can. Sci. Advis. Sec. Res. Doc.
2014/016. vii + 139 p.
Sameoto, J.A., and Glass, A. 2012. An Overview of Discards from the Canadian Inshore Scallop
Fishery in SFA 28 and SFA 29 West for 2002 to 2009. Can. Tech. Rep. Fish. Aquat. Sci.
2979. vi + 39 p.
Smith, S.J., and Hubley. B. 2014. Impact of Survey Design Changes on Stock Assessment
Advice: Sea Scallops. ICES J. Mar. Sci. 71: 320–327.
Smith, S.J., Hubley, P.B., Nasmith, L., Sameoto, J.A., Bourdages, H., and Glass, A. 2012.
Scallop Production Areas in the Bay of Fundy: Stock Status for 2011 and Forecast for 2012.
DFO Can. Sci. Advis. Sec. Res. Doc. 2012/009. vii +123 p.
17Science Response: Scallop Production
Maritimes Region Areas 1 to 6 in the Bay of Fundy
Appendices
Appendix 1
Map of Scallop Production Areas (SPAs) and Scallop Fishing Areas (SFAs) in the Bay of Fundy
and approaches.
18Science Response: Scallop Production
Maritimes Region Areas 1 to 6 in the Bay of Fundy
Appendix 2
Summary of Total Allowable Catch (TAC) and landings in tonnes (t), for Full Bay, Mid Bay, and
Upper Bay fleets by Scallop Production Area (SPA) for 2015 to 2020. Landing values in 2020
are preliminary (as of June 15, 2020) and are post-quota reconciliation.
Area Fleet 2015 2016 2017 2018 2019 2020
SPA 1A Full Bay Landings 361.55 422.31 395.88 427.15 467.49 289.29
TAC 350 425 400 419.79 455.02 415
SPA 1B Full Bay Landings 303.96 314.04 235.95 297.95 380.85 191.89
TAC 301.76 312.21 243.60 292.93 384.87 304.50
SPA 1B Mid Bay Landings 164.02 255.86 130.89 181.27 301.25 206.20
TAC 175.59 229.55 143.18 196.46 290.99 212.92
SPA 1B Upper Bay Landings 78.19 84.05 69.01 72.57 57.75 21.07
TAC 72.68 83.24 64.08 69.48 97.03 96.40
SPA 3 Full Bay Landings 234.96 223.69 158.60 112.55 75.46 36.81
TAC 250 225 175 157.42 125 175
SPA 4 and 5 Full Bay Landings 132.35 233.56 190.94 151.55 113.09 127.05
TAC 135 250 200 157.81 124.56 135
SPA 6 Full Bay Landings 23.99 13.57 26.26 28.76 32.66 29.88
TAC 37.77 38.76 33 29.91 30.34 30
SPA 6 Mid Bay Landings 207.01 213.25 217.27 112.22 181.87 182.32
TAC 202.23 211.24 184.82 129.03 185.86 174.37
19Science Response: Scallop Production
Maritimes Region Areas 1 to 6 in the Bay of Fundy
This Report is Available from the:
Center for Science Advice (CSA)
Maritimes Region
Fisheries and Oceans Canada
1 Challenger Drive, PO Box 1006
Dartmouth, Nova Scotia B2Y 4A2
Canada
Telephone: 902-426-7070
E-Mail: MaritimesRAP.XMAR@dfo-mpo.gc.ca
Internet address: www.dfo-mpo.gc.ca/csas-sccs/
ISSN 1919-3769
© Her Majesty the Queen in Right of Canada, 2021
Correct Citation for this Publication:
DFO. 2021. Stock Status Update of Scallop (Placopecten Magellanicus) in Scallop Production
Areas 1 to 6 in the Bay of Fundy. DFO Can. Sci. Advis. Sec. Sci. Resp. 2021/005.
Aussi disponible en français :
MPO. 2021. Mise à jour de l’état du stock de pétoncles (Placopecten Magellanicus) des zones
de production de pétoncles 1 à 6 de la baie de Fundy. Secr. can. de consult. sci. du MPO,
Rép. des Sci. 2021/005.
20You can also read