Weather Radar

SOEE: Lecture 10

Dr Lindsay Bennett
←
→
Page content transcription
If your browser does not render page correctly, please read the page content below
Weather Radar SOEE: Lecture 10 Dr Lindsay Bennett
Who am I?
University of Leeds
PhD Meteorology
    2003-2008

  Post-Doctoral
Research Assistant
   2008-2011

                                Instrument Scientist
                      National Centre for Atmospheric Science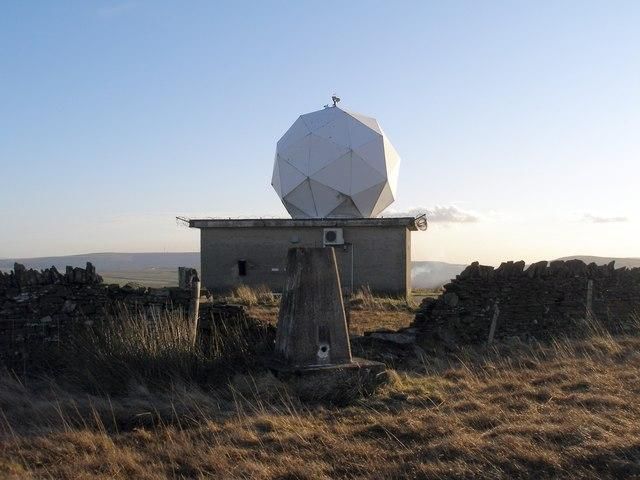
LECTURE PLAN

•   History of Radar
•   General Principles
•   Reflectivity, Rainrate, Velocity
•   Nowcasting
•   Dual Polarisation
History of UK Weather Radar
• 1935 Robert Watson-Watt, meteorologist by training,
  developed the first practical radar system to track aircraft

                                    RADAR=RAdio Detection And Ranging

 • During the war, weather
   echoes were initially
   considered a nuisance
 • 1950s and 60s, first studies
   of storm dynamics and
   precipitation forecasting
History of UK Weather Radar
• Dee Weather Radar project, 1966-1975
    – real time rainfall measurements over the
      Dee River valley catchment
• Network of radars proposed by
  P.J. Bulman and K.A. Browning in 1971

• North West Radar Project 1976-1984
    – first unmanned, automatic radar
      system at Hameldon Hill, near Burnley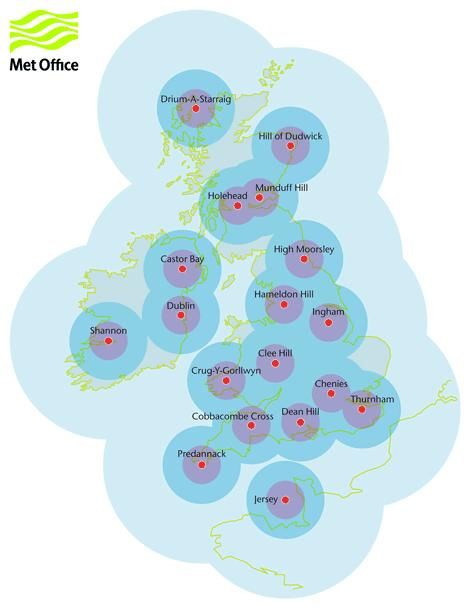
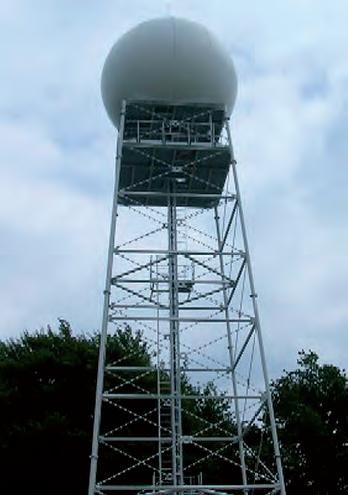
UK Radar network
• 4 radars in 1985, 12 by
  the mid 1990s
• Today: 18 radars,
  15 operated by the
  Met Office

                            5km
                                  2km

                                  1km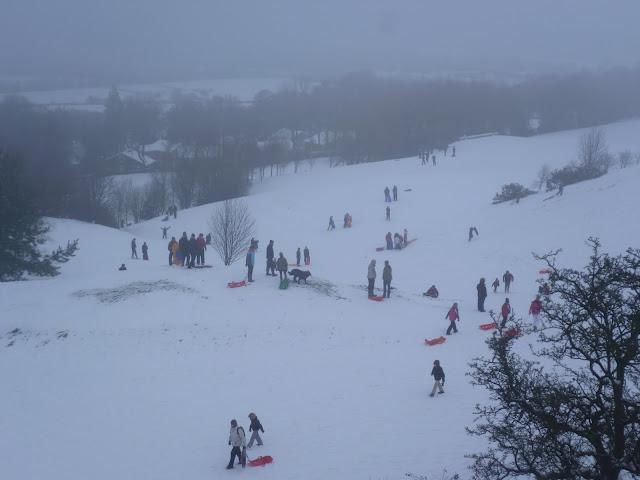
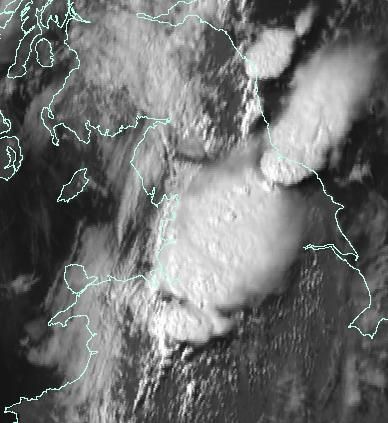
Rainfall Composites

  Snow event in UK on 4th February
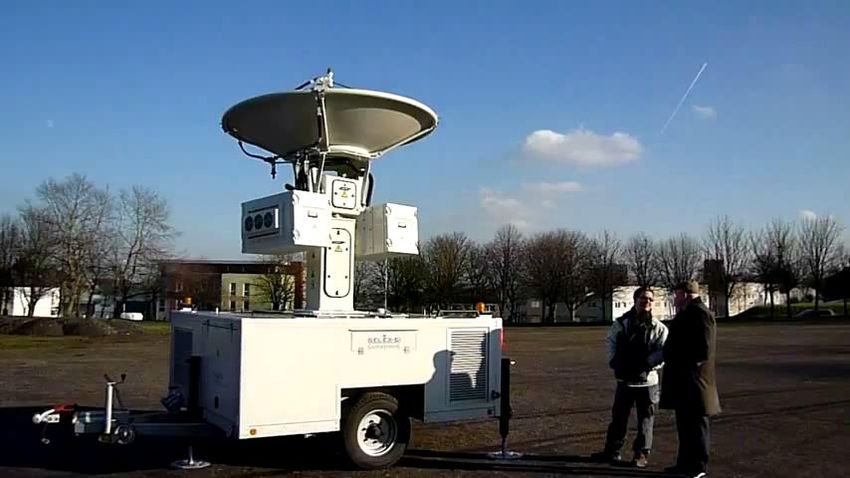
How does Radar work?

Sends out pulses of electromagnetic radiation in a narrow beam
Radiation scatters off targets, some returns to the radar
Radar listens for the return pulse
Targets can be weather or any physical object
Frequency of Weather Radar
       High frequency                                   Low frequency

1019 Hz                                                         105 Hz

   •      Weather radar frequencies are usually S,C and X band
   •      Range between f=2-12 GHz (109Hz) (λ=2-15cm), f ~ 1/λ
   •      Microwave energy peak power = 50-500 kW
   •      Microwave oven 2.45 GHz/ λ=12cm, 700 W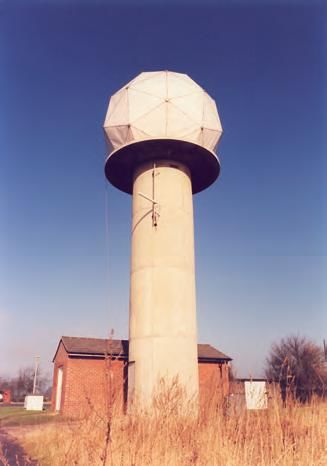
Weather Radar Scanning
• PPI – Plan Position Indicator
• RHI – Range Height Indicator

                   Z

                          X
          Y

              X         Met Office radars repeat a sequence of
                       several PPIs at different elevation angles
                                    every 5 minutes
Weather Radar Scanning
• For a radar to locate a target
of interest (e.g. rain) 3 pieces
of information are needed:
range, azimuth and elevation
Y
R
X
Speed=distance/time
Z
Power received Reflectivity Rainrate X
Target Velocity Air motionsThe Radar Equation
• The weather radar equation describes the
relationship between:
– the transmitted (Pt) and received power (Pr)
– the properties of the radar (C)
– the properties of the targets (Z)
– the distance between the radar and the targets (R)
Pt CZ
Pr 2
RRadar Reflectivity
• Z, Radar Reflectivity, is a function of target size
(D6), number of drops (N) and has units of
mm6/m3
6 6
D
D=5mm, D =5 = 15,625
D=0.5mm, D6=0.56 = 0.01 D
• dBZ (decibels of Z) = 10 log10(Z)
• 30 dBZ = 10 X 20 dBZ!!Reflectivity – Hurricane Katrina
Estimating Precipitation with Radar
• Z = f (D6) Reflectivity Z (mm6/m3) is a function of the size of drops (D6)
   and the number of drops (N)
• R = f (D3) Rainfall rate R (mm/hr) is a function of D3, N and the fall
  speed of the drops (v)
• No direct relationship between Z and R
• If we assume a distribution of particles (i.e. number of drops in different
  size categories) we can relate Z to R
• Z=ARB R=(Z/A)1/B
    – Marshall and Palmer (1948) Z=200R1.6 A=200, B=1.6
    – hundreds of relationships: depends on rain type (convective, stratiform, mixed), season,
      location (tropics, mid-latitudes) and cloud type

• 30dBZ ~ 2.7mm hr-1
• 60dBZ ~ 205mm hr-1
• Quantitative Precipitation Estimation (QPE) or Forecasting (QPF)
Doppler Velocity • Doppler effect or Doppler shift – change in frequency due to a moving object • Austrian mathematician and physicist, Christian Doppler (1803- 53) • Doppler radar can detect whether a target is moving towards or away from the radar location • Measure the change in the phase of the returned pulses • Calculate Doppler velocity • Met Office radars being upgraded to have Doppler capability
Tornado Signature
Reflectivity (dBZ) Radial Velocity (m/s)
5km
-6 34 Towards Away
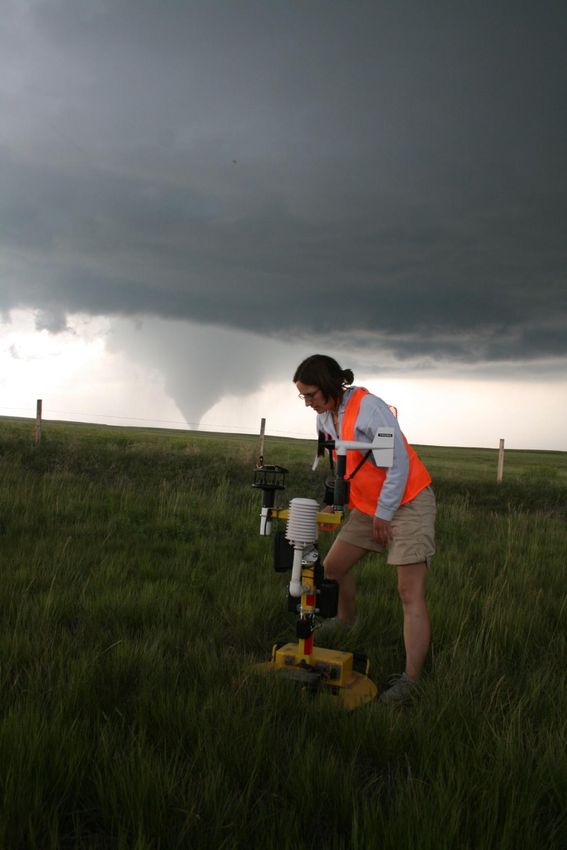
Radar locationClear Air Data
• Radar waves scatter off non-meteorological targets too
– trees, buildings, power lines are known as “ground clutter”
– insects act as “tracers” of the air motion
STORM STORM
INSECTS INSECTS
Radial Velocity (m/s) Reflectivity (dBZ)Clear Air Data
Insects Insects
Radial Velocity (m/s) Reflectivity (dBZ)Nowcasting
• Very short-range forecasting
• Detailed analysis of current
weather situation and forecasting
up to 6 hours ahead
– track radar echoes and extrapolate into
future
– combine high resolution numerical
forecast models with observational
data (satellite, sounding, surface)
– UK Met Office Nimrod, Gandolf
systems
– USA – TITAN, Auto-NowcasterRadar Errors
• Ground clutter • Strong winds
• Attenuation • Evaporation below beam
• Bright band • Mixed precipitation (ice and liquid)
HAIL
Ground Clutter
WIND
Rain GuageBright Band
Vertically-
pointing
radar
Height
(km)
Time (UTC)Attenuation • Reduction in signal due to scattering and absorption • Worse for shorter wavelengths (X-band)
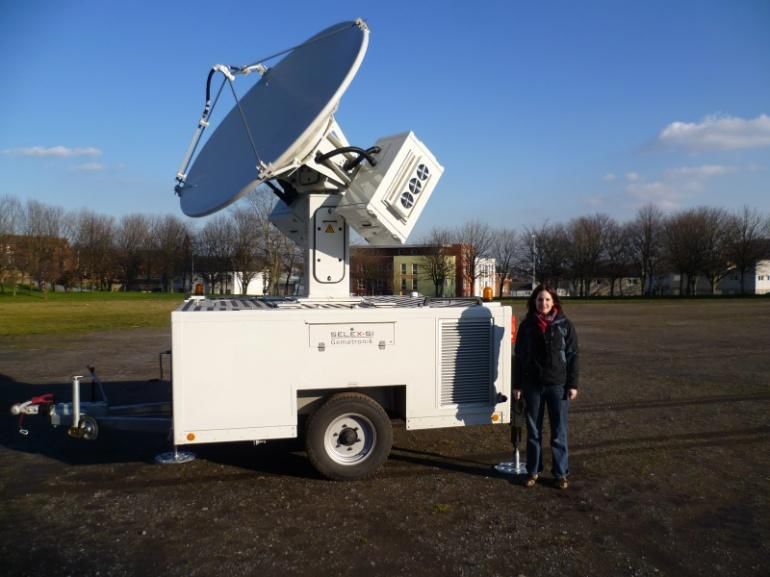
Dual-polarisation Radar

By comparing reflected power returns in different ways (ratios, correlations, etc.), it
 is possible to obtain information on the size, shape, and ice density of cloud and
                               precipitation particles.
     Can also correct for errors associated with attenuation and bright band
Differential Reflectivity
ZDR ~ log (ZH/ZV)
Big drops ZH > ZV, ZDR > 0
Hail ZH=ZV, ZDR=0Dual-polarisation Radar • http://www.wdtb.noaa.gov/courses/dualpol/animations/PhiDP_animation.html • Horizontal and vertical waves are slowed down (attenuated) different amounts when propagating through precipitation • Radar measures the difference in the phase (phase shift) of the H and V returned pulses • Amount of phase change ~ amount of attenuation ~ intensity of rainfall • Better estimates of rain rate
UK Radar Network

• Met Office started upgrade of
  the network
• Doppler by end of 2012
  (1-2 weeks downtime)
• Dual-polarisation by Autumn
  2014 (2-3 weeks downtime)
You can also read