A Summary of Historical Weather Conditions at 2013-2014 PGA Tour Events
←
→
Page content transcription
If your browser does not render page correctly, please read the page content below
A Summary of Historical Weather Conditions at
         2013-2014 PGA Tour Events
                             Chris Fuhrmann and William Schmitz
                              Southeast Regional Climate Center
                                     Web: www.sercc.com
                                  Email: fuhrmann@unc.edu

The weather plays a significant role in the performance of professional golfers. It also has a
significant impact on the safety and comfort of not only the golfers, but the spectators,
volunteers, caddies, tournament officials, vendors, and media personnel situated throughout
the course. Particular weather events, such as thunderstorms, heavy rain, high wind, fog,
frost, and even snow, can have adverse effects on tournament operations and course
conditions, resulting in postponement of play or cancelation of a round or tournament.
Recent examples are highlighted here.

In this study, we examined the historical weather conditions for tournaments associated with
the 2013-2014 season of the flagship tour of the Professional Golfers Association (or PGA
Tour). We included all regular weekly tour events, playoff events, the Masters, and several
invitation-only events, including the World Golf Championships (WGC). Only events
conducted in the U.S. were examined.

The 2013-2014 PGA Tour season can be divided into seven “swings”, beginning with the fall
series in October and ending with the playoffs the following September. Three of the playoff
events this season take place on the East Coast, while the other event takes place near
Denver, CO. The other swings to the PGA Tour season are generally clustered geographically,
with some exceptions (e.g. the Reno-Tahoe Open near Reno, NV, which is during the Midwest-
East Coast summer swing). Below is a map and table of the tournaments examined in this
study.

                                                                                                 1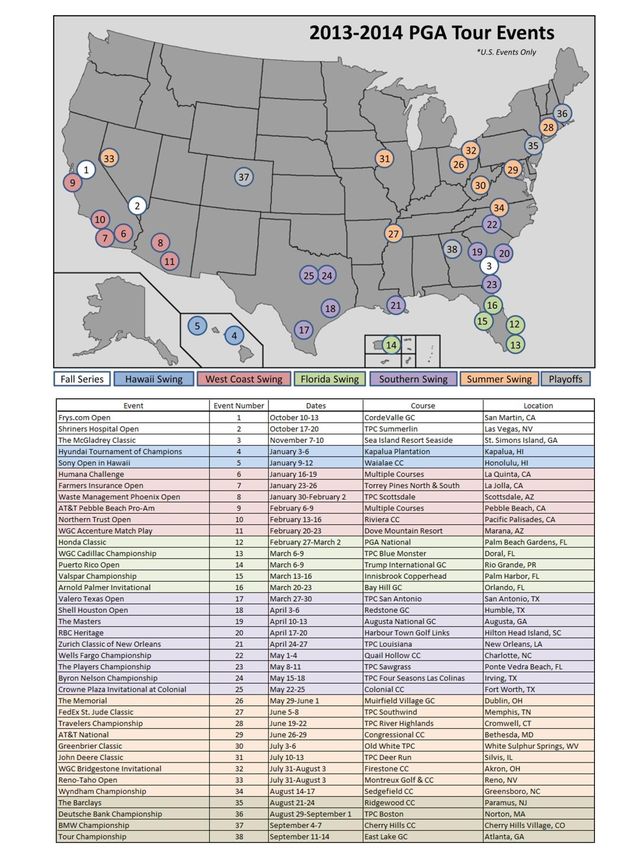
2
A number of parameters were examined to characterize the predominant weather conditions
associated with the 38 tournaments listed above. Historical daily temperature (°F),
precipitation (inches), and snowfall (inches) for each of the four calendar days associated with
each tournament were obtained from the closest official weather station maintained by the
National Weather Service. All of the daily stations used in this study have periods of record
longer than 50 years, while about half of the stations have at least than 74 years of data.
Historical hourly dew point (°F), apparent temperature (i.e. heat index, °F), present weather,
and wind speed (mph) were obtained from the closest automated weather station maintained
by the Federal Aviation Administration. Only those hours during which players would be on
the course were considered (7:00am to 7:00pm local time). About three-quarters of the
automated stations used in this study have 60 to 65-year records, while seven of the stations
have records of less than 20 years. A list of all the stations used in this study and their periods
of record can be found here. In addition, we examined the relative risk from lightning strikes
and tropical cyclones using published data from the National Lightning Detection Network and
National Hurricane Center, respectively.
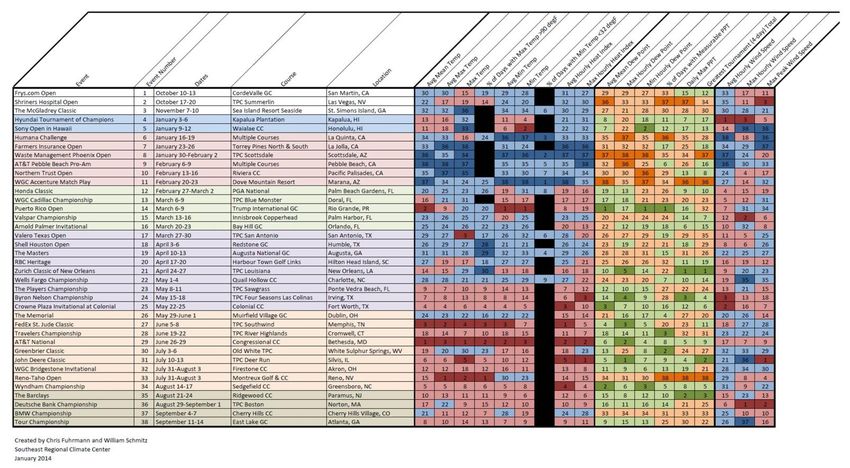
The table below lists all 38 tournaments in chronological order and their relative ranking for a
number of different weather parameters. The values associated with these rankings can be
found here. The five highest and lowest ranked events for each parameter are also
highlighted to determine those tournaments with the most climatologically extreme weather
conditions.
3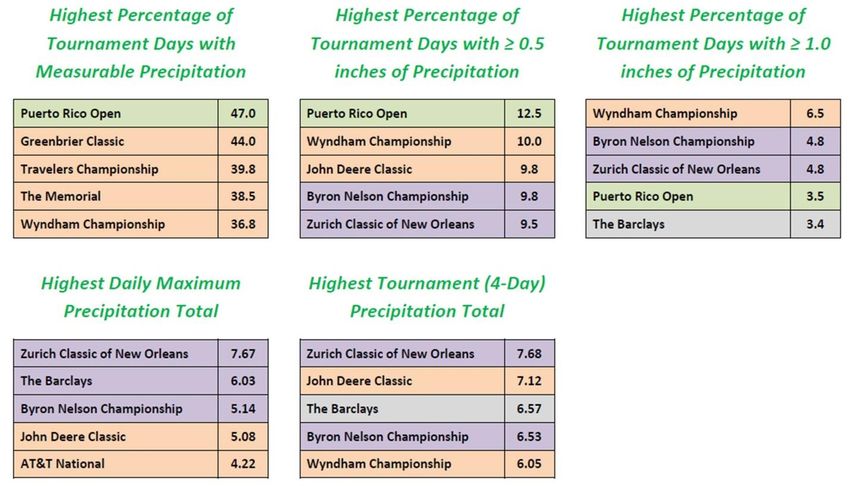
4

Warmest Tournaments

                               Coldest Tournaments

                       *

*Other tournaments at risk of a freeze or frost (minimum temperature < 35): Valero Texas
Open, Honda Classic, Northern Trust Open, Wells Fargo Championship, RBC Heritage,
Frys.com Open
                                                                                           5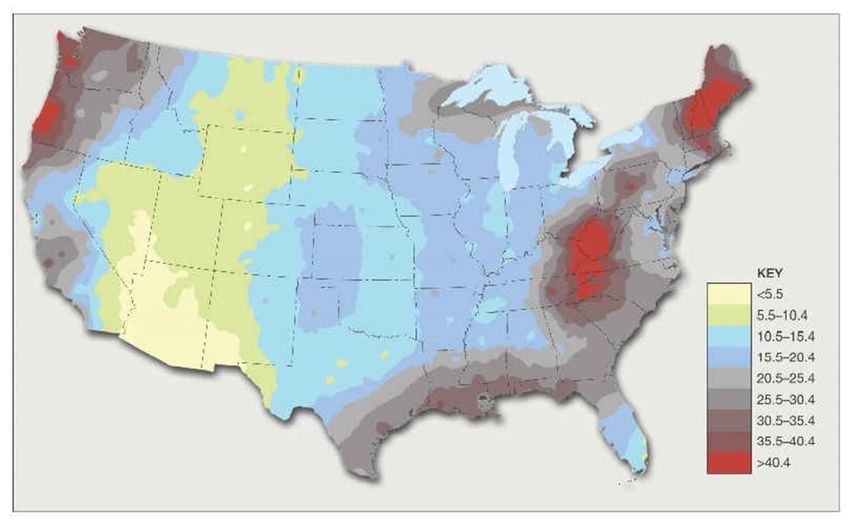
Sultriest Tournaments

Wettest Tournaments

 Driest Tournaments

                        6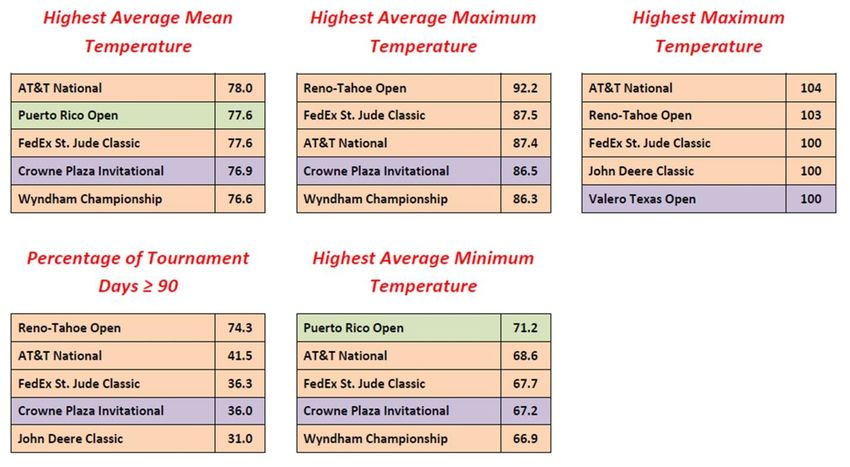
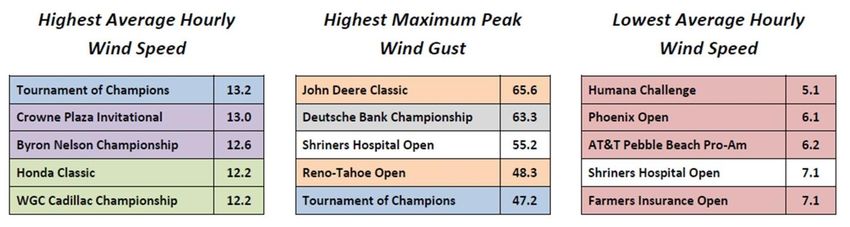
Windiest and Calmest Tournaments

                                                           *

                                *Hurricane Isaac (August 2011)

                               Snowiest Tournaments

                               Foggiest Tournaments
The map below shows the average number of days per year with dense fog, defined as
visibility of less than one-quarter mile (Source). Areas shaded in gray and red experience at
least 20 days per year with dense fog, which results in a daily probability of about 5.5%. Based
on hourly weather observations from the nearest airport station, the tournaments with the
highest probability of experiencing dense fog are the Wyndham Championship (8.5%), the
Greenbrier Classic (7.3%), the Valero Texas Open (7.0%), and the Shell Houston Open (5.9%).
The probability of experiencing dense fog is slightly lower on the West Coast Swing (4.6% at
the Northern Trust Open and 3.3% at the Farmers Insurance Open). Tournaments with the
lowest probability of experiencing dense fog (less than 1%) are the Phoenix Open, the
Humana Challenge, and the BMW Championship. The probability of dense fog drops to zero
at the WGC Accenture Match Play and the Shriners Hospital Open.
                                                                                               7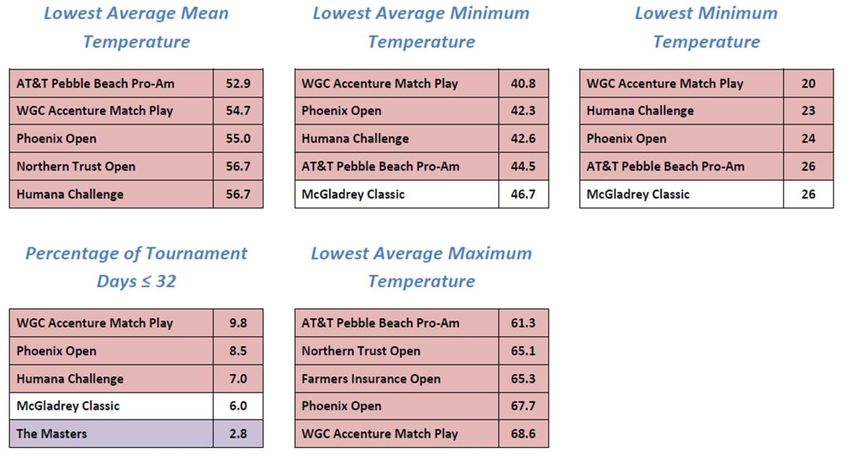
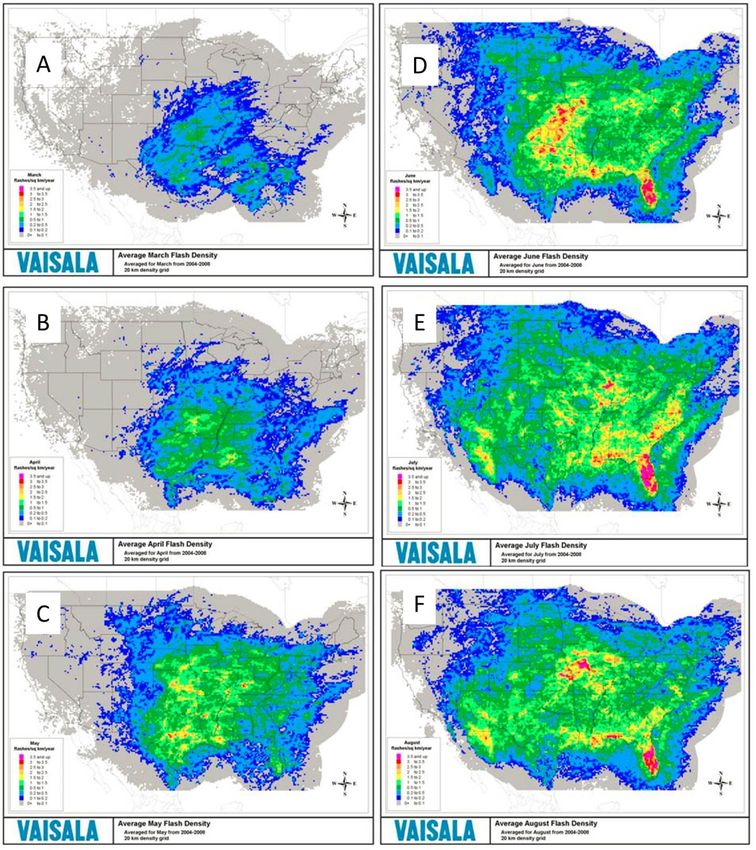
Risk of Lightning
The maps below show the average number of cloud-to-ground lightning strikes across the
continental U.S. by month (March-August) from 1997 to 2007 (Source). While Florida is
typically seen as the state with the greatest risk of lightning strikes, this risk is not evenly
distributed throughout the year. Fortunately, the events that make up the “Florida Swing”
take place during the early spring when flash densities are relatively low across the Florida
Peninsula (see map A below). The average strike density during the events that make up the
“Southern Swing” is generally less than 1 strike per square kilometer, except around New
Orleans (Zurich Classic) where the April strike density is greater than 2.5 strikes per square
kilometer and around the Dallas-Fort Worth area (Byron Nelson and Crowne Plaza
Invitational) where the May strike density is greater than 3 strikes per square kilometer. This
represents the greatest climatological risk of lightning strikes among all PGA Tour events
examined in this study. The events that make up the “Summer Swing”, except for the Reno-
Tahoe Open, exhibit average monthly strike densities of at least 1 strike per square kilometer.
The events with the highest strike densities (greater than 2 strikes per square kilometer) are
the AT&T National and John Deere Classic.

                                                                                                   8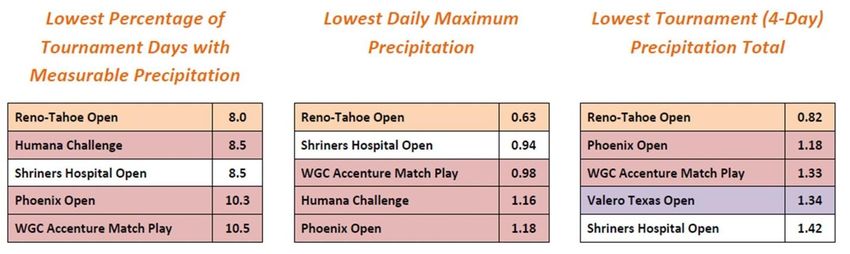
9
Risk of Tropical Storms and Hurricanes
The maps below show the average number of tropical storms and hurricanes that occur in the
Atlantic Basin from May through December (per 100 years) and the return period for a
landfalling hurricane along the Gulf and Atlantic coasts (Source). The tournaments with the
greatest probability of being affected by a tropical storm or hurricane are the Wyndham
Championship, the Barclays, the Deutsche Bank Championship, and the Tour Championship,
as these tournaments take place along the East Coast during the climatological peak of the
Atlantic hurricane season (August-October). The risk of experiencing tropical storm or
hurricane-force winds is greatest at the Barclays and Deutsche Bank Championship because
of their proximity to the coastline. In addition, the McGladrey Classic takes place in early
November along the southeast Georgia coast, near the end of the official Atlantic hurricane
season.

                                                                                           10
You can also read