DWD Weather Radar Network - German Meteorological Service
←
→
Page content transcription
If your browser does not render page correctly, please read the page content below
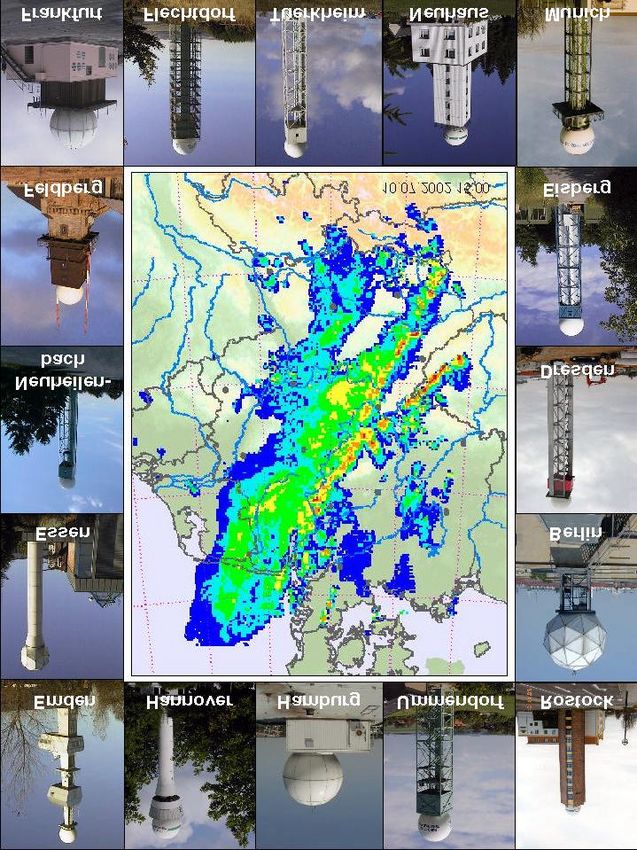
German Meteorological Service

DWD Weather Radar Network
The acquisition of reliable meteorological data provides the basis for the operational work of
all Meteorological Services worldwide. For over 30 years now, remote sensing methods have
been used in addition to conventional precipitation measurements.
The Deutscher Wetterdienst (DWD) is legally required to
Weather Radar Network Systems
record meteorological data by means of modern In service since:
technology. To do this the DWD maintains a network of
weather radar systems, the so-called Radar Network Munich 1987
(RADAR= RAdio Detecting And Ranging). Conventional Frankfurt 1988
precipitation observations are only spot measurements in Hamburg 1990
the spatial and temporal course of a precipitation event. Berlin-Tempelhof 1991
However, radar information allows full-coverage weather Essen 1991
monitoring, locally and regionally. Modern systems supply Hannover 1994
data on the distribution of precipitation with high spatial Emden 1994
Neuhaus 1994
and temporal resolution. When the radar images from 1995
Rostock
various sites are combined to form an overall image, the Ummendorf 1996
so-called composite image, then further possibilities for Feldberg 1997
weather analysis and forecasting are opened up. Weather Eisberg 1997
radar systems are the most important aid for meteorology Flechtdorf 1997
and hydrology in measuring areal precipitation and Neuheilenbach 1998
observing its development and direction of motion. By Tuerkheim 1998
calibrating the weather radar systems, it is possible to Dresden 2000
achieve quantitative precipitation measurements.
Weather radar is the only means of measuring areal precipitation, i.e. it can provide the
following information:
"How much precipitation, where and in what period of time"
Weather radar at the DWD
In the sixties and seventies the DWD was using analog radar equipment, whose users were
still working interactively with radar. After the Munich hail catastrophe on 12 July 1984, the
users demanded better precipitation forecasts based on radar measurements. In 1987 the
DWD began building up a weather radar network with the installation of a weather radar
system in Munich (C-Band, 5.6 GHz).
The first five radar systems supplied
information on intensity, altitude, distance
and direction of motion of the
precipitation. Between 1994 and 2000 the
DWD installed eleven further weather
radar systems. This Doppler radar
equipment also facilitates a statement on
the speed of the hydrometeors. By
February 2004, all systems had been
dopplerised. Today the radar network
comprises 16 operational radar systems
(see table), as well as research radar at
the Hohenpeissenberg Meteorological
Observatory (MOHp).
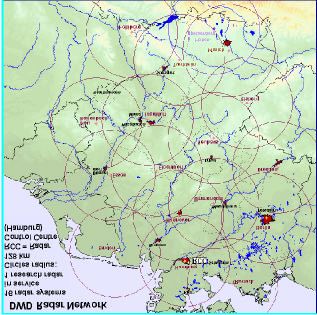
The location map shows the current radar
network with ranges of 128 km that can
be achieved with the DX product (see
products).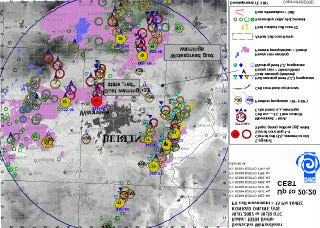
The basic principle of radar measurement

A weather radar system consists of an
antenna unit including radome (weather
protection), a transmitter and a
receiver, signal and data processing
processors, a radar computer, as well
as a local network with the necessary
telecommunication facilities for data
supply and for remote access        in
system monitoring.

The antenna of the radar system emits
an electromagnetic pulse focussed to
approx. 1° of known frequency, length
and power. Precipitation particles disperse this energy and send parts of it back to the
antenna. The distance can be determined from the transit time of the received signal. The
strength of the echo, which is called reflectivity, provides information on the size and
composition of the precipitation particle (see picture).

In addition to the intensity of the backscattered signals, the radar installations also detect the
mean radial speed of the precipitation particles via the Doppler shift. A Doppler filter
                                           technique removes the so-called clutter. Clutter is
                                           the term used for unwanted echoes caused by high
                                           buildings or hills.

                                     0°
                                          After the signals have been digitalized, the data are
                                Z         processed further by the signal processor and the
                                          radar computer. The radar computer also controls
                                RS        and monitors the complete system.

The DWD scanning technique

The DWD uses two different scanning techniques.

In the volume scan, the antenna passes through 18 different angles of elevation from 37.0°
to 0.5° every 15 minutes, thus covering the atmosphere up to an altitude of 12 km. The
volume scan consists of two different measuring modes: the intensity mode covers the lower
elevation angles from 0.5° to 4.5°, the Doppler mode covers the elevation angles above. The
horizontal range is 230 km with the intensity mode and 120 km with the Doppler mode.

The lowest position has outstanding significance for hydrometeorology. For this reason the
spatial scan is interrupted every five minutes and the precipitation scan is carried out at the
lowest elevation angle. This is to obtain precipitation data from distances up to 128 km as
near to real-time as possible, whereby the radar beam sweeps over the horizon at between
0.5° and 1.8°, depending on the orography.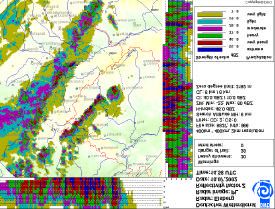
Generation of radar products from radar raw data

The radar computers produce all local images at the radar site, distribute them in "real-time"
within the DWD and then store them. At the radar sites 20 different products are generated
as point values, as well as Cartesian and polar surface data sets. According to the scanning
cycle rates of the two scans, this results in approx. 35,000 products per day for all 16 sites.

Below you will see some of our radar image products and their application shown in the
example of the so-called "Berlin storm" which occurred on 10 July, 2002. Germany lay under
the influence of a cold front moving eastwards, which completely covered Germany and
extended as far as the Mediterranean. Ahead of the cold front, particularly east of the Elbe,
diurnal maximum temperatures of more than 30°C still prevailed; to the rear there were
temperatures of 12 to 17°C. Especially in the eastern part of Germany severe thunderstorms
with heavy rain, hail and hefty storm gusts occurred locally, with the surface wind reaching
wind force 12 (hurricane) in places.

The volume scan provides among other things the local products PL, PE and DW. The local
radar product PL (left-hand picture) gives an overview of the strength of the radar echoes
nearest the ground (up to a 230 km radius, six classes) and at the same time a rough
estimate of the vertical structure of the areas with the heaviest precipitation. PL is the product
most used in nowcasting. The warning product DW comes into operation when certain
threshold values of radar reflectivity are exceeded. DW allows a maximum of 30 shower, hail
and wind shear warnings to be made in each case. These warnings appear in the local radar
images (PL) and the composite images as coloured warning points (see back cover of this
brochure).

The echotop product PE (right-hand picture) shows the maximum altitudes for the recorded
radar reflectivities (above a pre-determined reflectivity threshold value). The meteorologists
at the DWD use the PE product for forecasting showers and thunderstorms.

The DW and PX products and others result from the
precipitation scan. The DX product (adjacent picture)
contains the current values of the latest precipitation
echoes measured every 5 minutes, making very short
range forecasts of precipitation possible. This is an
important input by DWD for the flood forecast centres
of the federal states of Germany. The example shows
the heavy precipitation areas west of Berlin with
maximum amounts of over 7.5 mm in the past five
minutes (purple areas).
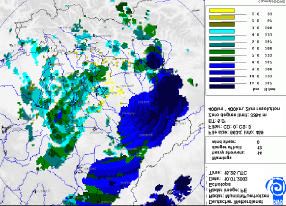
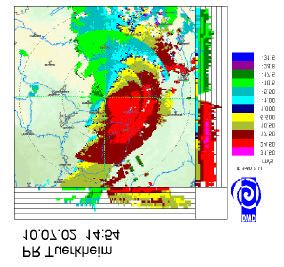
The near zone product PX (left-hand picture) is produced every five minutes. The PX
serves as input value for the cell tracking system KONRAD, which is presented below.

Wind speeds can be calculated from the Doppler shift. The PR product (right-hand picture)
shows the radar-related radial wind speed of a layer as local radar image in a speed range of
+ 32 m/s to – 32 m/s in twelve classes, i.e. one can see the wind direction on the radar
display. This is important information for the aeronautical meteorological forecaster of the
DWD.

The distribution of the radar products to the DWD central office in Offenbach as well as all
radar PCs is achieved via ftp (file transfer protocol), where further processing takes place,
e.g. the combination of the local images to a German-wide
or European-wide composite image, as well as onward
transmission to external users.

The radar network within the DWD exchange system
distribution is technically monitored by means of a fully
automatic supervision system. The status of the systems is
shown in a chart (adjacent picture), which is updated every
15 minutes. DWD's experts are on emergency service
round the clock to intervene by remote access in the case
of a failure. This guarantees, together with the regular
maintenance of the systems, a high degree of availability
of the radar products. At present the DWD is the only
National Meteorological Service that carries out system
monitoring with such a short updating period.

More than the sum of their separate parts: composite products

At the Offenbach headquarters a mainframe computer superimposes the single images, thus
generating the so-called composite products. In the overlapping areas of several radar sites
it uses the strongest signal in each case for the qualitative products. For the quantitative
products the value is taken where the radar beam is nearest the ground, or a multilayer
composite is produced. At present there are composites from the PL, PZ and DX products.
The national composite image PC (see title page) contains the portrayal of the ground-
proximate radar reflectivity distribution over Germany and is used above all in the nowcasting
sector.
In order to obtain transboundary information on approaching precipitation areas and their
development, the Deutscher Wetterdienst exchanges its radar data with the Meteorological
Services of its European neighbours. The result is an international composite image PI
(see back of brochure), that is compiled from the local radar images from Brussels (Belgium)
and Römö (Denmark), as well as the composite images from Germany, Austria, Switzerland,
France, the Netherlands, Great Britain and the Czech Republic.

User circles and application range of the radar products

                                  The radar products facilitate full-coverage precipitation
                                  monitoring within the DWD and provide important
                                  information for the very short range prognosis, especially
                                  in warning against heavy precipitation and the danger of
                                  hail. By superimposing radar images and satellite
                                  pictures, which provide information on cloud genus and
                                  distribution, precipitation events can be clearly defined by
                                  fronts and lines of convergence.
                                  Weather monitoring and very short range prognoses
                                  essentially serve to provide warnings to external clients.
                                  The radar data are used in road, rail and river traffic,
aviation, as well as in agriculture and forestry, by power suppliers, public institutions,
insurance companies and the Federal Armed Forces, and are thus of enormous economical
benefit.

The areal-coverage precipitation totals derived from
the quantitative radar data enlarge the ground
precipitation measuring network in the climatological
and hydrometeorological domain. Hydrological and
water resources management users are the main
customers for the quantitative radar precipitation
data. The data help them in the calculation of water
resources management structures such as, for
example, rainwater retention basins, dams, dikes,
municipal sewerage systems and reservoirs. The
quantitative radar data are also used as input for the
flood forecast and runoff simulation models, thus
facilitating the regulation of sewers and barrage
dams. Due to the catastrophic flood events in recent
years, e.g. the Elbe floods of August 2002 (see
adjacent picture), the significance of these forecasts
and resulting damage reduction are of growing
importance. In providing the federal states of
Germany with its radar products, the DWD makes an
indispensable contribution in carrying out the
warning tasks in disaster prevention.

Warning with KONRAD

KONRAD was developed by DWD experts at the Hohenpeissenberg Meteorological
Observatory. KONRAD stands for K(C)Onvection development in RADar products and
engages meteorologists working in an advisory capacity, operation heads of emergency
services and organisations responsible for general safety, such as, for example, fire
brigades, more actively in the storm warning process. KONRAD helps them to make their
own decisions, thus avoiding unnecessarily long warning procedures. With its automatic
image interpretation method, it directs concentration on the core of the storm.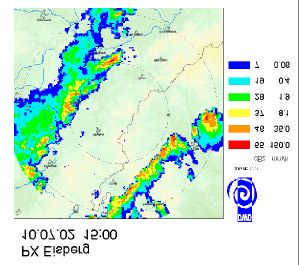
The radar data supply important
information on the place of origin of
thunderstorm cells and allow important
conclusions on their development to be
made. For this purpose, KONRAD filters
out the cores of the thunderstorm cells
from the overall picture of the precipitation
fields (PX product). By analysing the
strength of the echo, its extent and
direction of motion, it can derive warnings
referring to the danger of hail, heavy rain
and gusts of wind. The latest information
is provided every five minutes and in the
form of a symbol for the last half hour on a
graphical chart on the Internet. Please contact the DWD for information on logon
authorisation and training in the use of KONRAD.

                           The DWD is also co-operating closely with the federal states of
                           Germany in the RADOLAN (radar online adjustment) project.
                           Financially supported by the federal states of Germany Working
                           Group Water, it is aimed at combining radar and ombrometer data,
                           i.e. automatic precipitation collectors, in real-time operation.
                           RADOLAN has been developed to determine heavy precipitation
                           totals for Germany in near real-time and with complete area
                           coverage. The data from the approx. 1,300 automatic precipitation
stations in the joint measuring network of the DWD and the federal states of Germany
provide the basis for this adjustment. The preprocessed DX products, which are generated
every five minutes, serve as additional input data. Adjusted radar data should then be
available 15 minutes after precipitation measurement.

The routine operation of RADOLAN is expected to start in
autumn 2004. By then about 200 adjusted quantitative radar
products will be available for operation. The Local-Model, which
the DWD uses for numerical forecasting, will then be able to take
this calculated precipitation into account. Furthermore, the
adjusted radar products serve as basis for a method for tracking
the movement of fields of heavy precipitation. The results of the
above-mentioned forecast models are again entered into the
RADVOR-OP (radar supported, near real-time precipitation forecast for operation use).

Future plans

The DWD is planning to modernise its radar network with a new generation of radar
equipment as from 2006. For the moment a conversion to LINUX-based systems is taking
place. At the end of 2004 the NinJo software package will go into operation with a new form
of radar product presentation. This software facilitates any number of superimposed radar
images with other meteorological products.
As from 2004 it is planned to test the so-called dual polarisation technology on the research
radar, which will facilitate better differentiation of precipitation particles. The DWD plans to
use this technology operationally in the radar network systems as from 2007.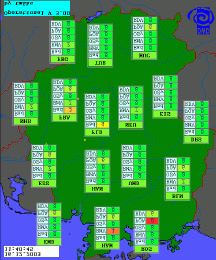
If you have any general questions concerning the DWD radar network, please contact:
Sabine Hafner, Measurement Technology Division, subject area Remote Sensing
(Tel.: 069/8062-2885, Email: Sabine.Hafner@dwd.de)

The following experts will be pleased to answer any specific questions you may have:

System responsibility, operations:               Jörg Weisbarth      (Joerg.Weisbarth@dwd.de)
Central product generation:                      Dr. Arnold Meyer    (Arnold.Meyer@dwd.de)
Radar research:                                  Dr. Jörg Seltmann   (Joerg.Seltmann@dwd.de)
KONRAD development:                              Peter Lang          (Peter.Lang@dwd.de)
Hydrometeorology:                                Elmar Weigl         (Elmar.Weigl@dwd.de)
Development operat. radar systems:               Theodor Mammen      (Theodor.Mammen@dwd.de)

           Deutscher Wetterdienst
           Zentrale
           Frankfurter Straße 135
           63067 Offenbach
           Internet: http://www.dwd.de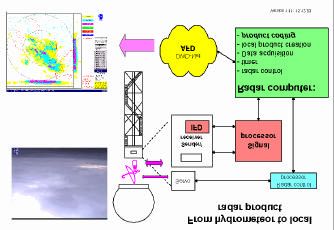
You can also read