ECan-freshwater Documentation - Release 1.0.1 Mike Kittridge - Read the Docs
←
→
Page content transcription
If your browser does not render page correctly, please read the page content below
ECan-freshwater Documentation
                    Release 1.0.1

                    Mike Kittridge

                         Sep 11, 2020
LATEST MONTHLY MAPS
1 NIWA seasonal climate outlook 3
1.1 Latest Groundwater CWMS Zone Map . . . . . . . . . . . . . . . . . . . . . . . . . . . . . . . . . 3
1.2 Latest Precipitation and Surface Water Subregion Map . . . . . . . . . . . . . . . . . . . . . . . . . 3
1.3 Latest Surface Water Catchment Map . . . . . . . . . . . . . . . . . . . . . . . . . . . . . . . . . . 3
1.4 Precipitation and Surface Water . . . . . . . . . . . . . . . . . . . . . . . . . . . . . . . . . . . . . 3
1.5 Groundwater . . . . . . . . . . . . . . . . . . . . . . . . . . . . . . . . . . . . . . . . . . . . . . . 6
1.6 Precipitation and Surface Water . . . . . . . . . . . . . . . . . . . . . . . . . . . . . . . . . . . . . 6
1.7 Groundwater . . . . . . . . . . . . . . . . . . . . . . . . . . . . . . . . . . . . . . . . . . . . . . . 8
1.8 Methodology for the monthly precipitation, surface water, and groundwater maps . . . . . . . . . . . 8
iii
ECan-freshwater Documentation, Release 1.0.1

This site contains seasonal reports and maps of Canterbury illustrating the relative wetness or dryness for precipitation,
surface water, and groundwater. The intended audience for the maps and the associated reports are the Environment
Canterbury scientists and councilors.
The Latest Monthly Maps section has maps that are automatically updated once a month (at least). The last update
was on: 2020-09-07

LATEST MONTHLY MAPS                                                                                                     1
ECan-freshwater Documentation, Release 1.0.1

2                                              LATEST MONTHLY MAPS
CHAPTER

                                                                                                                 ONE

                                                     NIWA SEASONAL CLIMATE OUTLOOK

NIWA produces seasonal forecasts, which can be found on NIWA’s website.

1.1 Latest Groundwater CWMS Zone Map

1.2 Latest Precipitation and Surface Water Subregion Map

1.3 Latest Surface Water Catchment Map

1.4 Precipitation and Surface Water

1.4.1 Surface take restrictions for irrigation

Irrigation restrictions varied over summer months in response to weather patterns. In comparison with last year, there
were fewer restrictions on water takes, particularly at the beginning of the irrigation season (based on telemetered and
gauged data).

1.4.2 Selwyn River/Waikirikiri flows

The Selwyn River has held up well this summer with sustained flows (see graph below, 2016-17 summer in blue and
this summer in red).
This confirms the Environment Canterbury advice that a winter of high rainfall would recharge groundwater and
maintain flows in the following summer.
Also of note is that the river reconnected across the plains after the rainfall from Cyclone Gita giving a rapid rise from
around 0.5 to 90 cumecs that caught out a camper van parked at Coes Ford (against advice).

                                                                                                                        3
ECan-freshwater Documentation, Release 1.0.1
Fig. 1: Low flow site restrictions during the 2017-2018 irrigation season.
4 Chapter 1. NIWA seasonal climate outlookECan-freshwater Documentation, Release 1.0.1
Fig. 2: Flow in the Selwyn River compared year on year from November until the end of February.
1.4.3 Waimakariri high country lakes fish rash
In November 2017 Fish & Game closed six high country lakes in the Craigieburn-Cass area for fishing because of a
red rash on fish. The concern was over a red rash being found on fish taken from the lakes and that it could be a new
virus or caused by an invasive species. Testing of the fish by MPI found nothing, despite concerns it could be a new
virus or invasive species.
In December Environment Canterbury staff (particularly Dr Adrian Meredith) worked with F&G to catch fish and
measure environmental variables in the lakes. The results are inconclusive but the most likely stress was from high
water temperatures.
The long period of hot and still weather from November to January raised lake temperatures to above 20ºC which is
known to cause stress in trout. January measurements of lake temperatures showed temperatures as high as 24ºC.
The latest round of monitoring (23 February) shows temperatures are significantly lower, averaging around 15ºC,
because of rainfall and stormy weather.
1.4.4 Lindavia in Canterbury lakes
Lindavia (commonly referred to as “lake snow”) has recently been found in Lake Lyndon. It has now been established
in Lakes: Aviemore, Benmore, Ohau, Tekapo, Coleridge, Lyndon, and Sumner and is likely to be in more lakes.
The discoveries of Lindavia in most of our big lakes suggest that it has become entrenched in Canterbury. Current
research is focused on whether this means a significant shift in lake ecosystems.
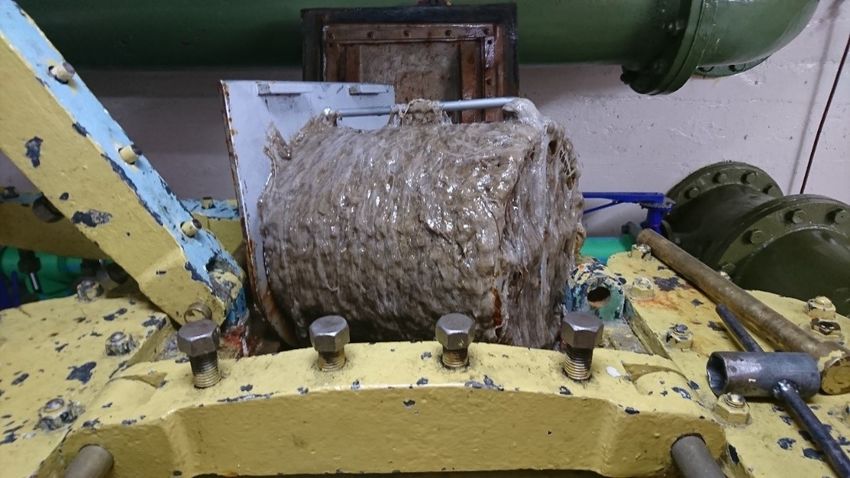
Lindavia (an invasive species of diatom) has caused concern for water supply and hydroelectricity generation in Otago
and Canterbury lakes. Lindavia produces a mucus that can clog up filters in water intakes and fouls fishing lines. It is
1.4. Precipitation and Surface Water 5ECan-freshwater Documentation, Release 1.0.1
this mucus that is referred to as “lake snow”. In Lake Wanaka it has been observed to produce rafts of floating lake
snow.
Manaaki Whenua-Landcare Research is running an MBIE “Smart Ideas” research programme looking at detection
tools and finding other information on Lindavia. Environment Canterbury is well linked into this research programme
and is also funding work (jointly with Otago and Southland regional councils) by the University of Otago on coring
southern lakes sediment to find when Lindavia reached the lakes.
Fig. 3: Lindavia mucus at Lake Tekapo power station.
1.5 Groundwater
1.5.1 Groundwater levels and forecast
Groundwater levels are healthy because of last year’s wet winter. Additional rain in spring/summer also helped by
reducing irrigation demand. Levels have dropped, as per normal, over the spring and summer, when growing plants
and evaporation prevent most rain water from reaching groundwater. Even so, there were moderate increases in
groundwater levels after heavy rain events in January and February.
Groundwater levels in February 2018 were generally average to above average across the region. This is much better
than this time last year, when 64% of our monitoring wells had low or very low water levels. The monitoring well
(shown below) is provided as an example of seasonal groundwater levels since 2011.
1.6 Precipitation and Surface Water
1.6.1 High water demand as dry conditions take hold
Freshwater demand in Canterbury was high from late October because of declining soil moisture levels, caused by
very dry conditions. The dry conditions have already featured in media stories in November and December.
Environment Canterbury is now receiving daily data updates from 97 per cent – by volume – of consented water use
in Canterbury. The data is coming in from 4500 individual water takes through automated telemetry systems.
6 Chapter 1. NIWA seasonal climate outlookECan-freshwater Documentation, Release 1.0.1
Fig. 4: Groundwater depth below surface in a West Melton monitoring well.
1.6. Precipitation and Surface Water 7ECan-freshwater Documentation, Release 1.0.1
1.6.2 Surface take restrictions for irrigation
No monitored river sites went below their “minimum flow” (the level at which Environment Canterbury restricts
takes to protect ecological values) during October. A small number of sites, however, came under restriction during
November. More sites have come onto restriction in December as the dry spell lengthens.
The restrictions are posted daily on our website. Consent holders get daily text messages telling them whether their
take is restricted or not.
1.6.3 Key messages for the farming and urban community
• Water consents are monitored to ensure sustainable use of the resource.
• Any misuse or breach of consent conditions, either detected or reported, will be dealt with through our compli-
ance regime (written warning, abatement, infringement, prosecution).
• Farmers are urged to contact Environment Canterbury if they have an issue or a question around current or
allowable water use.
• Irrigation will still be able to continue in many areas using water that doesn’t deplete streams or rivers: e.g.
water from storage (lakes or ponds), deep groundwater, or from alpine rivers.
• In urban areas water use is managed by the city or district council, subject to consents issued by Environment
Canterbury. Residents are being encouraged to be careful with water use, particularly over the hot dry summer.
1.7 Groundwater
1.7.1 Groundwater levels and forecast
Groundwater levels, monitoring well on Miners Rd, West MeltonGroundwater levels have begun to drop after strong
recharge over the winter. They remain at average levels for the time of year across most of Canterbury. Levels have
now recovered even in most of the deeper wells in the upper Canterbury Plains, though they’re also starting to be
drawn down again by irrigation takes. Groundwater levels remain below average in the Waipara basin.
We expect that the healthy groundwater levels should last the summer, and flows in groundwater-fed streams should
also be in good shape. However, this could change if the weather remains very dry and irrigation takes are high.
1.8 Methodology for the monthly precipitation, surface water, and
groundwater maps
1.8.1 Introduction
The goal of the freshwater maps is to visually provide a representative monthly wetness or dryness generalisation over
large areas in Canterbury. For the surface water and precipitation maps, these areas represent the different hydrologic
landscapes according to differences in elevation and latitude. The groundwater maps were meant to be representative
for the CWMS zones.
The monthly generalisation is meant to be categorical rather than numerical. The development of the statistics and
the associated maps followed this goal. The mapping model was built in Python and mapped using the open source
interactive python plotting library called Bokeh.
8 Chapter 1. NIWA seasonal climate outlookECan-freshwater Documentation, Release 1.0.1 1.8.2 Surface water and precipitation The sites selection for the surface water and precipitation was based on sites having at least 10 years of data ending in the beginning of 2017 and, in the case of surface water sites, their overall contribution to the mapping areas. Since surface water sites aggregate the surface water flow from their entire upstream catchment, only one site from one particular river was generally used to ensure there was no overlapping contributing areas. This is different from the precipitation and groundwater sites as those are discrete datasets without massive contributing areas. The site selection for the surface water and precipitation sites are a fixed input to the model. This should likely stay this way for surface water sites due to the complexity in the selection, but precipitation sites could be automatically updated within the model in the future similar to the site selection for groundwater sites. First, all of the quality controlled data was extracted from Hydstra and monthly aggregates were calculated. As the statistics are meant to represent the overall monthly dryness or wetness, the monthly median was used for the flow data to ensure that flooding events would not bias the statistic (i.e. compared to mean or sum). The monthly sum was used for precipitation. The sites were then grouped by month and order rankings were calculated for the entire dataset. For the map statistics, the last six months of telemetered data was extracted from HydroTel to ensure that the most up-to-date data is always available at the time of the map creation. Again, the sites were aggregated and grouped by month. The telemetered monthly values for each site were then ranked within the earlier quality controlled data to determine its percentile. Once all of the percentiles for the past six months are calculated for all sites, the site percentiles were aggregated to the larger hydrologic areas. The aggregation procedure was different for surface water sites and precipitation sites. All precipitation sites were given equal weight for each area, so consequently a simple mean of all monthly site values were used. As flow measured at a particular point along a river represents everything up gradient of that site, each flow value within the larger hydrologic area was weighted by its catchment size. Once the monthly site values are aggregated to each hydrologic area, a categorical index is applied. 0-10%tile: very low, 10-25%tile: below average, 25-75%tile: average, 75-90%tile: above average, 90-100%tile: very high. These categories are identical to maps created by the USGS in their Active Groundwater Level Network. The mapping process is performed using the open source interactive python plotting library called Bokeh. The previous six months of the categories are presented on the map. 1.8.3 Groundwater Most of the procedures for the groundwater map is similar to the surface water and precipitation map, but there are some key differences. The areas used for the map presentation (and aggregation) for groundwater are the Canterbury Water Management Strategy (CWMS) zones as opposed to the larger hydrologic areas for surface water and precipitation. The site selection for surface water and precipitation was performed once and is a fixed input to the mapping model, while the groundwater mapping makes the site selection every time the model is run. For the CWMS zones other than the Upper Waitaki, the criteria is that there is at least 10 years of data. Due to a necessity of including the Upper Waitaki even though no well meets the criteria of having at least 10 years of data, the year limit was lowered to 5 years. The only data that was utilised for the groundwater mapping was the monthly manual water level measurements. This was done to increase the number of available wells for the mapping as compared to the wells with continuous data. All values up to the previous month were extracted. As the monthly sampling is performed at various times of the month and may even occasionally occur twice or not at all in a month, a linear interpolation was performed for all sites and the monthly median was taken to provide a more consistent and comparable dataset between sites. The percentiles for the all sites for the entire dataset were calculated and, as with the surface water and precipitation mapping, the previous six months of percentiles were aggregated to the CWMS zones. The categories were then calculated according to the above and plotted using Bokeh. 1.8. Methodology for the monthly precipitation, surface water, and groundwater maps 9
You can also read