PBDEs in freshwater mussels and fish from Flanders, Belgium - OSTI.GOV
←
→
Page content transcription
If your browser does not render page correctly, please read the page content below
BROMINATED COMPOUNDS: BIOTIC LEVELS, TRENDS, EFFECTS

     PBDEs in freshwater mussels and fish from Flanders,
                          Belgium

   Adrian Covaci1, Lieven Bervoets2, Philippe Hoff2, Stefan Voorspoels1, Judith Voets2,
               Karen Van Campenhout2, Ronny Blust2, Paul Schepens 1

toxicological Center, University of Antwerp
2Department of Ecophysiology, Biochemistry and Toxicology, University of Antwerp,
Groenenborgerlaan 171,2020 Antwerp, Belgium

Introduction
       Polybrominated diphenylethers (PBDEs), a class of brominated flame
retardants (BFRs), are widely used in textiles, plastics, electronic equipment and
other materials for more than 30 years1. Due to their massive use, PBDEs have
become ubiquitously present in aquatic organisms and it was recently evidenced
that their levels seem to increase rapidly1. Higher PBDE concentrations were
found in biota from freshwater compared to similar marine species2. This is
probably due to a higher pollution load found near point pollution sources that are
almost exclusively inland located.
       Zebra mussels (Dreissena polymorpha) fulfil the requirements of a good
biomonitoring organism for freshwater ecosystems: they are easy to collect and to
handle, are available in sufficient numbers, have a relative long lifespan, are
sedentary and resistant to various types of pollution without suffering a too high
mortality and have a high filtration rate which favours the bioaccumulation of
organic contaminants3. Fish species are another suitable tool for the biomonitoring
of organic contaminants. The occurrence of PBDEs in fish species from Europe
has already received some attention4,5, but the amount of data is still limited.
        The aim of this study was to evaluate the occurence of PBDEs in zebra
mussels and several representative freshwater fish species (eel, carp and gibel carp) at
different sites in Flanders, Belgium. In parallel, other organohalogenated
contaminants, such as polychlorinated biphenyls (PCBs), p,p ’-DDE and
hexachlorobenzene (HCB) were also measured and their relationship with PBDEs
was investigated.

ORGANOHALOGEN COMPOUNDS - Volume 66 (2004)                                          3801
BROMINATED COMPOUNDS: BIOTIC LEVELS, TRENDS, EFFECTS
Methods and materials
Study area and sample processing
Thirteen sites including canals (7 sites), lakes (5 sites) and 1 pond, where
indigenous zebra mussel are present in sufficient number, were selected in
Flanders (Belgium). From previous sediment quality evaluation6, it was shown that
the sites covered a wide range of pollution levels. Mussels were collected in
September 2002, the soft body parts of the mussels were removed from the shell
and byssus threats were removed. Each sample consisted of a pooled sample of 25
individual zebra mussels which were homogenised using an Ultra-Turrax T8
homogeniser. Samples were stored at -20°C until analysed.
In September and October 2002, juvenile eels (Anguilla anguilla) were
captured at 4 locations (1 canal, 1 pond and 2 basins), while carp (Cyprinus
carpio) and gibel carp (Carassius auratus gibel carpio) were captured at 2 canals
and 1 pond and at 1 basin and 2 canals, respectively. The muscle or liver tissues
were dissected and stored at -20°C until analysis.
Extraction and analysis
The following PBDE congeners 28, 47, 49, 66, 85, 99, 100, 153, 154 and
183 were investigated, while p,p’-DDE, hexachlorobenzene (HCB) and PCB
congeners 28, 31, 74, 95, 99, 101, 105, 110, 118, 128, 132, 138, 149, 153, 156,
163, 170, 180, 183, 187, 194 and 199 were also measured. The method used for
sample preparation and analysis was previously described in detail7,8. Briefly, the
available amount of tissue (50-500 mg for fish liver and 1-4 g for mussels and fish
muscle) was ground with Na2SO4, internal standards were added and the mixture
was extracted for 2 h with 75 ml hexane:acetone (3:1, v/v) into a hot Soxhlet
manifold. After concentration, the extract was subjected to clean-up on acidified
silica and analytes were eluted with 15 ml n-hexane followed by 10 ml
dichloromethane. The eluate was concentrated to 80 pl and transferred to an
injection vial.
PBDEs were determined on an Agilent GC/MS operated in electron-
capture negative ionisation and equipped with a 25m x 0.22mm x 0.25pm HT-8
capillary column. PCBs and OCPs were determined on an Agilent GC-pECD
equipped with a 50m x 0.22mm x 0.25pm HT-8 capillary column. Recoveries of
target compounds ranged between 75 and 90%.
In mussels and fish muscle, method limits of quantification (LOQ) for
individual BDE congeners ranged between 0.01 and 0.02 ng/g wet weight (ww).
For individual PCB congeners, LOQ ranged between 0.03 and 0.16 ng/g ww,
while for HCB and p,p’-DDE, LOQ were 0.23 and 0.63 ng/g ww, respectively. In
ORGANOHALOGEN COMPOUNDS - Volume 66 (2004) 3802BROMINATED COMPOUNDS: BIOTIC LEVELS, TRENDS, EFFECTS
fish liver, LOQ for PBDEs, they were 0.1 ng/g ww, while for individual PCB
congeners ranged between 0.5 and 1 ng/g ww. QC was done as described by
Voorspoels et al.8
Results and discussion
PBDE concentrations in mussels
The average concentrations of PBDEs, PCBs and selected OCPs in zebra
mussel at the different sites are given in Table 1. At most sites, individual PBDE
congeners were present at detectable levels in mussel tissue, with the mean Z
PBDE concentration ranging from 0.15 to 1.82 ng/g ww. Congeners 28 and 66
were below LOQ at most sites. Highest levels of PBDEs were measured in zebra
mussels from Zennegat and Zuid-Willemsvaart canal, while the lowest levels were
measured in zebra mussels from D-Schoten. The sampled sites covered a broad
range of concentration of Z PCB in mussels going from 6.2 to 102 ng/g ww (Table
1). HCB and p,p’-DDE could be measured in mussels from most sites, mean
values ranging from nd (not detected) to 0.58 ng/g ww and from 0.66 to 6.5 ng/g
ww, respectively. Analysis of pollutants in the mussels showed that the selected sites
covered a wide range of pollution from background to high contamination.
Christensen and Platz9 have observed that PBDEs concentrations in blue
mussels collected from several marine and freshwater Danish locations (n=15) had
a relatively low variation (range 0.08 - 0.22 ng/g ww) except one marine sample
with a concentration of 0.81 ng/g ww. Values from the Danish blue mussels are in
the same range or lower than PBDE levels measured in freshwater mussels from
Flanders. Zebra mussels samples collected from different locations in the
Netherlands10 showed variable concentrations of PBDEs. The lowest
concentrations were measured in mussels from IJsel Lake (< 0.10 ng/g ww), while
the highest were measured in mussels from Meuse (0.60 ng/g ww) and Dommel
(1.05 ng/g ww). The PBDE profile is similar with the profile measured in the
present study in mussels from Flemish locations. Mussels collected from
Greenland11 contained much lower PBDE levels (the highest measured value was
0.11 ng/g ww). PBDE concentrations in zebra mussels collected from different
sites of Stockholm (Sweden)12 ranged from 0.4 to 0.79 ng/g ww. The congener
pattern was dominated by BDE 47 and BDE 99 and was similar to the penta-BDE
technical product.
Recently, it was shown that for PBDEs and PCBs, no significant
differences could be found between indigenous and transplanted mussels3. For
ORGANOHALOGEN COMPOUNDS - Volume 66 (2004) 3803BROMINATED COMPOUNDS: BIOTIC LEVELS, TRENDS, EFFECTS
organic contaminants significant correlations between pollutant levels in
transplanted/caged and resident mussels were found with R2 values up to 0.98.
Booij et al.13 compared concentrations of PCBs and PBDEs in blue mussel
(Mytilus edulis) between indigenous and transplanted mussels at one site in the
North Sea. Although mussels were exposed for 42 days, concentrations in
transplanted mussels were up to 2 and 10 times lower than in indigenous mussels
for PCBs and PBDEs, respectively. The equilibrium time for PBDEs seemed to be
longer than for PCBs as already observed by Gustafsson et al14.
PBDE levels in fish species
The average concentrations of PBDEs, PCBs and selected OCPs in eel
liver, carp and gibel carp muscle at the different sites are given in Table 1. BDE 66
and 85 were not quantified in any fish sample, while BDE 49 was not quantified in
eel. Except for one site (Blokkersdijk) where PBDEs were below LOQ in carp
muscle, fish samples from all other sites contained detectable PBDE levels (Table
1). The highest PBDE concentrations (14.0 ± 14.1 ng/g ww) were measured in eel
liver from Watersportbaan (Ghent). The sampled sites covered a broad
concentration range of PCBs and OCPs, with the highest values being consistently
measured in eel liver.
PBDE concentrations in eel liver from the river Elbe (Germany) and its
tributaries ranged from 1.5 to 7.7 ng/g ww in Elbe near the Czech border and from
2.2 to 5.8 ng/g ww in the Elbe tributary4. The measured PBDE profile was similar
to that described in the present study. BDE 47 was the main congener contributing
with 60-80% to the total PBDEs (mean 69%), followed by BDE 100 and by
congener BDE 99, 153 and 154 at much lower percentages.
Eel samples collected from 18 different locations in Flanders15 showed a
great variation in XPBDE concentrations between 10 and 6000 ng/g ww. The
highest concentrations were measured in eel from the Scheldt and its main
tributary, the Leie. It is known that the area covered by the two rivers is subjected
to industrial activities using BFRs (e.g. textile factories). The same profiles as in
our eel samples were once more observed.
Allchin and Morris16 determined PBDEs in edible fish (brown trout Salmo
trutta and eel Anguilla anguilla) from the rivers Skerne and Tees in North East
UK, downstream of a BFR manufacturing plant. PBDEs were detected in fish from
all sites, and the lowest concentrations were found in the two upstream Tees sites.
Mean XPBDE concentrations in trout at these sites were 4.9 and 5.3 ng/g ww,
respectively. The highest concentrations (mean and maximum XPBDE
ORGANOHALOGEN COMPOUNDS - Volume 66 (2004) 3804BROMINATED COMPOUNDS: BIOTIC LEVELS, TRENDS, EFFECTS
concentrations 118 and 197 ng/g ww) were observed just downstream of the plant
in which PBDE formulations had previously been manufactured5, and declined
with downstream with the distance to the plant. Mean XPBDE concentrations in
eel muscle sampled at 4 sites further downstream in the river Tees as far as the
tidal barrage ranged from 130 to 235 ng/g ww.
Carp from Detroit river (US) contained similar PBDE levels as those found
in carp and gibel carp from Flanders (Belgium), while carp samples collected from
a polluted area of Des Plaines river contained higher PBDE concentrations (up to
18 ng/g ww). In addition, the PBDE profile in the latest samples was not similar
with carp samples from Flanders and Detroit river which pointed to additional
sources of octa- and deca-BDE formulations.
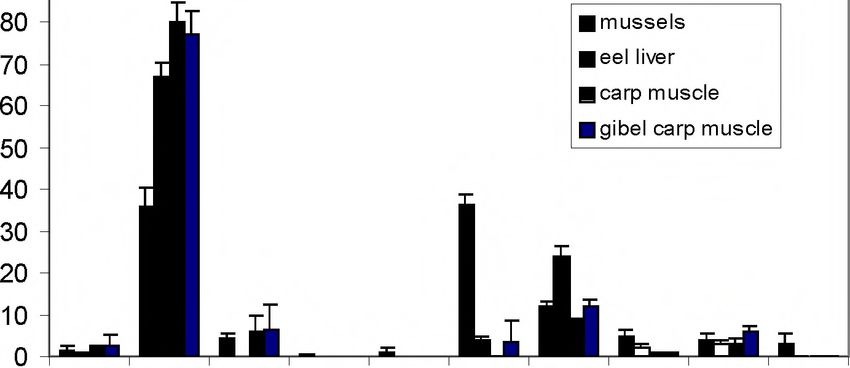
PBDE profiles in freshwater biota.
The contribution of each PBDE congener to the XPBDEs in each
investigated aquatic species from Flanders is presented in Figure 1. As already
reported in literature9,10,13, BDE 47 and BDE 99 were the dominant congeners in
mussels, followed by BDE 100. Other congeners had a lower contribution and the
mussel profile closely reflects the penta-BDE technical product. This is in
accordance with the low metabolic capabilities of mussels and to their primary
filtration function. BDE 183, a marker of the octa-BDE formulation, could also be
found at low concentrations, but this can be attributed to the fine sediment
particles present in the digestive tract of the mussels.
Contrarily, the PBDE profile was similar in all fish species, but different
from the profile in mussels (Figure 1). BDE 47 was the dominant congener in all
fish species (63-82%) followed by BDE 100. BDE 183 was not detected in any
fish samples which is in accordance with previous observations from the Scheldt
river (Belgium)7. BDE 99 was present in all fish species at very low concentrations
or was not detected (carp). A significant debromination of BDE 99 and BDE 183
in the intestinal tract of carp has been already reported17 and a conversion of BDE
99 to BDE 47, and of BDE 183 to BDE 154 and another (as yet unidentified) hexa-
BDE congener was suggested. In another experiment, Stapleton et al.18
demonstrated that, following a feeding experiment with BDE 209, at least 7 penta-
to octa-BDEs were formed during 60 days of exposure. These congeners included
BDE 153 and BDE 154, compounds which are commonly found in fish tissues and
which are usually ascribed to exposure to the penta-mix PBDE formulation.
Low correlation coefficients (R2 < 0.35) could be calculated between
PBDE and PCB concentrations for each species or for all species taken together.
ORGANOHALOGEN COMPOUNDS - Volume 66 (2004) 3805BROMINATED COMPOUNDS: BIOTIC LEVELS, TRENDS, EFFECTS
This indicates separate pollution sources with PBDEs and PCBs, with PBDEs
expected to derive from point sources.
90
28 47 49 66 85 99 100 153 154 183
PBDE congener
Figure 1. PBDE congener distribution (mean percentage ± 2SE) in mussels, carp,
gib el carp and eel.
In conclusion, PBDEs were detected in all freshwater biota samples from
Flanders. The measured concentrations had a large variation and this may be
attributed to different industrial activities along the sampling sites. Compared to
literature levels in zebra mussels were relatively high, whereas levels in fish
tissues were moderately.
Acknowledgement
This study was supported by a GOA-grant (UA-2001/1).
References
1. de Wit C.A. (2002) Chemosphere 46, 583-624.
2. Hendriks A.J., Pieters H. and de Boer J. (1998) Environ. Toxicol. Chem. 17,
1885-1898.
3. Bervoets L., Voets J., Chu S.G., Covaci A., Schepens P. and Blust R. (2004)
Environ. Toxicol. Chem. in press.
4. Lepom P , Karasyova T. and Sawal G. (2002) Organohalogen Compounds 58,
209-212.
ORGANOHALOGEN COMPOUNDS - Volume 66 (2004) 3806BROMINATED COMPOUNDS: BIOTIC LEVELS, TRENDS, EFFECTS
5. Allchin C.R., Law R.J. and Morris S. (1999) Environ. Pollut. 105, 197-207.
6. De Cooman W., Florus M. and Devroede M.P. (1998) Characterisation of
sediments of Flemish water course. Report Ministry of the Flemish
Government, AMINAL, Brussels. p. 56 (in Dutch).
7. Jacobs M., Covaci A. and Schepens P. (2002) Environ. Sci. Technol. 36, 2797
2805.
8. Voorspoels S., Covaci A. and Schepens P. (2003) Environ. Sci. Technol. 37,
4348-4357.
9. Christensen J.H. and Platz J. (2001) J. Environ. Monit. 3, 543-547.
10. de Boer J., Wester P.G., van der Horst A. and Leonards P.E.G. (2003) Environ.
Pollut. 122, 63-74.
11. Christensen J.H., Glasius M., Pecseli M., Platz J. and Pritzl G. (2002)
Chemosphere 47, 631-638.
12. Lithner G., Holm K. and Ekstrom C. (2003) Metaller och organiska miljogifter
i vattenlevande organismer och deras miljo i Stockholm 2001. ITM Rapport
108, 87 pp., Institute of Applied Environmental Research (ITM), Stockholm
University, Sweden.
13. Booij K., Zegers B.N. and Boon J.P. (2002) Chemosphere 46, 683-688.
14. Gustafsson K., Bjork M., Burreau S. and Gilek M. (1999) Environ. Toxicol.
Chem. 18, 1218-1224.
15. de Boer J., Allchin C., Zegers B., Boon J.P., Bransdma S.H., Morris S., Kruijt
A.W., van der Veen I., van Hesselingen J.M. and Haftka J.J.H. RIVO rapport
nr. C033/02, September 2002.
16. Allchin C.R. and Morris S. (2003) Organohalogenated Compounds 61, 41-44.
17. Stapleton H.M., Letcher R.J., Baker J.E. (2004) Environ. Sci. Technol. 38,
1054-1061.
18. Stapleton H.M., Alaee M., Letcher R.J. and Baker J.E. (2004) Environ. Sci.
Technol. 38, 112-119.
ORGANOHALOGEN COMPOUNDS - Volume 66 (2004) 3807BROMINATED COMPOUNDS: BIOTIC LEVELS, TRENDS, EFFECTS
Table 1. Mean concentrations (SD) of organic contaminants (ng/g wet wt) in zebra
mussels, carp and gibel carp muscle and eel liver from lakes and canals in Flanders,
Belgium.__________ ______ __________ ______ __________ ___________ ______
Location N Lipid XPBDEs % ZPCBs HCB p,p’-
s (%) BDE DDE
47
Mussels
AWW (Duffel) 3 1.3 0.30 (0.03) 31 20 (1) ND ND
Weerde (Zemst) 3 0.9 0.46 (0.07) 31 67 (5) 0.25 (0.02) 2.2 (0.4)
Nekker (Mechelen) 3 0.9 0.22 (0.04) 45 12 (1) ND 1.1 (0.1)
Walenhoek (Niel) 3 1.6 0.26 (0.20) 35 7 (1) ND 1.5 (0.1)
E10 (Schoten) 3 0.9 1.21 (0.26) 31 6 (1) ND 0.5 (0.3)
Nete Canal (Nijlen) 2 0.5 0.48 (0.05) 22 45 (5) 0.34 (0.07) 0.7 (0.1)
Z-W Canal 4 0.8 1.82 (0.20) 36 50 (2) 0.58 (0.08) 1.4 (0.1)
(Rekem/Lanaken)
H-Boch 1 (Kaulille) 2 0.8 0.35 (0.10) 43 46 (2) 0.47 (0.03) 1.3 (0.1)
H-Boch 2 (Dessel) 3 0.7 0.64 (0.14) 38 49 (5) 0.45 (0.04) 1.0 (0.2)
Beverlo (Lommel) 3 0.8 0.92 (0.21) 36 48 (6) 0.48 (0.01) 1.1 (0.1)
D-Schoten (Turnhout) 3 0.5 0.15 (0.04) 53 30 (2) 0.25 (0.01) 0.9 (0.1)
Mol-Dessel (Mol) 3 1.0 0.75 (0.03) 33 52 (1) 0.34 (0.04) 1.1 (1.1)
Zennegat (Walem) 3 1.4 1.48 (0.04) 36 102 (3) ND 6.6 (0.5)
Eel
Canal Ieper-Ijzer 9 n.a. 3.64 (2.40) 72 311 (152) 2.24 (0.78 24.2
(Boezinge) (37.4)
Oude Maas (Dilsen- 1 n.a. 2.46 (1.37 63 494 (329) 0.81 (0.37) 6.0 (5.0)
Stokkem) 0
Zuun (Sint-Pieters- 1 n.a. 1.98 (1.08) 63 138 (95) 0.91 (0.22) 7.3 (2.9)
Leeuw) 1
Watersportbaan 1 n.a. 14.0 (14.1) 72 393 (203) 0.71 (0.35) 11.0 (3.8)
(Ghent) 0
Carp
Canal Ieper-Ijzer 7 1.3 1.56 (0.87) 83 74 (52) 0.61 (0.42) 9.4 (8.7)
(Boezinge)
Blokkersdijk 1 0.6 < 0.10 n.a. 37 (6) < 0.23 2.0 (0.4)
(Antwerp) 0
Durme (Hamme) 6 2.4 6.0 (3.26) 78 52 (17) 0.28 (0.07) 40.7
(13.0)
Gibel carp
Zuun (Sint-Pieters- 8 1.3 0.62 (0.31) 73 25 (15) 0.44 (0.17) 5.9 (2.6)
Leeuw)
Canal Willebroek 4 0.9 3.75 (0.68) 76 210 (43.) 0.55 (0.16) 7.9 (2.2)
(Willebroek)
Scheppelijke Nete 5 0.4 0.97 (0.48) 82 132 (82) 0.33 (0.05) 9.5 (9.5)
(Balen)
n.a. - not available
ORGANOHALOGEN COMPOUNDS - Volume 66 (2004) 3808You can also read