The "Mussel case-study": Overview of the European mussel farming and main issues at stake - "This project has received funding from the European ...

Page created by Victoria Harvey
 
CONTINUE READING
The "Mussel case-study": Overview of the European mussel farming and main issues at stake - "This project has received funding from the European ...
The “Mussel case-study”: Overview of
 the European mussel farming and main
            issues at stake

“This project has received funding from the European Union’s Horizon 2020 research and innovation
                         programme under grant agreement No 635188”.
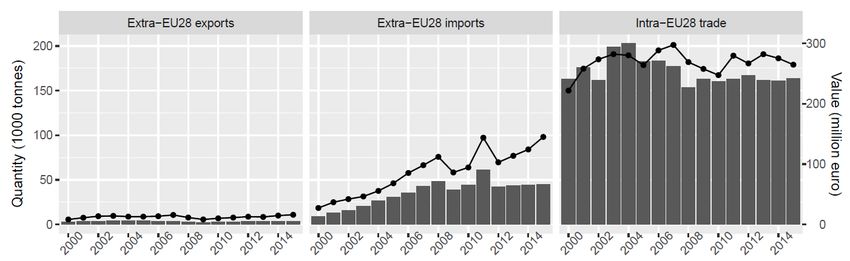
The "Mussel case-study": Overview of the European mussel farming and main issues at stake - "This project has received funding from the European ...
Summary
Overview of the European mussel farming industry and its competitive
environment
•   Trends in production and evolution of the EU market share in world supply

•   Main striking evolutions in terms of external trade (EU28 imports and exports)

•   Structure of the EU mussel farming sector and indicators of profitability

Main issues at stake for the Mussel farming sector
•   Bottlenecks identified by the participants

•   Challenges as regards the development of sustainable European aquaculture

•   Examples of room for improvement to be analysed within the SUCCESS project

                                                                                 2
Evolution of the world supply of mussels (FAO Fishstat)
                            Evolution of mussel production worldwide
                                                                         Top 10       Ranking thousand
                     2000
                                                                        countries    (volume) tonnes
                     1800
                     1600                                                  China        1       806
   thousand tonnes

                     1400                                                  Chili        2       245
                     1200                                                  Spain        3       221
                     1000
                                                                         Thailand       4       127
                      800
                      600                                              New Zealand      5       98
                      400                                                 France        6       81
                      200                                                  Italy        7       79
                        0                                              Corean Rep.      8       58
                            1993
                            1994
                            1995

                            2013
                            2014
                            1996
                            1997
                            1998
                            1999
                            2000
                            2001
                            2002
                            2003
                            2004
                            2005
                            2006
                            2007
                            2008
                            2009
                            2010
                            2011
                            2012
                                                                       Netherlands      9       54
                                     Aquaculture     Fisheries          Danemark       10       43

Evolution of the aquaculture production of mussels from China, EU28 and Chile
                                                                                                         3
Main players of the European aquaculture supply of
                    mussels (FAO Fishstat)

100%                                              100%
 90%                                     Other     90%
 80%                                               80%
                                         IRL
 70%                                               70%
 60%                                     UK
                                                   60%
 50%                                     GRE       50%
 40%                                               40%
                                         NDL
 30%
                                         FRA       30%
 20%
                                                   20%
 10%                                     ITA
                                                   10%
  0%                                     SPA        0%
       2000
       2001
       2002
       2003
       2004
       2005
       2006
       2007
       2008
       2009
       2010
       2011
       2012
       2013
       2014

                                                         2000
                                                         2001
                                                         2002
                                                         2003
                                                         2004
                                                         2005
                                                         2006
                                                         2007
                                                         2008
                                                         2009
                                                         2010
                                                         2011
                                                         2012
                                                         2013
                                                         2014
   •   In volume, Spain exceeded 40% of the EU28 production during the 2000-2014
       period (in average)
   •   Top 4 producers (SPA, ITA, FRA, NDL) reached 82%
   •   In value, the share of the Top 4 is nearly the same, but the ranking is modified
       (FRA, SPA, NDL, ITA) due to the higher valorisation of blue mussels

                                                                                          4
Intra & Extra EU28 trade of mussels (Eurostat COMEXT)

•   Supply deficit of the mussel EU28 market trade
•   Very few Extra-EU28 exports but conversely increasing Extra-EU28 imports in
    volume and value (line above)
•   Exchange flows (imports) of mussels mainly at intra-EU level

                                                                                  5
Intra & Extra EU28 imports of mussels by type of product
                                (Eurostat COMEXT)

            IMPORT EXTRA EU28 (% in value)                             IMPORT INTRA EU28 (% in value)
100%                                                            100%
90%                                                             90%
                                       Prepared or
80%                                                             80%
                                       preserved mussels
70%                                                             70%
60%                                                             60%
50%                                    Mussels, frozen,         50%
40%                                    dried, salted or in      40%
30%                                    brine                    30%
20%                                    Live, fresh or chilled   20%
10%                                    mussels                  10%
 0%                                                              0%
       2000

                                                                       2012
       2001
       2002
       2003
       2004
       2005
       2006
       2007
       2008
       2009
       2010
       2011
       2012
       2013
       2014
       2015

                                                                       2000
                                                                       2001
                                                                       2002
                                                                       2003
                                                                       2004
                                                                       2005
                                                                       2006
                                                                       2007
                                                                       2008
                                                                       2009
                                                                       2010
                                                                       2011

                                                                       2013
                                                                       2014
                                                                       2015
  •    Extra-EU imports are exclusively made of processed mussel products (increase
       of preserved mussels at the expense of other products)
  •    Intra UE trade is still dominated by live, fresh or chilled mussels

                                                                                                        6
Evolution of EU28 imports of prepared or preserved
                                      mussels (Eurostat COMEXT)

                          EU28 Imports of prepared or preserved mussels                                                                          EU28 imports of prepared or
                    140                                                                                                                           preserved mussels in 2015
                    120
value (Million €)

                    100

                    80
                                                                                                                                                 23%                      Chile
                    60

                    40                                                                                                                      1%                            other Extra
                                                                                                                                                                          EU28
                    20
                                                                                                                                                                          Intra EU28
                     0
                                                                                                                                                            76%
                                                                                                                2012
                                                                                                                       2013
                                                                                                                              2014
                           2000
                                  2001
                                         2002
                                                2003
                                                        2004
                                                               2005
                                                                      2006
                                                                             2007
                                                                                    2008
                                                                                           2009
                                                                                                  2010
                                                                                                         2011

                                                                                                                                     2015
                                                       Intra EU28               Extra EU29

                    •       As concerns the supplying in preserved mussels, extra-EU imports have been
                            progressively expanding and competing with intra-EU imports
                    •       Chile became the leader with 76% of the market share of EU28 imports of preserved
                            mussels in 2015

                                                                                                                                                                                  7
Main importing countries of live, fresh or chilled mussels
                 (Eurostat COMEXT)

               Main importing countries (volume)                   Main importing countries (value)
100%                                                        100%

80%                                                Others   80%

60%                                                NDL      60%
                                                   ITA
40%                                                         40%
                                                   GER
20%                                                FRA      20%
                                                   BEL
    0%                                                       0%
          2004

          2012
          2000
          2001
          2002
          2003

          2005
          2006
          2007
          2008
          2009
          2010
          2011

          2013
          2014
          2015

                                                                     2000
                                                                     2001
                                                                     2002
                                                                     2003
                                                                     2004
                                                                     2005
                                                                     2006
                                                                     2007
                                                                     2008
                                                                     2009
                                                                     2010
                                                                     2011
                                                                     2012
                                                                     2013
                                                                     2014
                                                                     2015
•        For the bulk of the intra-EU market (live, fresh or chilled mussels), the main
         importing countries in volume are France, Italy and Belgium while in value
         Belgium represents the main outlet, followed by France

                                                                                                      8
Main exporting countries of live, fresh or chilled mussels
                   (Eurostat COMEXT)

       Main exporting countries (volume)                   Main exporting countries (value)
100%                                                100%
                                           Others
80%                                                 80%
                                           UK
60%                                                 60%
                                           GRE
40%                                        IRL      40%
                                           DNK
20%                                                 20%
                                           SPA
 0%                                        NDL       0%
       2009
       2000
       2001
       2002
       2003
       2004
       2005
       2006
       2007
       2008

       2010
       2011
       2012
       2013
       2014
       2015

                                                           2005

                                                           2012
                                                           2000
                                                           2001
                                                           2002
                                                           2003
                                                           2004

                                                           2006
                                                           2007
                                                           2008
                                                           2009
                                                           2010
                                                           2011

                                                           2013
                                                           2014
                                                           2015
                             3,50
                             3,00                                         SPA
       Export price (€/kg)

                             2,50                                         NDL
                             2,00                                         DNK
                             1,50                                         IRL
                             1,00                                         GRE
                             0,50                                         UK
                             0,00
                                                                          Others
                                                                                              9
Structure and employment of the main Mussel farming segments
            (STECF aquaculture data – average 2013/2014)

                                                                                 ITA Long-line
                                         NDL Bottom FRA Bottom      SPA Raft
                                                                                    (2013)
    Number of enterprises                         56         285        2 034             159
    Number of employees                  na                1 819        8 600             996
    Number of FTE                                154       1 077        2 312             829
    Total mussel sales (tonnes)               41 812      59 155      190 062          67 385
    Mussel price indicator                      1,40        1,87         0,50            0,73
    Number of FTE/enterprises                     2,8         3,8          1,1             5,2
    ratio Employees/FTE                  na                   1,7         3,7              1,2
    Total mussel sales/FTE (tonnes)              272          55           82               81
    Total value of assets/FTE (1000 €)           545         181           95               68

•   Mussel farming in the Top4 EU producer countries relies on different species & production
    system
•   Higher valorization for blue mussels than for Mediterranean mussels
•   More capital intensive PS, more concentrated production in the Netherlands
•   High level of employment, pluriactivity and part-time jobs in Spain (labour intensive PS)

                                                                                                 10
Cost structure of the main Mussel farming segments
     (STECF aquaculture data – average 2013/2014 except for Italy)

              Spanish Raft segment                                  Netherlands - Bottom segment
                                                                  (culture on bottom in deep water)
                                     Energy costs
            -1%5%
           3%
                     7%              Raw material costs:
   19%                    5%         Livestock costs                               8%    11%
                                                                              5%
                                     Repair and maintenance                                     6%

                                     Labour (Wages and                                           12%
                                     salaries + imputed value)
                                     Other operational costs            35%

              62%
                                     Depreciation of capital                              24%

                                     Financial costs, net

         Italy - Long line Segment (2013)                            France - Bottom segment
                                                                         (bouchot culture)
                                     Energy costs

          8% 2% 6%                   Raw material costs:
                                     Livestock costs                                 4% 3% 6%
   8%
                                     Repair and maintenance
                                                                                                5%
                               31%
                                     Labour (Wages and salaries         32%
                                     + imputed value)
                                     Other operational costs
    39%               5%                                                                             33%
                                     Depreciation of capital

                                     Financial costs, net                          17%

                                                                                                           11
Labour productivity and remuneration of work
         (STECF Aquaculture data 2013/2014)

300                                                            300

250                                                            250

200                                                            200

150                                                            150

100                                                            100

50                                                             50

 0                                                             0
      NDL bottom      FRA bouchot   SPA raft     ITA LL 2013

            GVA/FTE (1000 €)        Mean wages/FTE (1000 €)
            sales volume/FTE (T)

                                                                     12
Mussel farming case-study

Context /Background

•   On the supply side: slightly downward trend in the European production (trend
    even more marked in recent years)

•   Increasing deficit of the EU mussel market, but on processed products only

•    On the demand side, outlooks of growth remain significant (consumer demand
    for affordable fresh/processed seafood produced by low-input aquaculture)
    •   Increasing demand for organic products
    •   Increasing demand for new valued-added products

                                                                                 13
Mussel farming case study

•   Bottlenecks identified by Mussel CS participants
    – Environmental: water quality degradation, epizootic events, climatic factors, blooms of
      toxic phytoplankton, red tides, natural competitors…

    – Regulation and governance: difficult access to new farming sites or to the renewal of
      existing sites, insecure production rights, increasing use conflicts …

    – Structural/Economics: lack of professionalization of the activity, insufficient
      organisation of producers, lack of integration of dispatch/purification centres, lack of
      outlets on the domestic market…

    – Marketing: Insufficient valorisation of mussels at the production stage could also be
      considered as a bottleneck in some countries.

                                                                                           14
Mussel farming case study

General challenges

   – Reducing the factor of profitability decrease due to environmental concerns or/and to
     unsustainable cultural practices, in particular via co-management systems

   – Improving valorisation and consolidating the market power of producers along the
     value chain, for instance through the setting up of producer organisation or/and the
     involvement in labelling approaches

   – General objectives have been defined in national strategic plans for aquaculture
     (simplification of administrative procedure, conditions of access to new sites and spatial
     planning tools…) but depend on priorities attributed to the shellfish farming sector in
     different countries

                                                                                         15
SUCCESS Mussel CS: Focus on « room for improvement »

    The RFI which have been identified for further analysis are:
•     Greece, ATEITH: Development of new products (unvalved mussels with extended lifespan) for
      targeting both traditional markets in consuming areas (i.e. Thessaloniki) and other areas with
      high potential due to tourism (i.e. Crete).
•     Greece, ATEITH: Assessing consumer preferences in terms of certification- labelling through
      choice experiments. Preferences of producer certification (Organic) versus Retail certification
      (own retailer standards) versus No certification will be tested along with domestic origin, EU
      origin and Non EU origin.
•     Italy, NISEA : Influence of labelling (PDO Scardovari) on the primary sector and on the
      coordination of the value chain (opportunities for the producers to sell their mussels in
      different ways, with or without label)
•      France, IFREMER: Valorisation of quality and environmental attributes of mussel farming in the
      Norman-Breton Gulf through voluntary labelling approach (PDO, organic label) and through
      regulatory tools (co-management).

                                                                                                  16
You can also read