Petrochemistry and Chemical Engineering - 4C Conference
←
→
Page content transcription
If your browser does not render page correctly, please read the page content below
Petrochemistry and
    Chemical Engineering

  The Role of Enhanced Shale Oil &
      Gas Recovery in the US &
Development & Pricing of Significant
 Potential Shale Production in Other
 Countries Such as South America,
       Canada, & Europe/Asia
             2018/2019

  Dr. Davis L. Ford, PhD, PE, NAE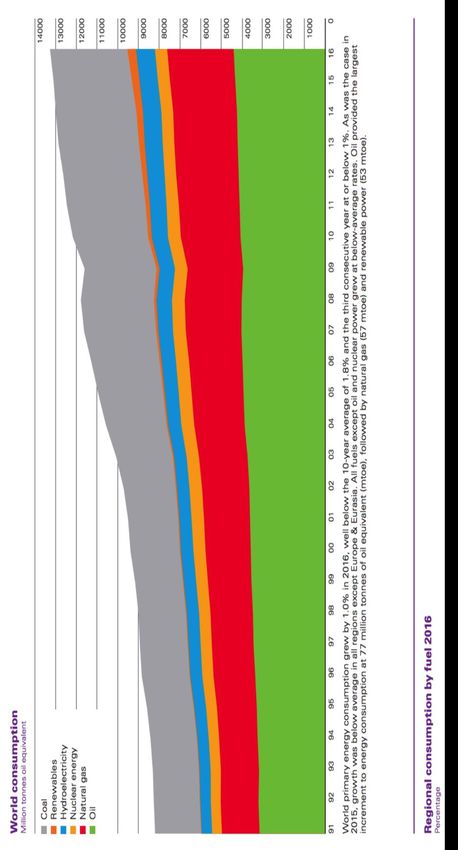
Key Points Fossil fuels are here to stay for at least the next 50 years The impact on GDP changes people’s lives Increase in GDP makes for a better world
Current Oil and Gas Extraction
Status
Major producers of oil and gas extraction: United
States, Russia and Saudi Arabia
Price of Brent Crude in the Range of $60-70 dollars
per BBL (2018)
With increase in proven yet undeveloped reserves,
prices may temporarily decline
Proven reserves in the world plan to develop
production, such as Chile and Argentina, China,
Canada, Mexico and Norway (off shore)
Countries with a sound GDP will be importing oil and
gas as the most cost effective way from competitive
countries in the International Market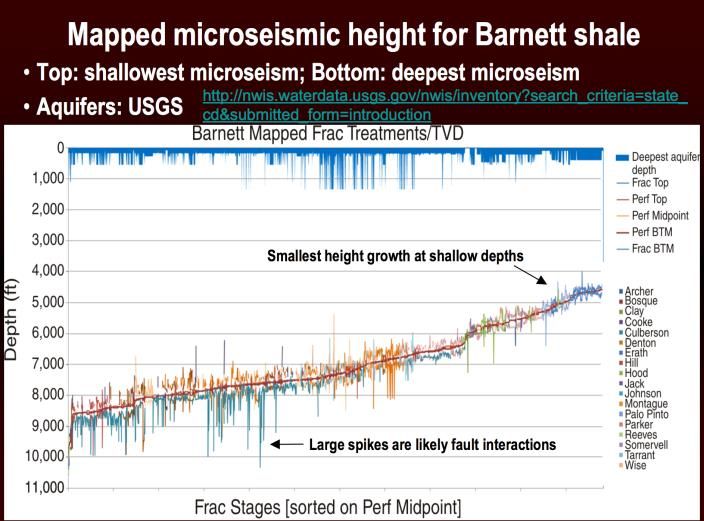
Abstract
The Role of Science in Developing Enhanced Oil & Gas Resources, Being
Environmentally Sound, & Protecting Water Use
Global transformation with fossil fuel as primary source which have an effect
on GDP, export/import changes, and global effects on pricing
History of evolution of oil and gas production in the United States
Global development: European Community, India, China, Brazil, Chile,
Argentina and Mexico all have proven reserves
All time high extraction of tight natural gas and oil being environmentally
sound and protecting domestic water supplies
Hydraulic fracking below potable water supplies
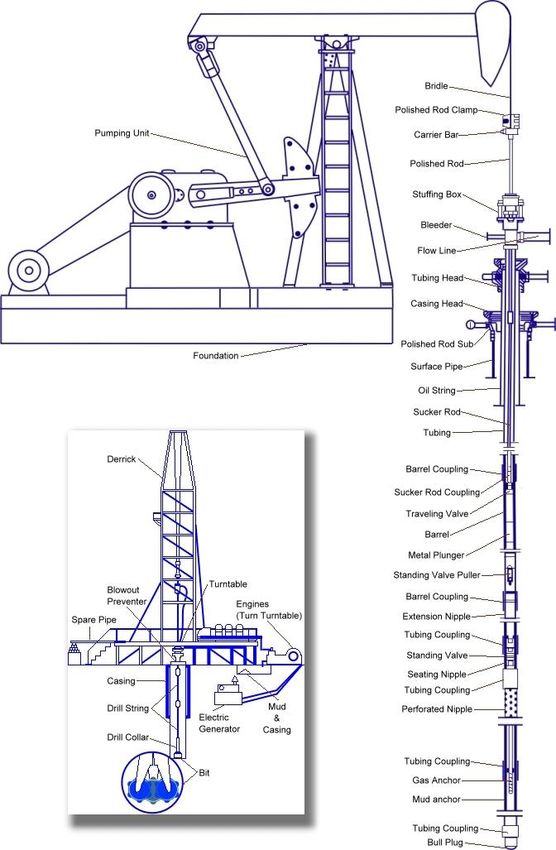
Drilling Diagrams – Vertical and Horizontal, Proper Casing
Record pace of pipeline construction to supply refineries & terminal ports
Pronounced effect on GDP
Natural gas treatment, delivery, from source to energy deficient countries
exported as LNG
Cost subsidies and economic pricing of oil and gas extraction, hydro power,
coal, nuclear, wind, and solar. Cost of power by region
There are no “Dry Holes” and more attributes of highly advanced geological
technology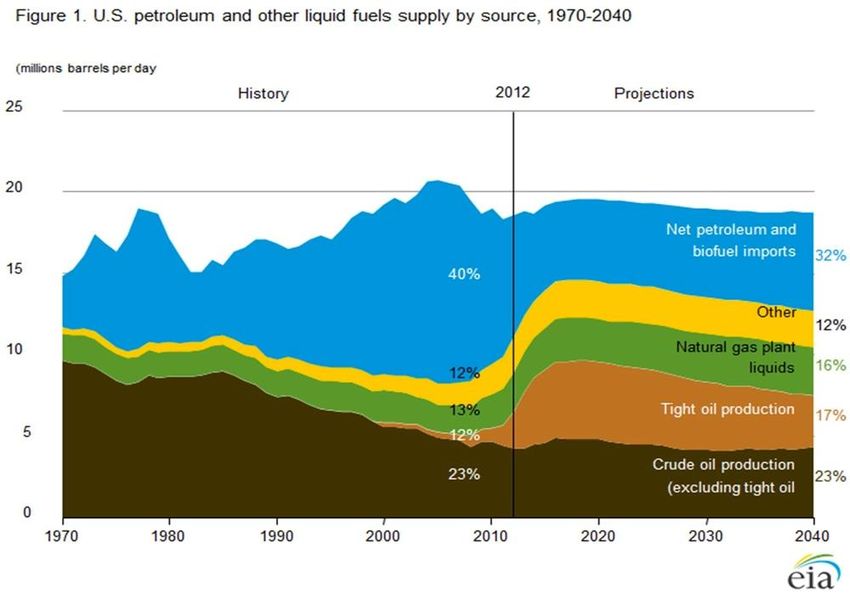
US Moving Toward Net Exports
Note: aggressive increase in natural gas (light
        blue) and petroleum (dk blue)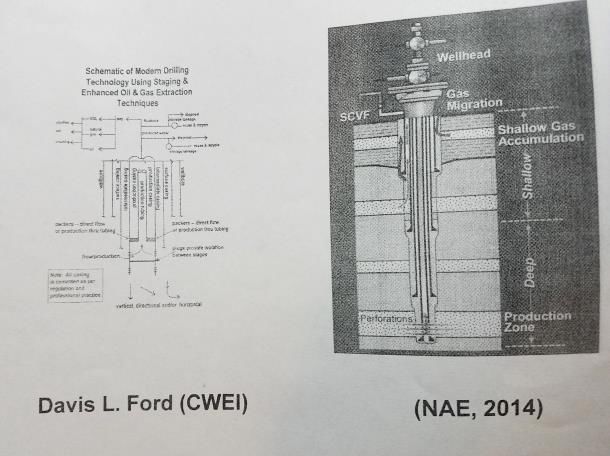
Sources of U.S. Energy Production
 Note: fossil fuels make up majority of Btu Production
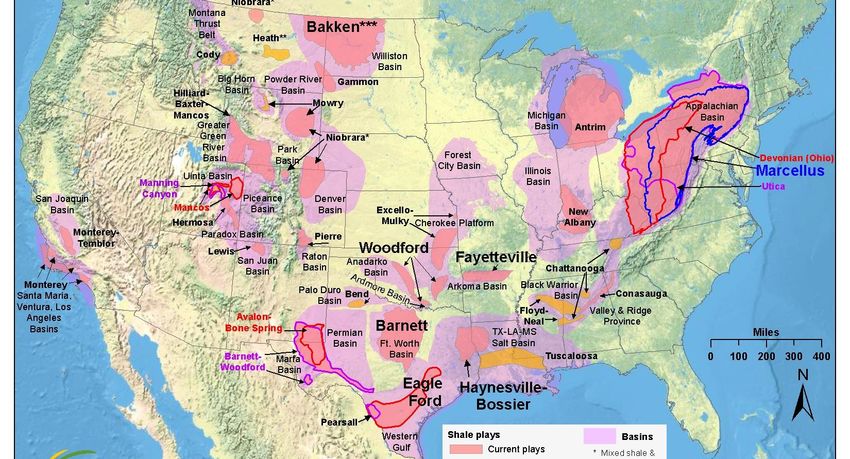
Shale Gas Plays, U.S
We Are Experiencing An Energy Renaissance
Global Perspective on U.S. Export
Positions of Natural Gas
Boom of fracture related oil and natural gas
production and U.S. exporting
Many in European Community are planning on
natural gas as the primary supply of energy in the
future
Ukraine, Poland, Germany, and contiguous countries
Major opportunity for domestic (U.S.) production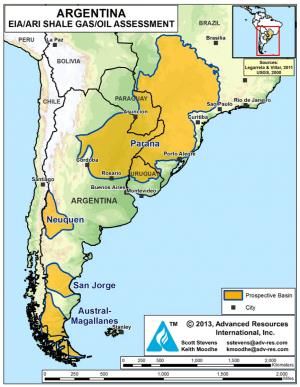
World Shale Gas Reserves
                       Russia

             US to
             Europe
US to Asia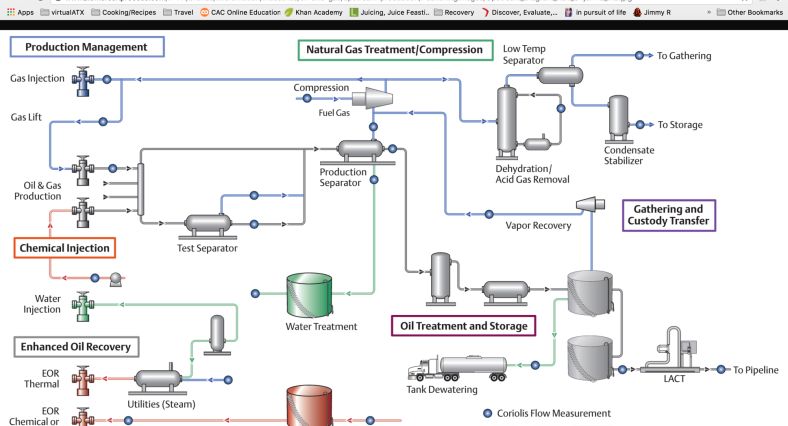
Argentina
• Enhanced extraction just beginning
to occur
• Vast amounts of natural gas
• Current major importer of fossil
fuel
• Key difference is in US, citizens
own most mineral rights
• Government ownership makes it
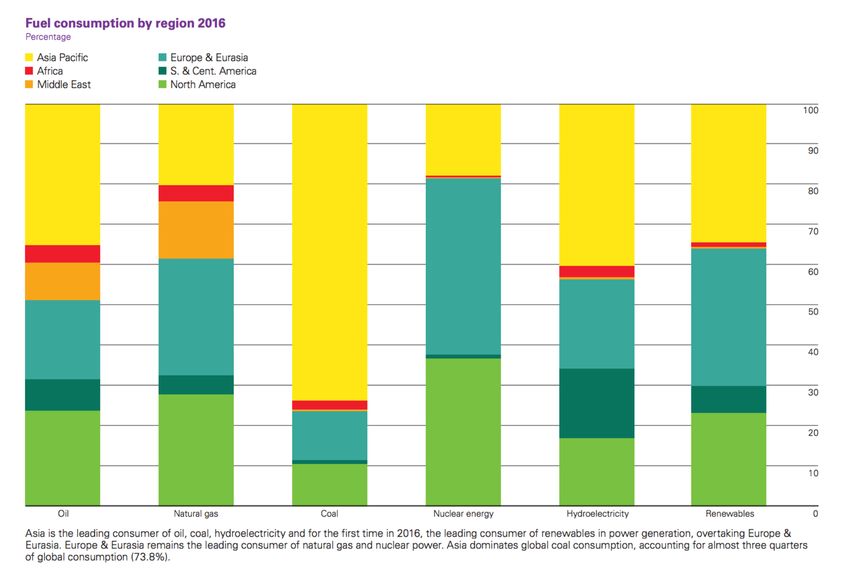
more complexFuel Consumption by Region
Note: Asia in yellow is 73% of coal consumption,
with the USA at 11%
ASIA
73%
of
Coal
USA
USA USA
USA USA USAOverall World Fuel Consumption
Note: coal in grey, oil in green, natural gas in red
Coal
Renewables
Natural Gas
OilUS Fuel Supply Growth Tight Oil and Gas Growth- TECH Driven
U.S Natural Gas Production
Growth of Shale and Tight Gas is TECH driven
Microseismic Barnett Shale
 Fracking is No Threat to Fresh Water Resources
Drilling Diagram
Redundant Casing and Cement
Production Diagram
Natural Gas Treatment
Federal Subsidies for Energy

Dollars per Megawatt Hour (US Dpt of Energy)

Oil and Gas      $0.00

Hydro            $0.84

Coal             $0.64

Nuclear          $3.14

Wind             $56.29

Solar            $775.64
Pence per kWh

                0
                    2
                        4
                            6
                                8
                                    10
                                         12
                                                                         14
                                                                                             16
                                                                                                                  18
    Norway
    Sweden
       USA
Luxembourg
     Finland
    Canada
     Poland
New Zealand
Netherlands
                                                                          Price (excl tax)
                                                                                                  Tax Component

   Hungary
 Czech Rep
                                          IEA Median (including taxes)

     Turkey
      Korea
   Denmark
     Greece
     Austria
     France
    Belgium
      Spain
     Ireland
    Portugal
   Slovakia
         UK
                                                                                                                              one of the smallest tax components

 Switzerland
   Germany
      Japan
        Italy
                                                                                                                       Note: the US is one of the lowest in the world with
                                                                                                                                                                             Global Industrial Electricity Prices
Largest Emissions Changes
Decrease in US Without Carbon Tax, or Gov’t Intervention
700
600
500
400
300
200
100
0
-100 China India Japan EU US
-200
-300
Thousand Metric Tons CO2GDP Impact
GDP
Consumption
Investments
Government spending
Exports minus imports
Conclusion
When US becomes energy independent the GDP
increases accordingly. This is a major national issue.Fossil Fuel Development
and GDP USA
6.00%
5.00%
4.00%
3.00%
2.00%
1.00%
0.00%
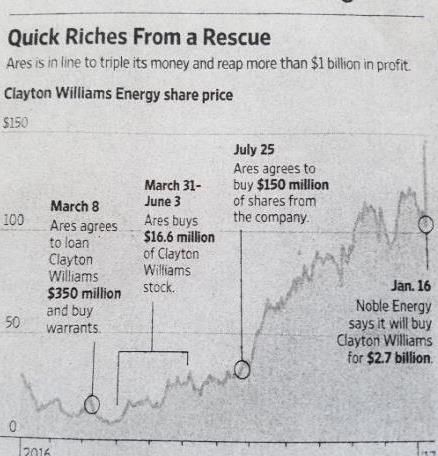
1972 1980 1990 2000 2015 2017WSJ Jan 18, 2017 How to Rescue a Company in Oil and Gas
Key Points Fossil fuels are here to stay for at least the next 50 years The impact on GDP changes people’s lives Increase in GDP makes for a better world
Dr. Davis L. Ford
Davis L. Ford, PhD, PE, NAE
Davis Ford is a practicing environmental engineer with over fifty years of experience in the
field. In addition he serves on the faculty at The University of Texas at Austin as an Adjunct
Professor and a Visiting Professor of Petroleum Engineering at Texas Tech University. He has
published hundreds of technical papers, has co-authored or contributed to ten textbooks,
written several biographies, and also co-authored a children’s book. Dr. Ford lectures
extensively throughout the United States, Europe, South America, and Asia. Dr. Ford received
his bachelor’s degree in Civil Engineering at Texas A&M University and his master's and
doctorate degrees in Environmental Engineering from The University of Texas at Austin. He
is a Distinguished Engineering Graduate of both Texas A&M University and The University of
Texas as well as a Distinguished Alumnus of Texas A&M. Dr. Ford was elected to The
National Academy of Engineers (affiliated with the National Academy of Science and the
National Academy of Medicine) in 1997. In 2005, he was inducted into The Academy of
Medicine , Engineering, and Science at Texas. He is an Eagle Scout. He resides in Austin,
Texas, with his wife of more than fifty years, his three daughters close by, and ten
grandchildren - nine boys and one girl.

        To learn more about Dr. Ford please visit his website: www.davislfordphd.com
             If you wish to contact him directly please email dfordphd@aol.com
You can also read