BEA's Regional Accounts: An Update - C2ER Annual Conference 2019 June 7, 2019
←
→
Page content transcription
If your browser does not render page correctly, please read the page content below
BEA’s Regional Accounts: An Update
         C2ER Annual Conference 2019
                June 7, 2019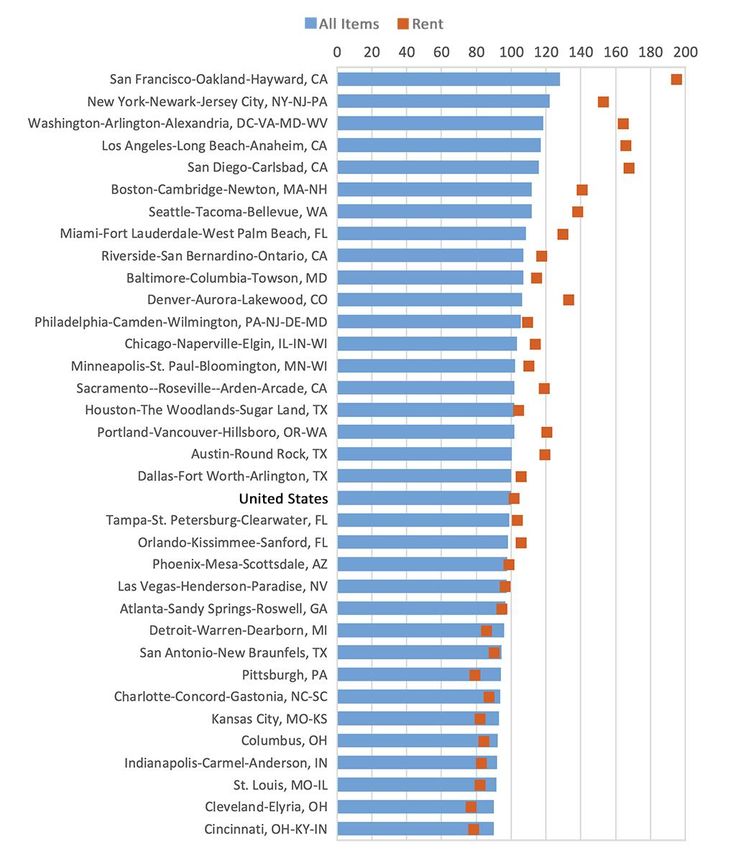
Outline
•Regional Accounts Core Statistics

•Recent Additions

•Program Initiatives/New Statistics

                                             2

                                      6/11/2019
BEA’s Regional Core Statistics

•Comprehensive subnational measures of U.S.
 economic activity

•Consistent with BEA’s National and Industry
 Economic Accounts

•Consistent across geography and over time
BEA’s Regional Core Statistics, Cont.
Gross Domestic Product
• The market value of goods and services produced by factors of
  production in each geography

• Measured by the income earned from current production

• Real (chained-dollar) GDP deflated using national industry prices

• State Annual (1963-forward)

• State Quarterly (2005-forward)

• Metropolitan Area Annual (2001-forward)
BEA’s Regional Core Statistics, Cont.
Personal Income and Employment
• Income received by or on behalf of residents of a geography
  o   Net earnings by place of residence
  o   Property income
  o   Personal current transfer receipts

• Number of jobs, full and part-time
  o   Wage and salary employment
  o   Proprietors’ employment

• State Annual (1929/1969– forward)

• State Quarterly (1948 – forward)

• County and Metro Area Annual (1969 – forward)
BEA’s Regional Core Statistics, Cont.
Regional Input Output Modeling System (RIMS II)
• Regional economic model for impact analysis
  o   Study economic impacts of a wide range of projects
  o   Measure impact of an initial change in economic activity on industries
      within a defined geography

• RIMS II multipliers
  o   Based on industry relationships from national input-output accounts
  o   Adjusted for leakages with regional data
  o   Customizable geographies
  o   The impacts measured in terms of output, value added, earnings, or
      employment
Recent Additions
• Real Personal Income/Regional Price Parities (4/24/14)
o Annual 2008-2017 | States and Metropolitan Areas
• Personal Consumption Expenditures (PCE) by State (12/1/15)
o Annual 1997-2017 | 16 spending categories
• Quarterly GDP by State (12/10/15)
o 2005Q1-2018Q4 | 21 industries
• Arts and Cultural Production Satellite Account (ACPSA)
o Annual 2001-2016 | Core and supporting arts industries
o State compensation and employment (4/19/17) | State value added
(3/6/18)Regional Price Parities (RPPs) Regional price parities • Spatial price index o State and metropolitan areas o Goods, rents, other services • Measure the differences in the price levels of goods and services across states and metropolitan areas for a given year • Regional price levels expressed as a percentage of the overall national price level for a given year • Average RPP across states (US RPP) = 100
Interpreting RPPs
Average price level in Connecticut
 o   8.0% higher than national average (108.0/100.0)
 o   11.3% higher than in Utah (108.0/97.0)

                                  Regional Price Parities, 2017

                                                         Services
                             All Items   Goods
                                                      Rents   Other
  United States                  100.0         99.4   101.2       100.0
     Connecticut                 108.0        104.0   113.1       109.0
     Hawaii                      118.5        111.3   156.4       103.2
     Mississippi                  85.7         94.1    62.8         93.3
     North Dakota                 90.1         94.8    78.3         90.8
     Utah                         97.0         96.6    93.9         99.6
  Range across all states         32.8         17.2    95.0         24.1
                                                                                  9

                                                                           6/11/2019
RPPs for Large Metro Areas, 2017
10
6/11/2019Real Personal Income
•Personal income adjusted for price level differences
o Across regions
o Over time
•Use RPPs in conjunction with BEA’s personal
consumption expenditures (PCE) price index
•Allows for comparisons of the purchasing power of
personal income across regions and over time
11
6/11/2019Real Personal Income, Cont.
Price adjustment for HI
PI 75.4
PI at RPPs = = = 63.6 PCE Current$ Real
RPP 1.185 State Price RPP PI PI
Index ($ billion) ($ billion)
63.6
Balancing factor: = 63.8 Hawaii 106.1 118.5 75.4 60.2
0.996
PI at RPPs 63.8 South
106.1 88.2 42.5 45.5
Real PI = = = 60.2 Dakota
PCE Index 1.061
United
PI 75.4 106.1 100.0 16,820.3 15,857.2
States
IRPD∗ = = = 125.2
Real PI 60.2
* Implicit Regional Price Deflator
12
6/11/2019PCE by State
• Measure of household spending by state of residence
• Includes
o Out-of-pocket household spending
o Spending on behalf of households
o Imputations
▪ Owner-occupied housing
▪ Financial services without explicit payment
o Net expenditures of non-profit institutions serving households
• Accounting framework aligns state personal income
and expenditures
13
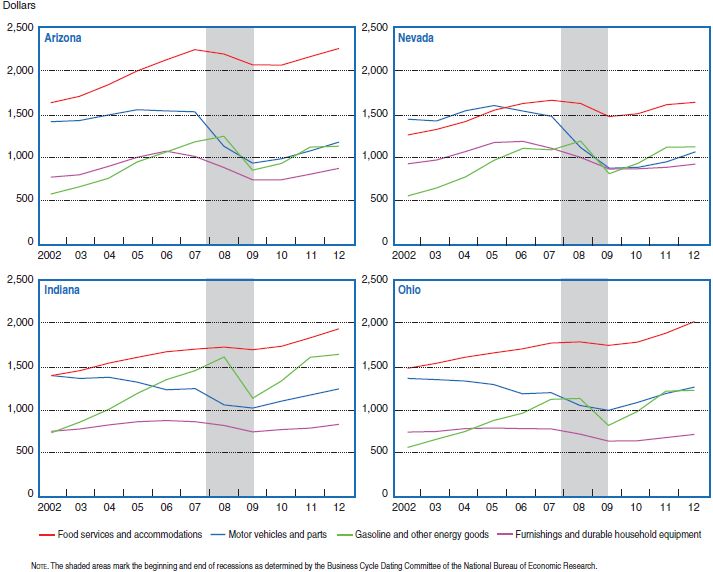
6/11/2019PCE by State, Cont.
•Examine spending trends over time
•Per capita measures indicators of economic well-
being
•Fiscal policy, regional macro and I-O analysis
•Geographic marketing information
14
6/11/2019PCE by State, Cont.
15
6/11/2019Quarterly GDP by State
•Earlier read on state of the economy
•Earlier identification of weakening industries
•More precise timing of upturns and downturns in
state economic activity
16
6/11/2019Quarterly GDP by State, Cont.
Michigan Real GDP: Percent Change from Preceding Period
20
15
10
5
0
-5
-10
-15
Annual GDP Quarterly GDP
-20
-25
-30
1 2 3 4 1 2 3 4 1 2 3 4 1 2 3 4
2007 2008 2009 2010
17
6/11/2019Arts and Cultural Production (ACPSA)
BEA’s Satellite Accounts
• Frameworks designed to expand the analytical capacity of the
standard accounts without interfering with their general
purpose
• Provide a laboratory for development of concepts and
methodologies
• Expand the detail of the accounts and allow for flexible
classification structures
• Allow more focus on a specific activity or sector
18
6/11/2019ACPSA, Cont. • Measures the impact of arts and cultural activities on the U.S. and individual state economies • The value of the creative chain associated with arts and cultural production (creation, production, distribution, and consumption) • Creative artistic activity o The goods and services produced by such activity o The goods and services produced in support of such activity o The construction of buildings in which the activity takes place
Arts and Cultural Production, 2016
            GDP                 Compensation Employment
 Total       18,707.2 billion         9,956.2 billion   148.7 million
                804.2 billion          386.2 billion      5.0 million
 ACPSA
                       4.3%                    3.9%             3.4%
Arts and Cultural Production Value Added:
Percent of State GDPArts and Cultural Production Employment:
Percent Change, 2015-2016Program Initiatives/New Statistics •GDP by County •Outdoor Recreation Satellite Account (ORSA)
GDP by County
• Provide a much richer picture of the geographic
  distribution of the nation’s economic activity

  o   Assist analysts in the assessment of local economic performance

  o   Inform resource allocation decisions

  o   Assist planners and policymakers in the development of strategies
      that promote economic growth and in the assessment of
      strategies over the long run

• Inform and lead to improvements of GDP by metropolitan
  area statistics and GDP by state statistics

                                                                          24

                                                                    6/11/2019
Prototype Release
• Release date: December 12, 2018
• Data series: Annual current- and inflation-adjusted GDP
statistics for all counties (3,113)
• Industry detail:
• All industry total
▪ Private goods-producing industries
▪ Private services-producing industries
▪ Government
• Period: 2012-2015
25
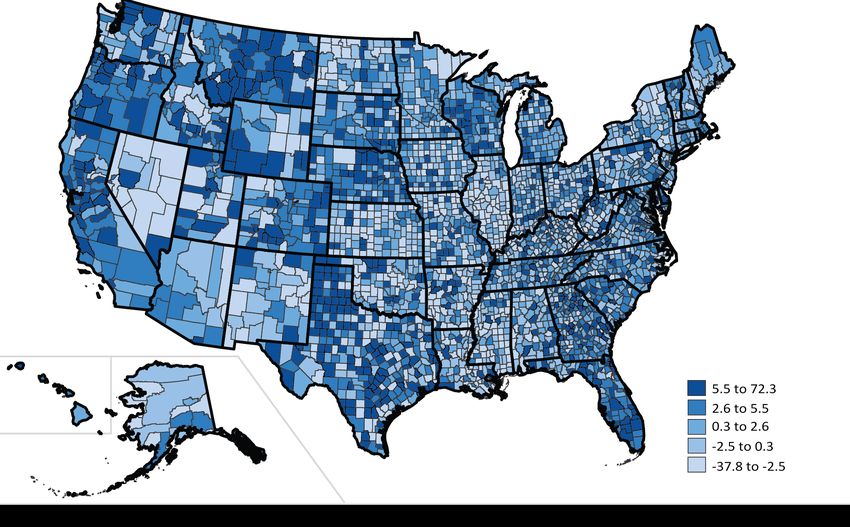
6/11/2019Percent Change in Real GDP by County, 2014-2015
Slope County, ND (-37.8%)
North Dakota (-3.0%)
Churchill County,
NV (7.7%)
Clark County, NV (9.5%)
Nevada (4.3%)
Roberts County, TX (72.3%)
Texas (5.2%)
26
6/11/2019Real GDP by County Growth in Nevada, 2014-2015
27
6/11/2019Next Steps
•Develop further improvements and refinements to
the prototype statistics
•Determine the level of industry detail for official
release
•Continue to solicit and incorporate data user
feedback
•Official release on December 12, 2019
28
6/11/2019Outdoor Recreation (ORSA) • Measures the impact of outdoor recreation activities on the U.S. economy • Mandated by the “Outdoor Recreation Jobs and Economic Impact Act of 2016” • Prototype statistics for the U.S. released in February 2018 • Official statistics for the U.S. released in September 2018 • Regional dimension o The impact of outdoor recreation sector on each state’s economy o Recreation activities that are important to a state’s economy
Defining Outdoor Recreation
Conventional outdoor recreation activities
   •   Outdoor activities that usually occur in nature-based settings and that
       require physical exertion

                                                                                 30

                                                                           6/11/2019
Defining Outdoor Recreation, Cont.
Comprehensive outdoor recreation activities
Percentage of Households Participating
in Activities (2011—All Varieties)
Any non-work time spent doing Activities Percent
outdoor activities Walking for pleasure 82.2%
(Oregon State University) Visiting historic sites 63.5%
Visiting parks (local, state, national) 50.6%
Visiting natural areas/preserves/refuges 50.3%
Swimming, pool 43.1%
Sunbathing/relaxing on a beach 41.3%
Swimming, beach 38.3%
Jogging/running 33.6%
Using a playground 29.9%
Picnicking away from home 28.0%
Visiting gardens/arboretums 25.6%
Hiking/backpacking 24.8%
Source: Virginia Department of
31
Conservation and Recreation
6/11/2019Outdoor Recreation, 2016
GDP Compensation Employment
Total 18,707.2 billion 9,956.2 billion 148.7 million
412.0 billion 213.6 billion 4.5 million
ORSA
2.2% 2.1% 3.0%
Outdoor Recreation Economy U.S. Economy
4.3%
2.7%
2.5%
2.3%
1.7% 1.8%
1.6%
1.4%
Real GDP Real Gross Output Compensation EmploymentNext Steps •Research on methodology and developing data sources for regional accounts is under way •Plan to release prototype state-level statistics for public comment by the end of FY2019 o Annual 2012-2017 o Value added by industry and activity o Compensation and employment by industry
Contact Information

                            Comments or questions? Send it to us at:
                            gdpbycounty@bea.gov
                            OutdoorRecreation@bea.gov
Ledia Guci
Chief of Regional Product   Want more info?
Division                    Check out:
ledia.guci@bea.gov          https://www.bea.gov/news/docs/innovation-
301.278.9788                at-bea

                            https://www.bea.gov/data/gdp/gdp-county

                            www.bea.gov/data/special-topics/outdoor-
                            recreation

                                                                             34

                                                                       6/11/2019
You can also read