REFINING INDUSTRY IN FOCUS - Baker & O'Brien, Inc.
←
→
Page content transcription
If your browser does not render page correctly, please read the page content below
REFINING INDUSTRY IN FOCUS
  Baker & O’ Brien, Inc.               www.bakerobrien.com                              Q2 2021

Q2 2021: U.S. Refining Margins Steadily Improve
Houston, August 16, 2021

Baker & O'Brien, Inc.’s Q2 2021 PRISM™ update showed that the United States (U.S.) refining
margins continued to improve over the quarter towards pre-COVID-19 levels. Average U.S.
refining cash margins for the quarter were $2/Bbl. to $4/Bbl., above breakeven levels for all
of the U.S. PADDs. The Q2 2021 cash margins were
higher by as much as $6/Bbl. (PADD 2) compared to
the same quarter a year ago.

As we discuss further in the special topic below, the
margin recovery is underpinned by improving
demand and refinery utilization. Combined
gasoline, jet fuel, and diesel fuel consumption
increased 9% over the prior quarter, driven largely
by gasoline. Similarly, refinery utilization, as
reported in the Baker & O’Brien/RBN Energy U.S. Refinery Billboard weekly newsletter,
recovered over the quarter to pre-COVID-19 levels. Utilization reached 92% in June 2021,
compared to a dismal 79% average for 2020.

One headwind for U.S. refiners in Q2 2021 was the cost of Renewable Identification Numbers
(RINs) required by the Renewable Fuel Standard (RFS). The increase in these costs during
2021 to record highs is the main subject of this issue’s special topic.

Most of the Key Refining Margin Metrics
showed noticeable improvement from
the prior quarter. Crack spreads
improved substantially despite the
continued rise in crude oil prices. An
increase in the LLS–Maya light-heavy
spread from the prior quarter helped
those refineries operating coking units
and processing a heavy sour crude oil
slate.

Page 2 Refining Industry In Focus
Special Topic: U.S. refining rates have recovered, but are renewable fuels
obligations suppressing the recovery of the refinery bottom line?
The impact of the COVID-19 pandemic on U.S. refined product demand appears to be fading.
The EIA reports that in the first week of July 2021, the volume of gasoline supplied in the U.S.
reached an all-time high, surpassing 10 million barrels per day for the first time ever (as
shown by the black circle in Figure 1). The
supply of all refined products exceeded the Figure 1: U.S. Weekly Supplied Product
same week in 2019. Only jet fuel demand
12.0
remains depressed, but even it increased by
Million Barrels per Day
10.0
15% from Q1 2021 to Q2 2021.
8.0
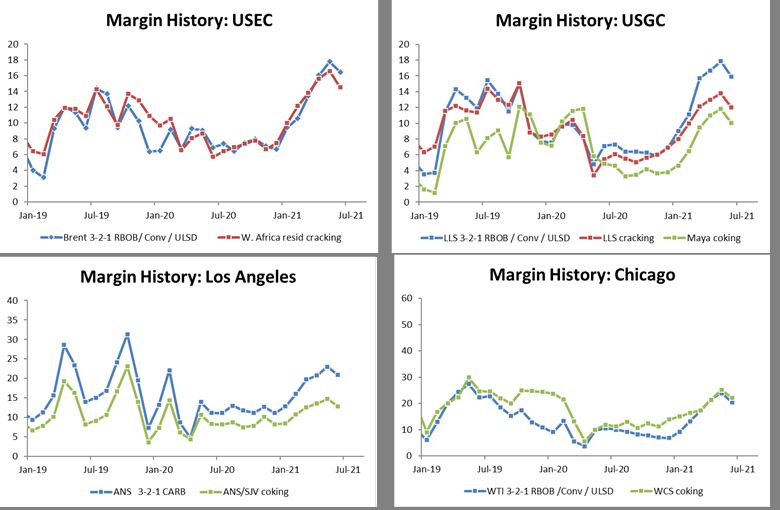
In the July 2021 edition of the U.S. Refinery Gasoline
6.0
Billboard newsletter, we reported that the
4.0 Distillate
strong demand rebound was a driving force
behind: a) higher refinery utilization; b) 2.0 Kerosene
above-average refining margins in all major 0.0 / Jet Fuel
U.S. regions (Figure 2); and c) the recovery of
gross refining margins for most oil refineries
to pre-pandemic levels. Source: EIA, U.S. Weekly Product Supplied data.
Figure 2: U.S. Refinery Billboard-Regional Refinery Margins ($/Bbl.)
Page 3                                                                      Refining Industry In Focus

The average year-to-date margin improvement for the 3-
                                                                   Figure 3: RIN Costs per Barrel of
2-1 product cracks in the charts above is ~$8.5/Bbl.
                                                                   U.S. Gasoline and Diesel Supplied
While this looks encouraging for refiners, it does not
                                                                      10
reflect RFS obligations. As shown in Figure 3, the RIN                 8
costs per barrel of gasoline and diesel associated with

                                                              $ per barrel
                                                                       6
these obligations began to climb at the start of 2020 and              4
spiked sharply in 2021, offsetting some of the margin                  2
improvement. From January 2021 to June 2021, RIN                       0
costs have surged by $3.7 per product barrel supplied.
As a result, the ~$8.5/Bbl. gain in margin so far this year
is cut to ~$4.7 when RINs costs are factored in.               Source: EIA, OPIS, Platts.

This is reflected in our reported increase in cash margins of $0.4/Bbl. from net Q1 2021 to
the Q2 2021 increase in cash margins. The PRISM analysis shows the cost of RFS-related
obligations for U.S refineries on a per barrel of feed basis rose by $1.7/Bbl. from Q1 2021
($4.1/Bbl.) to Q2 2021 ($5.8/Bbl.). Therefore, the modest $0.4/Bbl. cash margin increase
indicates that the improving macro trends ( ~+$2.1/Bbl.) only marginally outpaced RINs costs
(~-$1.7/Bbl.).
One underlying cause for the surge in RINs is that the agricultural feedstocks used to produce
renewable fuels are currently in high demand globally as livestock feed. For example, the two
main feedstocks for U.S. biofuels production are corn for bioethanol and soybean oil for
biodiesel and renewable diesel. The EIA reports that “since December 31, 2020, U.S. corn
prices have increased by 42% while U.S. soybean oil prices have increased by 55%. Both prices
have reached their highest levels in more than eight years, driven in large part by increased
[livestock feed] demand from China and concerns around future domestic supply.”
While the recent recovery in road transportation fuel demand is welcome news to refiners, the
rising RIN costs associated with RFS compliance will be of concern. The pass-through of RIN
costs from refiners to consumers remains an interesting point of debate. From our analysis,
it is not possible to discern the extent to which RIN costs are behind the recovery in product
cracks, or alternatively, potentially cutting into gains from the improving macro environment.
However, our analysis does show that any pass-through of RIN costs to consumers is taking
place at a relatively weak cash margin basis for U.S. refiners. Furthermore, given the
continued roll out of programs to encourage the replacement of “fossil” transportation fuels
with renewable carbon sources, higher RINs-related prices could be a new normal for U.S.
refiners and consumers alike to navigate for the foreseeable future.

Contact:
Dan Finelt
(832) 358-1453
dan.finelt@bakerobrien.com
Page 4                                                              Refining Industry In Focus

About Baker & O’Brien
Baker & O'Brien is an independent professional consulting firm specializing in technology,
economics, and management practice for the international oil, gas, chemical, and related
industries. With offices in Dallas, Houston, and London, the firm assists clients with strategic
studies, mergers and acquisitions, and technology evaluations. The firm also provides expert
services to support insurance claims, investigate operating incidents, and support a wide
range of commercial and construction disputes in the energy industry.

About PRISM
Baker & O’Brien’s PRISM software is used to perform detailed analysis of individual refineries
and the refining value chain from crude oil load port to products truck rack. The system
combines a large historical database with a robust refinery simulator to provide analytical
support to competitive assessments, strategic planning, crude oil valuation, and delivered
cost of supply. The PRISM database currently includes operational and economic
performance details for all refineries in the U.S. and Canada, most refineries in Europe, and
over 50 refineries in the Asia Pacific region. The PRISM system is available for license and is
used in consulting assignments for Baker & O’Brien clients.

About U.S. Refinery Billboard
The U.S. Refinery Billboard, jointly published with RBN Energy, provides a one-of-a kind
weekly update on the U.S. refining industry, including key market insights on refinery
activity, individual refinery performance, product markets, and economics. The
comprehensive report includes regional crude and refined product price spreads, crude oil
netbacks, refinery-specific indicative margins leveraging Baker & O’Brien’s PRISM refinery
modeling system, and highlights of weekly news of importance to the sector.

PRISM is a trademark of Baker & O’Brien, Inc. All rights reserved.

                                     Baker & O’Brien, Inc.

           Dallas                            Houston                             London
                                       www.bakerobrien.com
You can also read