Tackling roadside nitrogen dioxide concentrations in Wales - O2
←
→
Page content transcription
If your browser does not render page correctly, please read the page content below
Tackling roadside nitrogen
dioxide concentrations in Wales
Welsh Government supplemental plan to the
UK plan for tackling roadside nitrogen dioxide
concentrations 2017 – Interim Data on NO2
Concentrations for the Motorway and Trunk Road

September 2019

                                                 O2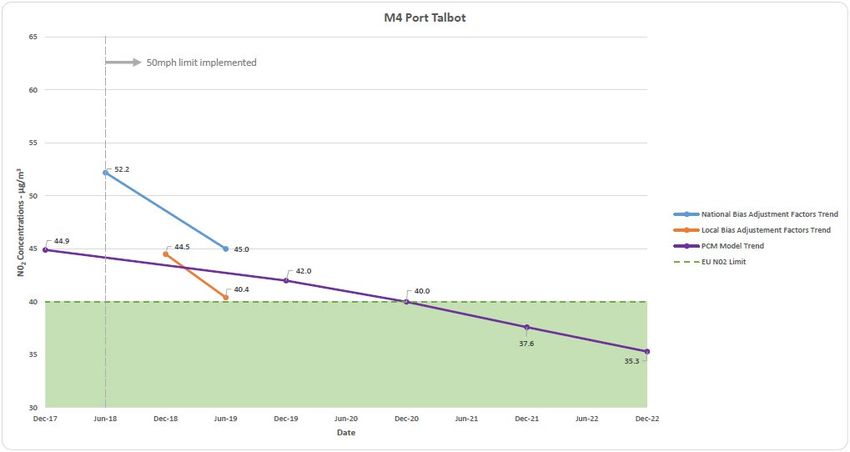
Mae’r ddogfen yma hefyd ar gael yn Gymraeg.
This document is also available in Welsh.
       © Crown copyright 2019   WG39109   Digital ISBN 978 1 83933 281 4
Foreword
The Welsh Government is committed to building healthier communities and better
environments. Tackling poor air quality is a priority that is reflected in our national
strategy – ‘Prosperity for All’. In November 2018 we published our Welsh Government
supplemental plan to the UK plan for tackling roadside nitrogen dioxide (NO2)
concentrations 2017 setting out how we will reduce concentrations of NO2 around
roads where levels are above legal limits.

The plan built on Section 7.6 (Additional Actions in Wales) of the 2017 UK plan for
tackling roadside nitrogen dioxide concentrations, setting out how we will comply
within the shortest possible time with the limit values for NO2. These values are set by
the Ambient Air Quality Directive (2008/50/EC) and the Air Quality Standards (Wales)
Regulations 2010.
This report is to confirm the current levels of NO2 concentrations on the Welsh
Government Motorway and Trunk Road network at the five sites identified in the plan.
It provides the data from December 2017 to July 2019 and a narrative with the ongoing
issues facing the Welsh Government and Ministers in relation to the five sites identified
on the Motorway and Trunk Road network along with ways forward to help lower the
NO2 levels further.
This report should be read in conjunction with the following:-
Welsh Government supplemental plan to the UK plan for tackling roadside nitrogen
dioxide (NO2) concentrations 2017, published in November 2018:-
https://gov.wales/air-quality-plan
Welsh Government Transport Appraisal Guidance Reports Stages 1, 2 and 3 for
Tackling Roadside Nitrogen Dioxide Concentrations on the Motorway and Trunk road
Network sites in Wales:-
https://gov.wales/tackling-roadside-nitrogen-dioxide-concentrations-wales
https://gov.wales/tackling-roadside-nitrogen-dioxide-concentrations-wales-
weltag-stage-3
Contents
Foreword
1.0   Summary of Interim Data on NO2 Concentrations for the Motorway and Trunk
      Road
Appendices

Appendix A - DEFRA Pollution Climate Mapping Data

Appendix B – Interim Diffusion Tube Monitoring Data
Appendix C – Interim Speed Data
Appendix D – Graphs
1.0 Summary of Interim Data on NO2 Concentrations for the Motorway and
Trunk Road
This report provides a summary of the NO2 concentrations at the five sites on the
motorway and trunk road network and has been provided following the commitment to
present results as set out in the Welsh Government supplemental plan to the UK plan
for tackling roadside nitrogen dioxide concentrations 2017, published November 2018.
As detailed in the supplemental plan, the five sites where NO2 concentrations are
above the limit level – 40 μg/m3 set out in the EU Ambient Air Quality Directive
(2008/50/EC) and the Air Quality Standards (Wales) Regulations 2010 are:-
1. A494 at Deeside (North Wales Zone);
2. A483 near Wrexham (North Wales Zone);
3. M4 between Junctions 41 and 42 at Port Talbot (Swansea and South Wales
Zone);
4. M4 between Junctions 25 and 26 at Newport (South Wales Zone); and
5. A470 between Upper Boat and Pontypridd (South Wales Zone).
In June 2018, 50mph speed limits were introduced at the five sites as these were
considered to bring compliance with EU Directive NO2 concentrations in the shortest
possible time. Precautionary Retained Measures (PRM) were included in the plan
albeit these measures would have taken a longer period of time to implement. The
PRMs have been developed since November 2018, however the timetable to
implement the PRMs remains as set out in the plan.
The following data is reported in the appendices to this report:-
• DEFRA Pollution Climate Mapping Data (PCM) (Modelled information)
• Interim Diffusion Tube Monitoring Data (Roadside information)
• Interim Speed Data
The appropriate graphical representation of the data has been shown in Appendix D.The following points can be drawn from the interim data:
• Baseline PCM data for 2017/2018 continues to show NO2 concentrations lower
than those at the roadside, this was no surprise as it was highlighted in the
WelTAG Stage 3 reporting;
• Whilst the roadside data is different to the PCM, the initial indications are
positive that the NO2 concentrations have reduced at the five sites from
December 2017 to July 2019;
• Speed profiles demonstrate that mean speeds are above 50mph for all five
sites, however, it is expected that with the Average Speed Cameras now in
place at four of the sites, compliance will be improved with the 50mph speed
limits. The M4 Newport has spot speed cameras in place as part of the variable
speed limit;
• Based on the data available and to allow the Welsh Government to report
against EU Directive NO2 limits and comment further on the effectiveness of
the 50mph speed limit, additional NO2 data adjusted against national bias
factors needs to be collected for the calendar year 2019. This will allow for ‘like
for like’ data to be compared with 2018 calendar year;
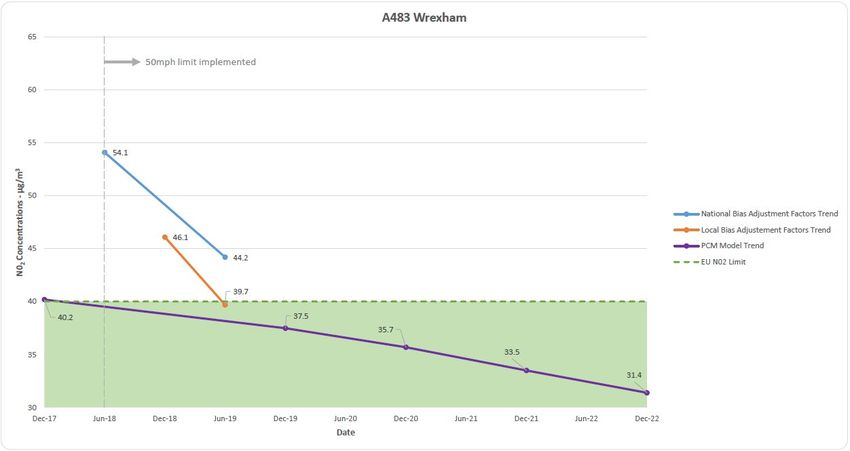
• From the graphs, all sites have a positive trend that the NO2 concentrations are
reducing on all data sets;
• The situation remains complicated as air quality is sensitive to a number of
issues including the weather/seasonal effects, traffic flows including volume,
speeds and fleet mix;
• Until additional information is obtained and the trends remain positive, it is too
early to make firm conclusions or any other recommendations to remove the
measures that have been either implemented or proposed at the five sites;
• Whilst the indicated reduction in NO2 concentrations is positive news for the
five sites, in particular the A483 Wrexham, A494 Deeside and M4 Port Talbot,
as highlighted in the supplemental plan, the Welsh Government will continue
with the goal of achieving compliance in the shortest time possible. This
includes the continued development and the stakeholder engagement on the
PRMs; and
• The Welsh Government remains committed to achieve compliance in the
shortest possible time and therefore all measures introduced at the five sites
will be kept in place until further data is available for review.
A further report will be published in March 2020 on the next set of data for NO2
concentrations for calendar year 2019 adjusted to national bias factors. Within this
report a more comprehensive update on the progress made with the PRMs will be
made.Appendices
Appendix A
DEFRA Pollution Climate Mapping Data

Data obtained from the DEFRA Pollution Climate Mapping (PCM) model was used
during the Welsh Government WelTAG Transport Planning Appraisal process and
helped identify the measures to be implemented at the five sites. The table below
details the predicted NO2 concentrations that were used to inform the WelTAG
Appraisals.

Baseline PCM predicted NO2 concentrations at the five sites taken from the plan
(2017 model data information):

 Stretch of    Site          NO2 Predicted Baseline Concentrations (μg/m3) 2017
 Road          Location      2017      2018       2019      2020       2021       2022
 A483          Wrexham       41.2      39.3       37.6      35.7       33.5       -
 Wrexham
 A494          Aston Hill    50.3      47.9      45.7       43.2      40.4        37.8
 Deeside
               Jnc A550 –    48.4      46.1      44.1       41.7      39.1        36.7
               Jnc A548
               Jnc A458      41.9      39.8      37.9       35.9      33.7        31.6
               Shotwick
               Rd
 A470          Pontypridd    47.6      45.7      43.9       41.7      39.1        -
 Pontypridd
               Upper         41.8      40.1      38.5       36.6      34.3        -
               Boat
 M4            West     of   48.5      46.1      44.0       41.7      39.0        -
 Newport       River Usk
 Junction
 25-26
               East    of    40.8      38.9      37.2       35.3      33.1        -
               River Usk
 M4     Port   Jnc 41-42     45.2      43.2      41.4       39.4      36.9        -
 Talbot
 Junction
 41-42

Since publication of the supplemental plan, DEFRA has published updated PCM NO2
baseline concentrations for 2018 and these are detailed in the table overleaf.
Baseline PCM predicted NO2 concentrations at the five sites updated with 2018
model information:
Stretch of Site NO2 Predicted Baseline Concentrations (μg/m3) 2018
Road Location 2017 2018 2019 2020 2021 2022
A483 Wrexham 40.2 - 37.5 35.7 33.5 31.4
Wrexham
A494 Aston Hill 49.4 - 45.8 43.3 40.6 38.0
Deeside
Jnc A550 – 47.3 - 43.8 41.5 39.0 36.6
Jnc A548
Jnc A458 40.5 - 37.3 35.4 33.3 31.2
Shotwick
Rd
A470 Pontypridd 46.6 - 43.9 41.7 39.3 36.9
Pontypridd
Upper 41.1 - 38.7 36.8 34.6 32.5
Boat
M4 West of 50.4 - 46.7 44.2 41.4 38.8
Newport River Usk
Junction
25-26
East of 41.4 - 38.3 36.4 34.3 32.2
River Usk
M4 Port Jnc 41-42 44.9 - 42.0 40.0 37.6 35.3
Talbot
Junction
41-42
The concentrations have varied slightly and the compliance date has increased within
PCM data model (2018) information at two of the sites. Baseline compliance at both
M4 sites has increased above 40μg/m3 in 2021 for Newport and 2020 for Port Talbot.
Therefore the new model information shows that without implementation of any
measures, full compliance at the site is predicted as follows:
• A483 Wrexham – by the end of 2018 (no change)
• A494 Deeside – by the end of 2022 (no change)
• A470 Pontypridd – by the end of 2021 (no change)
• M4 Newport – by the end of 2022 (extended by one year)
• M4 Port Talbot – by the end of 2021 (extended by one year)
The reason for the above changes are principally as a result of updates to the traffic
count data used in the model that is produced by the Department for Environment,
Food and Rural Affairs and the Department for Transport.
Whilst this data was key to the development of the measures for the plan and used in
the WelTAG process, it is considered that the roadside data is more representative for
decisions to be made moving forward.Appendix B
Interim Diffusion Tube Monitoring Data
Concentrations of NO2 at the roadside at each of the five sites have been recorded via
a series of triplicate diffusion tube since mid-December 2017 and the data has been
used to help establish the effect that the measures have had on NO2 concentrations.
To help obtain a more accurate picture on concentrations, these tubes were
supplemented with continuous reference method analysers in August 2019. Data from
these analysers has not been included in this report but will included within subsequent
reports.
The table below details the NO2 concentrations recorded via the diffusion tubes during
the 6-month period prior to the introduction of the 50mph speed limits in June 2018.
The data has been averaged for the year and corrected for seasonal variations using
national bias adjustment factors. Only the national factors were applied to the 6-month
data, due to the South Wales continuous monitor not being calibrated.
Bias adjustment factors are used in adjusting the results that are obtained via diffusion
tube methods. Further information on the need for adjustment is available at:
https://laqm.defra.gov.uk/bias-adjustment-factors/bias-adjustment.html
NO2 concentrations prior to the 50mph speed limits (6 months – 18th December
2017 to the 4th June 2018):
6-month average NO2 concentration
Site Type (µg/m3) using national bias
adjustment factor
A483 Wrexham – North Wales
Roadside 54.1
Urban Background 17.1
A494 Deeside – North Wales
Roadside 43.6
Urban Background 19.7
A470 Pontypridd – South Wales
Roadside 60.4
Urban Background 18.7
M4 Newport – South Wales
Roadside 64.0
Urban Background 24.7
M4 Port Talbot - South Wales
Roadside 52.2
Urban Background 14.1The table below details the NO2 concentrations recorded in the 12-month period
following implementation of the 50mph speed limits in mid-June 2018. This data has
been corrected using local bias adjustment as the data does not cover a calendar year.
In addition, whilst the national database includes some data obtained from monthly
exposures, the local monitoring has been undertaken solely via conducting fortnightly
changeovers of the diffusion tubes (in italics the national bias adjustment figures have
been included for comparison purposes).
The table also details the NO2 concentrations for the 2018 calendar year that have
been corrected using local bias adjustment. The data has been provided for
comparison and demonstrates that the adjustment factor when applied to the Urban
Background sites (that are less susceptible to changes in NO2) are yielding similar or
identical concentrations.
Table showing the NO2 concentrations with 50mph speed limits in place (12
months – July 2018 to July 2019).
January – December July 2018 -July 2019
July 2018 -July 2019 1
2018 annual mean NO2 12-month average NO2
mean NO2 concentration
Site Type (µg/m3) using local bias
concentration (µg/m3) concentration (µg/m3)
using local bias using national bias
adjustment factor (0.80) 2
adjustment factor (0.81) 3 adjustment factor (0.89) 4
A483 Wrexham – North Wales
Roadside 39.7 46.1 44.2
Urban Background 13.8 15.2 15.4
A494 Deeside – North Wales
Roadside 35.0 38.6 39.0
Urban Background 16.1 17.5 17.9
A470 Pontypridd – South Wales
Roadside 47.9 52.2 53.3
Urban Background 16.5 16.8 18.4
M4 Newport – South Wales
Roadside 55.3 58.2 61.5
Urban Background 20.9 21.5 23.2
M4 Port Talbot - South Wales
Roadside 40.4 44.5 45.0
Urban Background 11.5 12.2 12.8
1
Diffusion tube monitoring periods 8-20, tubes exposed from 2nd July 2018 – 1st July 2019
2
Local bias factor from co-located tubes at Wrexham continuous monitoring site for this period
3
Local bias factor from co-located tubes at Wrexham continuous monitoring site for the calendar year
4
From Spreadsheet v06/19 in Figure 1Appendix C
Interim Speed Data
The 50mph speed limits were initially implemented at four of the five sites in mid-June
2018. The one exception is the M4 at Newport where a 50mph speed limit was set to
operate overnight (21:00 to 06:00) via the variable speed limit (VSL) in May 2018.
Following publication of the supplemental plan, these 50mph speed limits have
remained in force. Again, the one exception is the M4 at Newport where a maximum
50mph speed limit was set to operate at all times via the VSL in February 2019 and is
subject to speed monitoring via spot speed cameras.
Table showing a summary of mean traffic speeds at each location following their
initial implementation in June 2018 to August 2019:
Location Time period Mean Speed
A483 Wrexham 24 hours 57mph
A494 Deeside 24 hours 58mph
A470 Pontypridd 24 hours 58mph
M4 Junction 41 to 42, Port Talbot 24 hours 55mph
24 hours 52mph*
M4 Junction 25a to 26, Newport
21:00 to 53mph*
Maximum 50mph speed limit set overnight 00:00
May 2018 to March 2019 00:00 to 53mph*
06:00
M4 Junction 25a to 26, Newport 24 hours 51mph*
Maximum 50mph speed limit set to operate
at all times
February 2019 onwards
*NOTE – Mean speeds take into account occasions when the variable speed limit may
also have been automatically set below 50mph. It is not possible to provide data for
those occasions when only a 50mph speed limit was displayed.Appendix D Graphs The following graphs are showing the various data sets at the five sites:
You can also read