How eHarmony Turns Big Data into True Love - Sridhar Chiguluri, Lead ETL Developer eHarmony Grant Parsamyan, Director of BI & Data Warehousing ...
←
→
Page content transcription
If your browser does not render page correctly, please read the page content below

How eHarmony Turns Big Data into True Love

                    Sridhar Chiguluri, Lead ETL
                          Developer eHarmony
               Grant Parsamyan, Director of BI &
                   Data Warehousing eHarmony

                                                   1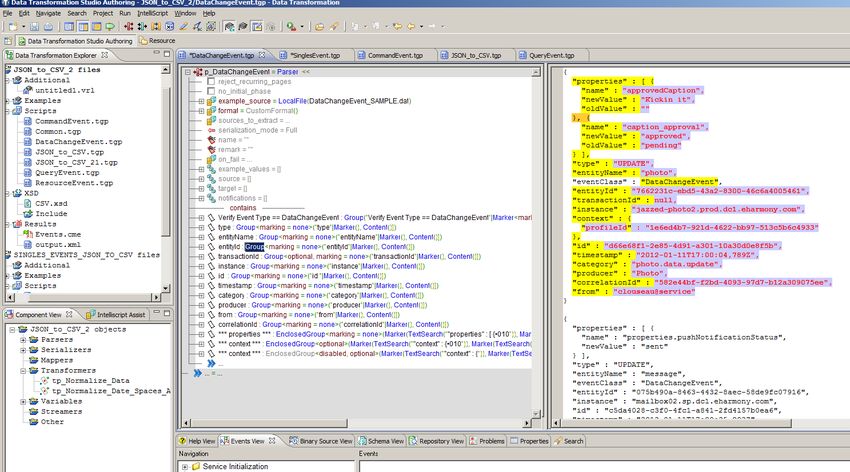
Agenda

• Company Overview
• What is Big Data?
• Challenges
• Implementation Phase 1
• Architecture

                           2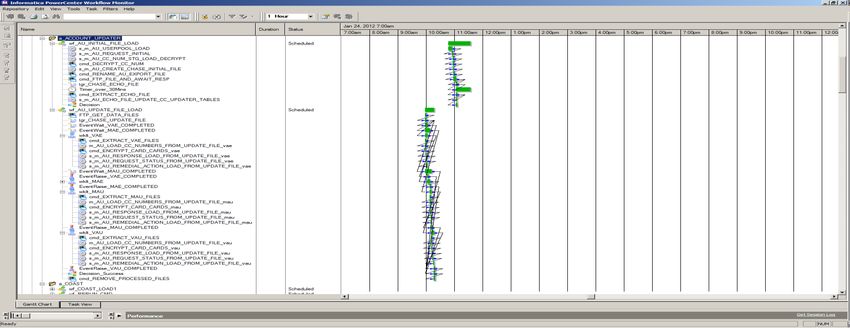
Company Overview
•   eHarmony was founded in 2000 and pioneered the use of relationship
    science to match singles seeking long-term relationships. Today the
    company offers a variety of relationship services in the United States,
    Canada, Australia, the United Kingdom and Brazil—with members in
    more than 150 countries around the world.
•   With more than 40 million registered users, eHarmony’s highly
    regarded singles matching service is a market leader in online
    relationships.

•   On average, 542 eHarmony members marry every day in the United
    States as a result of being matched in the site.*
•   eHarmony also operates Jazzed.com, casual and fun dating site where
    users can browse their matches directly.

                                                                              3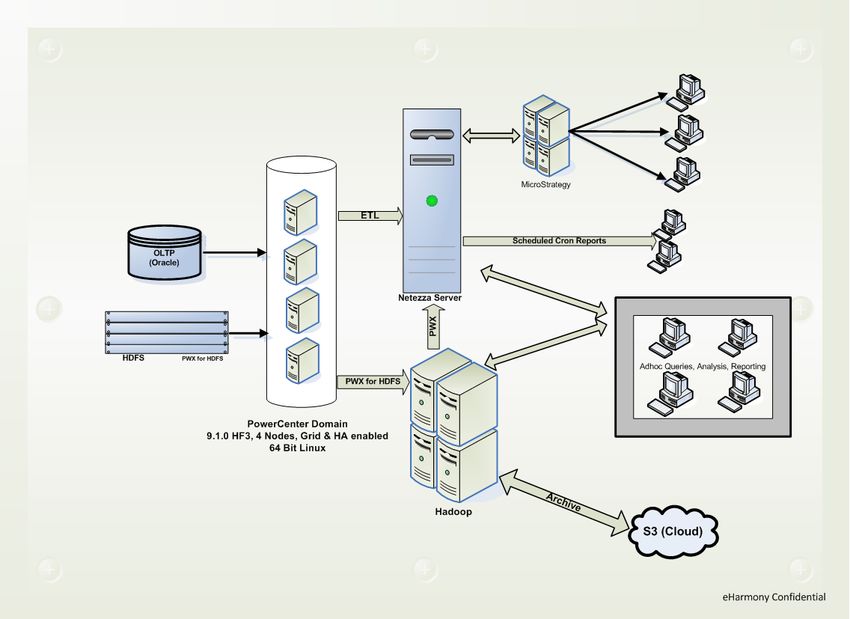
Data Analytics Group

• Our team (DAG) is responsible for providing
  Business Analytics and reporting solutions to
  internal Business Users across all departments.
• Each person in the team is responsible for a
  specific business unit: Accounting, Finance,
  Marketing, Customer Care, Life Cycle Marketing
  and International.
• Very limited direct data access to business
  users. All the data is provided through Adhoc
  SQL and MicroStrategy reports.

                                                    4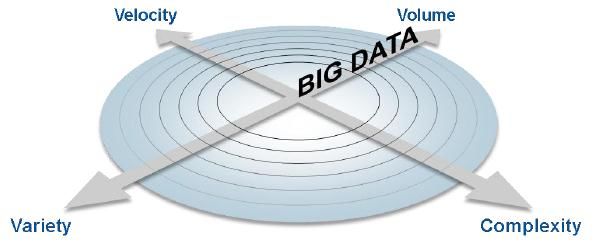
Big Data
Gartner
'Big Data' Is Only the Beginning of Extreme Information
Management

McKinsey & Company
“Big data” refers to datasets whose size is beyond the ability
of typical database software tools to capture, store, manage,
and analyze.
                                                                 5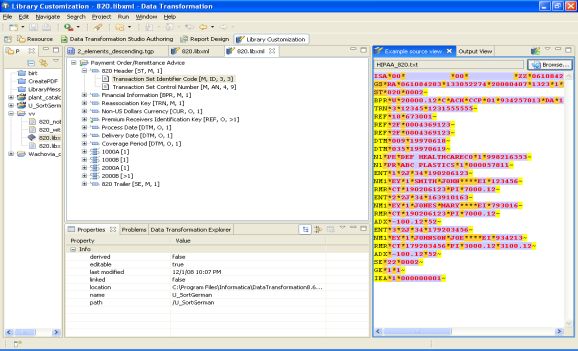
Big Data Event: JSON

JavaScript Object Notation
 Widely hailed as the successor to XML in the browser,
 JSON aspires to be nothing more than a simple, and
 elegant data format for the exchange of information
 between the browser and server; and in doing this simple
 task it will usher in the next version of the World Wide
 Web itself.

  o JSON can be represented in two structures
     • Object - Unordered set of name/value pairs
     • Array - Ordered collection of values

                                                            6
Sample JSON event

                    Context

                    Changes

                    Header

                              7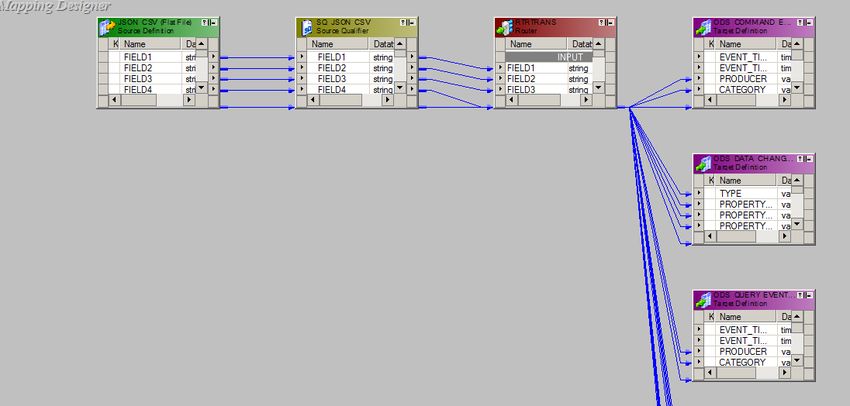
JSON rows as they appear in the database after being flattened out by Hparser

                                                                                                                            PROPERTY
CATEGORY            ENTITY_ID    ID               PRODUCER EVENT_TIMESTAMP PROPERTY_NAME PROPERTY_NEW_VALUE
                                                                                                                            _SOURCE
                                 a2547c49-6a75-
qaasAnswers.data.up singles-7-   4c50-9ad4-
date                41440669     8c7bc023447f     QAAS    2/16/2012 22:31   locale                 en_US                    CONTEXT
                                 a2547c49-6a75-
qaasAnswers.data.up singles-7-   4c50-9ad4-                                 userAnswers[singles-
date                41440669     8c7bc023447f     QAAS    2/16/2012 22:31   7-1-6-63].desc                                  CHANGE
                                 a2547c49-6a75-
qaasAnswers.data.up singles-7-   4c50-9ad4-
date                41440669     8c7bc023447f     QAAS    2/16/2012 22:31   site                   singles                  CONTEXT
                                 a2547c49-6a75-
qaasAnswers.data.up singles-7-   4c50-9ad4-                                 userAnswers[singles-
date                41440669     8c7bc023447f     QAAS    2/16/2012 22:31   7-1-6-63].ignored    TRUE                       CHANGE
                                 a2547c49-6a75-
qaasAnswers.data.up singles-7-   4c50-9ad4-
date                41440669     8c7bc023447f     QAAS    2/16/2012 22:31   type                   7                        CONTEXT
                                 a2547c49-6a75-
qaasAnswers.data.up singles-7-   4c50-9ad4-                                 userAnswers[singles-
date                41440669     8c7bc023447f     QAAS    2/16/2012 22:31   7-1-6-63].type       MULTISELECT                CHANGE
                                 a2547c49-6a75-
qaasAnswers.data.up singles-7-   4c50-9ad4-
date                41440669     8c7bc023447f     QAAS    2/16/2012 22:31   userAnswers            {"type":7,"version":1}   CONTEXT
                                 a2547c49-6a75-
qaasAnswers.data.up singles-7-   4c50-9ad4-                                 userAnswers[singles-
date                41440669     8c7bc023447f     QAAS    2/16/2012 22:31   7-1-6-63].answer     []                         CHANGE
                                 a2547c49-6a75-
qaasAnswers.data.up singles-7-   4c50-9ad4-                                 userAnswers[singles-
date                41440669     8c7bc023447f     QAAS    2/16/2012 22:31   7-1-6-63].date       1329460263580              CHANGE
                                 a2547c49-6a75-
qaasAnswers.data.up singles-7-   4c50-9ad4-
date                41440669     8c7bc023447f     QAAS    2/16/2012 22:31   userId                 41440669                 CONTEXT
                                 a2547c49-6a75-
qaasAnswers.data.up singles-7-   4c50-9ad4-
date                41440669     8c7bc023447f     QAAS    2/16/2012 22:31   version                1                        CONTEXT

                                                                                                                                     8
Sections in a JSON
• Changes – contains list of variables that have changed
which resulted in this event’s generation
• Sample row where a User chose their desired age range for their match
"changes":[{"name":"ageRangeMin","newValue":18,"oldValue":0},{"name":"ageRangeMax","newValue":24,"oldValue":0}]
• Context – Provides contextual information to the
changes such as User Id, User Name, etc.
• Sample row showing User’s Name and Match details
"context":{"userFirstName":―John","userLocation":―Santa Monica, CA","matchId":"353861","matchUserId":"2936522"}
• Header – Provides Header level information
• Sample header row
"headers": {"id":"03c57fe3-21bd-4bde-8c5a-679b5fb3c38a","X-category":"mds_savematch.resource.post","X-
instance":"matchdata01-i8","X-timestamp":"2012-01-18T00:46:35.648+0000" }
9Challenges
• Millions of Events generated every hour as JSON files
• How to handle the large volume?
• No relational source database, how to process JSON?
• How do you create reporting that finds trends in that
large amount of data?
• Quick turnaround time for prototypes
• Create a analytics stack that could process large
amounts of data and have real time reporting.
• Achieve a 3 Weeks release cycle to provide reporting
solutions on new event structure
10Phase 1
- Duration : 3 Months
Step 1: Processing the JSON event files each hour
Step 2: Flattening the JSON events (most tricky)
Step 4: Finding the relationships
Step 5: Defining the Data Model
Step 6 : ETL (Extract, Transform and Load)
Step 7: Building MicroStrategy Reports and Dashboards
Step 8 : Storing Historical Data/ Events
11Step 1, 2 & 3: Reading, Flattening and Loading
Events
• Events are stored in text file.
• Hparser & scripts process the files every
hour, flattens each event into CSV files (also
a Hive table)
• PWX HDFS plug-in is used to load the CSV
rows into Netezza staging tables
• Using PowerCenter mapping properties are
then changed become rows and Contextual
Information in the event becomes columns
12The Big Staging Table
• Contains all events
• Grows exponentially
• 200 million new rows per day : 30 Billion so far
• Current Size: 1.2 TB with 4x Compression
• Basis for the whole Data Model
• Needs to be archived
13Finding Relationships
• Top Down Approach
• Get the Business Reporting Requirements
• Analyze the Flattened events in Hadoop
• Write Adhoc Hive queries directly on HDFS or
Netezza staging tables
• Outline the findings and define the
relationships
• Define the Data Model
14Data Model
• Define Logical Data Model based on:
• Business and Analytics Requirements
• Relationships and Findings from the last step
Tips and Tricks
o Only Define/Build what is needed for Reporting and
Analytics, don’t model anything you don’t need right away
o Easy to get lost in the amount of information
o Keep it simple
15ETL
• Pass Logical Data Model and Relationships on
to ETL team
• PowerCenter reads the files in HDFS and loads
into the individual tables using PWX HDFS
plug-in
• Data is loaded hourly and nightly
• Goal: To process with in 2 hours, from the time
event is fired to the data in tables.
16Reporting
• Keep the Reporting Requirements in mind
• Define MicroStrategy Architecture : Attributes/
Facts and Hierarchies
• Pass it on to team of BI Developers
• Build MicroStrategy Intelligent Cubes and
Dashboards based on these cubes
• Triggers in place to run the Cubes hourly as
soon as the data is updated in the tables
17Storing Historical Data
• Processed event logs are stored in local HDFS
(< 1 year) and ins S3 for long term storage
• Data can be reprocessed from the JSON event
files in case an unused event has to be analyzed
18Flow of Events : NFS HDFS Netezza
Amazon
S3
Oracle
Parse Informatica
Event Network JSON’s in Hive PowerCenter Grid
Server Drive Hadoop Copy Informatica Staging with PWX for
HParser Table HDFS
In-house Hadoop Cluster
MicroStrategy Reports Netezza
19High Level Systems Overview & Data Flow
20HParser – How Does It Work?
hadoop … dt-hadoop.jar
… My_Parser /input/*/input*.txt
1. Define JSON parser in HParser
visual studio
2. Deploy the parser on Hadoop
Distributed File System (HDFS)
3. Run HParser to extract data
from JSON, flatten, and stage in
Hadoop
21Sample JSON to CSV Transformation in DT
22Sample mapping that reads Hparser output to Netezza
HDFS Application Connection
Sample workflow that calls a Hparser script and
parses the output data into Netezza
23Workflow Controlled by Informatica
Informatica Staging Informatica
HParser PowerCenter Netezza
Table
24Next Steps
• Phase 1 was about capturing huge volumes of
data and creating MSTR architecture,
Operational reports and dashboards.
• Phase 2: Provide concise analytics anywhere
and anytime
25Business Benefit
• Have a scalable infrastructure
• Adding additional ETL and analytical capabilities
without increasing overhead
• Creating an agile environment to keep up with
business expectations (2 to 3 day turnaround for
new data)
26Thank You
27You can also read