SPORT ANALYTICS DR. JIRKA POROPUDAS, DIRECTOR OF ANALYTICS, SPORTIQ - MYCOURSES
←
→
Page content transcription
If your browser does not render page correctly, please read the page content below

SPORT ANALYTICS
Dr. Jirka Poropudas, Director of Analytics, SportIQ
jirka.poropudas@sportiq.xyz
Outline

1. Overview of sport analytics
  • Brief introduction through examples
2. Team performance evaluation
  • Ranking and rating teams
  • Estimation of winning probabilities
3. Assignment: ”Optimal betting portfolio for Liiga playoffs”
  • Poisson regression for team ratings
  • Estimation of winning probabilities
  • Simulation of the playoff bracket
  • Optimal betting portfolio

                                                           11.3.2019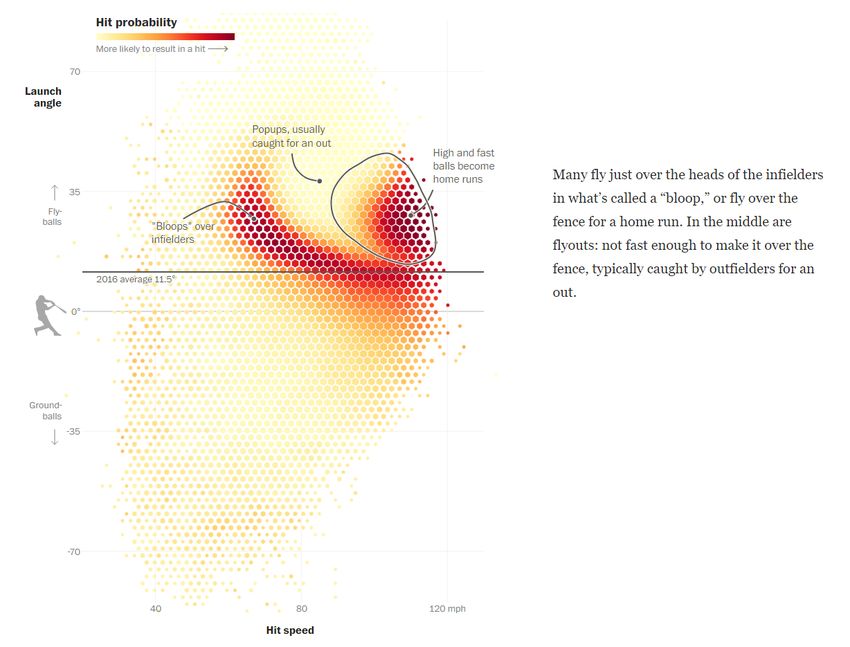
1. Overview of sport analytics

                                 11.3.2019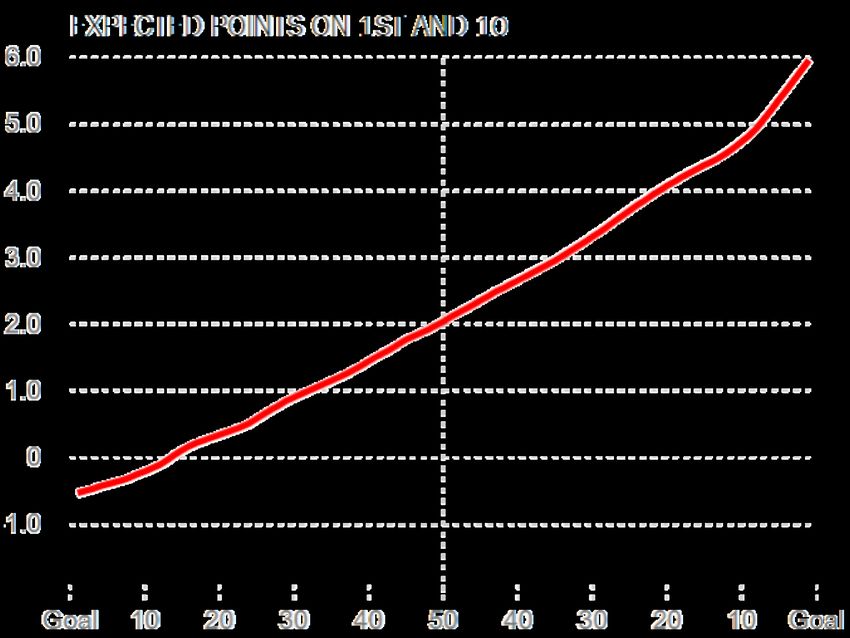
What is sport analytics?

B. Alamar and V. Mehrotra (Analytics Magazine, Sep./Oct. 2011):

“The management of structured historical data,
the application of predictive analytic models that
utilize that data, and the use of information
systems to inform decision makers and enable
them to help their organizations in gaining a
competitive advantage on the field of play.”

                                                                  11.3.2019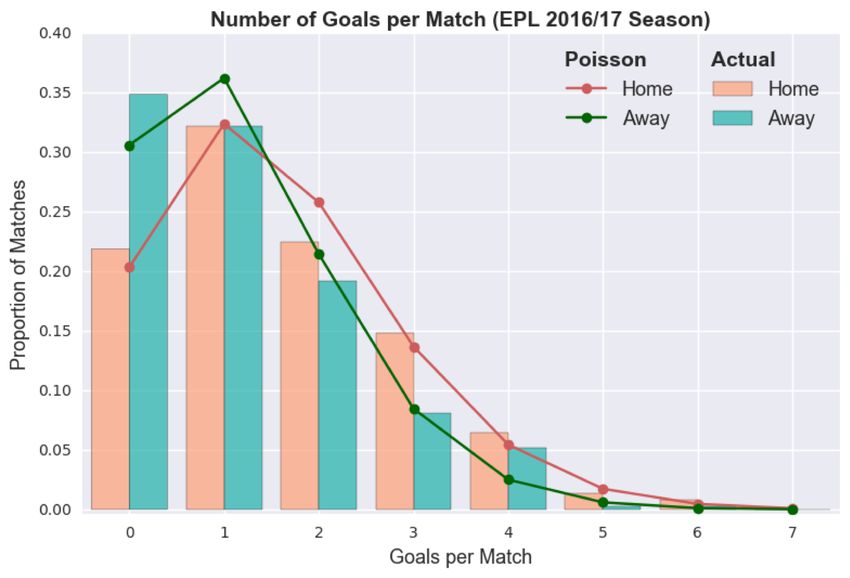
Applications of sport analytics

•       Coaches
    •     Tactics, training, scouting, and planning
•       General managers and front offices
    •     Player evaluation and team building
•       Television, other broadcasters, and news media
    •     Entertainment, better content, storytelling, and visualizations
•       Bookmakers and bettors
    •     Betting odds and point spreads

                                                                        11.3.2019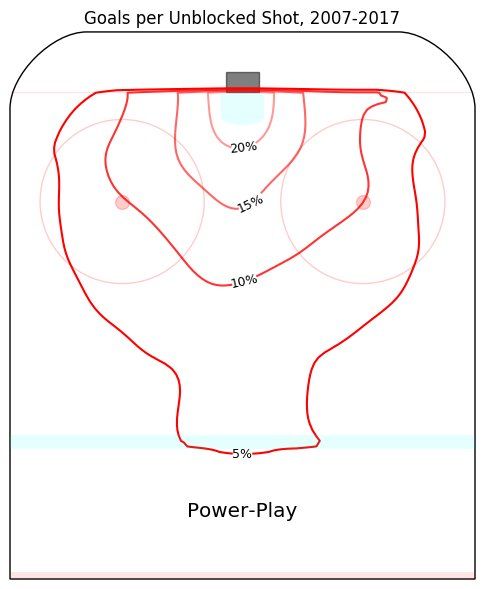
Data sources
•  Official summary statistics
  • Aggregated totals from game
     events
• Official play-by-play statistics
    •     Record of game events as they take
          place
•       Manual tracking and video
        analytics
    •     More detailed team-specific events
    •     Labor intensive approach
    •     Data consistency?
•       Automated tracking systems
    •     Expensive
    •     Consistency based on given event
          definitions

                                               11.3.2019
Data sources
•  Official summary statistics
  • Aggregated totals from game                •   https://www.youtube.com/edit?vide
     events                                        o_id=7IdxFcy3PFA
• Official play-by-play statistics
    •     Record of game events as they take
          place
•       Manual tracking and video
        analytics
    •     More detailed team-specific events
    •     Labor intensive approach
    •     Data consistency?
•       Automated tracking systems
    •     Expensive
    •     Consistency based on given event
          definitions

                                                                               11.3.2019
Methodology

• Basic statistics and more advanced techniques
  • Signal vs. noise
• Mathematical modeling
  • Rules and scoring system specific factors
• Machine learning
  • Neural networks, deep learning, Bayesian networks etc.
• Optimization
• Simulation

                                                             11.3.2019
EPL (football) – Expected goals
http://www.bbc.com/sport/football/40699431
11.3.2019NHL (ice hockey)
M.B. McCurdy, @ineffectivemath, https://twitter.com/i/web/status/899721405083906048.
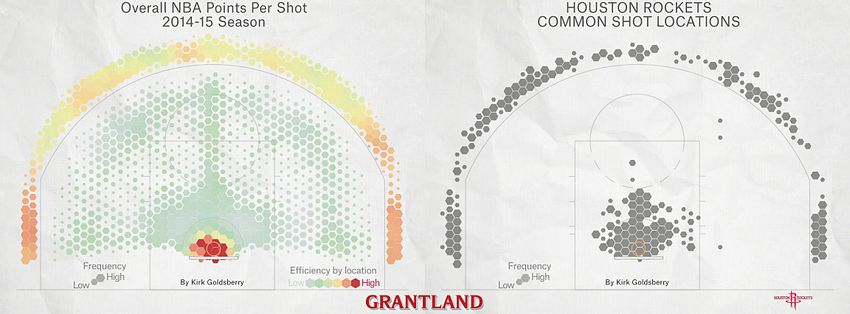
11.3.2019NBA (basketball) – Houston Rockets
K. Goldsberry, Grantland.com, http://grantland.com/the-triangle/future-of-basketball-james-harden-daryl-morey-houston-rockets/.
11.3.2019MLB (baseball) – Launch angle and velocity
D. Sheinin and A. Emamdjomeh, Washington Post,
https://www.washingtonpost.com/graphics/sports/mlb-launch-angles-story/.
11.3.2019NFL (American football) – 4th Down Bot
B. Burke and K. Quealy, 4th Down bot, New York Times. http://www.nytimes.com/newsgraphics/2013/11/28/fourth-downs/post.html
11.3.2019NFL (American football) – 4th Down Bot
B. Burke and K. Quealy, 4th Down bot, New York Times. http://www.nytimes.com/newsgraphics/2013/11/28/fourth-downs/post.html
11.3.20192. Team performance evaluation and
prediction of future outcomes
11.3.2019Motivation for team performance
evaluation and prediction
• Unbiased evaluation of performance
• Signal vs. noise
• Strength of schedule
• Strategy and planning
• Team building and “tanking”
• Storytelling and entertainment
• Betting analytics
• Betting lines
• Predictive analytics
11.3.2019Team performance evaluation
by ranking and rating
• The game results depend on (at least) three factors
• Home advantage
• Strength of the teams
• Random variation (stochastic component)
• The game results are observed and the teams are ranked or rated
according to their perceived level of performance.
• The objective of ranking and rating of teams is compare the underlying
strengths of the teams.
• Ranking: ordinal scale, i.e., the separation between successive teams is not
evaluated.
• Rating: interval scale, i.e., the differences between teams are measurable
and have an meaningful interpretation.
• Team ratings can be used for predicting the winners of future games
11.3.2019Prediction and winning probability
• Prediction of future results
• When estimates for team strengths have been calculated, they can be used
for estimating winning probabilities in future games.
• Modeling approach depends on the rules and the scoring
system
• How are the points/goals scored?
• Assumptions about the underlying scoring processes
• N.B., There are always a number of alternative modeling choices
11.3.2019Football
• Low scoring game
• Limited number of scoring
chances
• EPL: 2.77 goals/game in
2016-17
• Poisson distribution
• Scoring intensity
• “Small chance of a goal at every
time instant”
• Rough approximation
https://dashee87.github.io/football/python/predicting-football-results-with-statistical-modelling/
11.3.2019Basketball
• High number of scoring
chances
• NBA teams average ≈100
possessions per game
• Consecutive offensive
possessions are more or less
independent
• Central limit theorem
• Distribution of points can be
approximated using a normal
distribution J. Poropudas, Kalman filter algorithm for rating
and prediction in basketball, 2011.
11.3.2019How certain is the outcome of the
game?
• Law of large numbers
• Probability of an “upset”
• In football, a match between a very good and a very bad
team can still result in a tie or even an upset.
• In basketball, the better team usually wins.
11.3.2019Bradley-Terry model
• Flexible model for almost(?) any game with two teams/players
• Bernoulli trial: first team either wins or doesn’t.
• Outcome of each game is 0 or 1.
• Home advantage and scoring margin are not considered.
• Parameters
• Team ratings !" representing team strengths
()*
• Winning probability when team # meets team $: log = !" − !/
+,()*
• Parameter estimation using maximum likelihood
• No closed form solution
• Numerical methods 3 3
ℓ 1 = 2 2 4"/ log !" − 4"/ log !" + !/
" /
E. Zermelo, Die Berechnung der Turnier-Ergebnisse als ein Maximumproblem der
Wahrscheinlichkeitsrechnung, Mathematische Zeitschrift. 29 (1): 436-460, 1929.
R.A. Bradley and M.E. Terry, Rank Analysis of Incomplete Block Designs: I. The Method of Paired
Comparisons, Biometrika, 39 (3/4): 324-345, 1952.
11.3.2019Maher’s model for football
• “Scoring margin contains information.”
• Poisson scoring for home team and visiting team:
!" ~ $%&''%((*+ , -. )
!0 ~ $%&''%((1. , 2+ )
• Four parameters per team
• Offense at home and away: *+ and 1+
• Defense away and at home: -+ and 2+
• Number of parameters can decreased with equality constraints.
• Parameter estimation using maximum likelihood
• No closed form solution 9 9
• Numerical methods ℓ 4, 6 = 8 8 :+. *+ -. − :+. log *+ -.
+ .
• Not a “perfect fit” to actual data
• Independence assumption!
M.J. Maher, Modelling association football scores, Statistica Neerlandica. 36 (3): 109-118, 1982.
11.3.2019Dixon-Coles model for football
• Refinement of the Maher’s
model
• Modification to outcomes
0-0, 1-0, 0-1, and 1-1
• Dependence between teams’
scoring
• Better fit to actual results
• Parameter estimation using
maximum likelihood
M.J. Dixon and S.G. Coles, Modelling association football scores and inefficiencies in the football betting
market, Applied Statistics, 46 (2): 265-280, 1997.
11.3.20193. Course assignment: Optimal betting
portfolio for Liiga Playoffs
11.3.2019Finnish ice hockey league: Liiga
• Top Finnish Ice Hockey League
• 15 teams
• 60 games for each team (30 home games)
• 10 teams qualify for the playoffs
• See, http://liiga.fi/ottelut/2018-2019/runkosarja/.
• Regular season ends 14.3.2019
• Preliminary playoffs end 19.3.2019
• N.B., you can use all the information available up to that date in
your project work.
• Deadline for this project
• Presentation due 1.4.2019
• Report due 13.4.2019
11.3.2019Liiga standings (as of 10.3.2019)
http://liiga.fi/tyokalut/laskuri/
11.3.2019Liiga playoff format
• Six best teams at the conclusion of regular season proceed
directly to quarter-finals
• Teams placing between 7th and 10th (inclusive) will play
preliminary play-offs (“wild card round”) best-of-three
• The two winners of the preliminary playoffs take the last two slots
to quarter-finals
• All series after this are best-of-seven
• In all playoff series, the team with the higher playoff seed
holds the home advantage.
• In the semifinals, the matchups are determined based on the
regular season and the best team plays against the worst
team (“re-seeding”).
• N.B., you can skip the preliminary playoffs, if you like.
11.3.2019Liiga playoffs (last season)
11.3.2019Poisson regression
• Poisson regression
• Generalized linear model form of regression analysis for count data
• Assumption: the response variable ! follows a Poisson distribution
• If " ∈ ℝ% is a vector of independent variables, the Poisson regression
model takes the form
log ) ! * = , - * , where , ∈ ℝ./0
• Given a Poisson regression model 1 and input vector "
!|* ~ 4567758( :*; , - * )
• If => are independent observations with corresponding values *> of the
predictor variables, then , can be estimated using maximum likelihood
method. B
• No closed-form expression ℓ , = @ => , - *> − exp(, - *> )
• Numerical methods >A0
• R has a built in function glm() that can fit Poisson regression models.
11.3.2019Poisson regression for team ratings
in ice hockey
• For a league with ! teams, the parameters of the model are
• Home advantage "
• Team # offensive strength α% (! parameters)
• Team # defensive strength &% (! parameters)
• Parameters are collected to a vector
θ = (", *+ , … , *- , &+ , … , &- )
• Identifiability: &- = 0.
• When team # hosts team 1:
log 5 67 |#, 1 = " + *% − &;
log 5 6< |#, 1 = *; − &%
• N.B., higher parameter estimates indicate better offenses and
defenses.
11.3.2019Poisson regression for team ratings
in ice hockey
• Each team has two ratings
• Offensive strength
• Defensive strength
• Home advantage is included in modeling the goals of the home team.
• Home advantage is assumed to be equal for all teams.
• Goals scored by the two teams are modeled separately and assumed
to be independent.
• Each match is essentially two observations
• The number of goals for the home team
• The number of goals for the visiting team
• N.B., each match needs two rows in our data set, not just one
• R has a built in function glm() that can fit Poisson regression models.
11.3.2019Estimation of winning probabilities
(single game)
• Distributions of the home and visitor goals
!" ~$%&''%( exp , + ./ − 12
!3 ~$%&''%( exp .2 − 1/
• Probabilities $(!" > !3 ) and $(!" < !3 ) can be estimated by
enumerating “all” goal combinations or by using Monte Carlo
simulation.
• Home team wins the game, if !" > !3 .
• Visiting team wins, if !" < !3 .
• N.B., in playoffs a tie is not allowed (overtime and penalty shootout).
• Ignore ties by flipping a coin OR re-scaling the probabilities $(!" > !3 )
and $(!" < !3 ) so that their sum is equal to one.
11.3.2019Estimation of winning probabilities
(playoff series)
• Best-of-three playoff series
• Games are played until first team reaches two wins
• Best-of-seven playoff series
• Games are played until first team reaches four wins
• In Liiga playoffs, the home team alternates
• First game is hosted by the higher seed
• Second by the lower seed
• Third by the higher seed, etc.
• N.B., the home advantage “switches sides” from game to game.
• The winner of a playoff series advances to the next round.
11.3.2019Estimation of winning probabilities
(championship)
• To win the championship, a team has to win three playoff series
(and a potential preliminary playoff)
• N.B., the winning probability for each playoff series depends on the both
teams playing.
• Monte Carlo simulation
• Generate random samples of game results ("# , "% ) for each game of the
playoff series.
• Determine winner for the playoff series.
• Move to the next playoff series (or next round).
• Simulate the entire playoffs for, say, & = 10000 times to
estimate the winning probabilities * = (*+ , … , *- ).
• N.B., you only need to keep track of the champion for each simulation
run.
11.3.2019Construction of betting portfolio
• Maximize the expected value of the betting portfolio by
allocating a budget of ! = 1000 euros to the teams.
• In order to alleviate the risk related to the portfolio, no more than
50% of the budget should be allocated to any single team.
11.3.2019Decimal odds for betting
Team Decimal odds
Kärpät 1.79
• The payment for a
Tappara 9.13
successful bet is the
Pelicans 13.27
product of the money at
stake and the decimal odds. TPS 12.79
HIFK 13.70
• Decimal odds reflect the
inverse of the implied success HPK 17.44
probability. Lukko 47.95
• If the chosen team doesn’t Ilves 95.90
win, the stake is lost. JYP 120.00
SaiPa 190.00
Sport 480.00
Special thanks to Teemu Eirtovaara at Veikkaus.
11.3.2019Any questions?
11.3.2019You can also read