Human Population 2018 - Lecture 4 Demography Demographic transition theory Age demographics Debate
←
→
Page content transcription
If your browser does not render page correctly, please read the page content below
Human Population
     2018
            Lecture 4
           Demography
    Demographic transition theory
        Age demographics
            Debate 1
Questions on the reading.

           pp 37-49
             money
          investment
           feedback
            poverty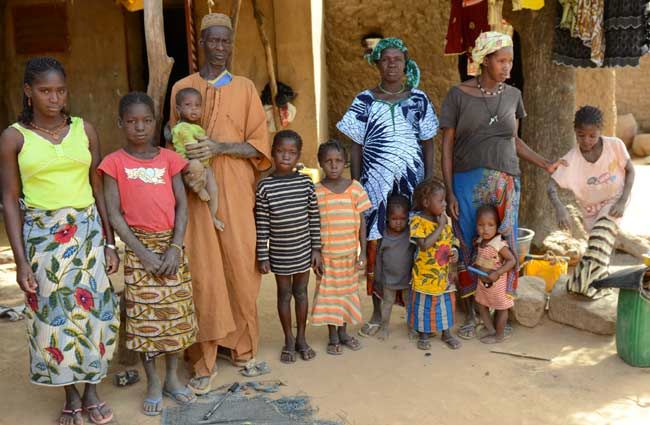
Demography
               is the statistical study of
✤ Definition   populations, especially human
               beings.
 ✤   Regional
 ✤   Age
 ✤   Historical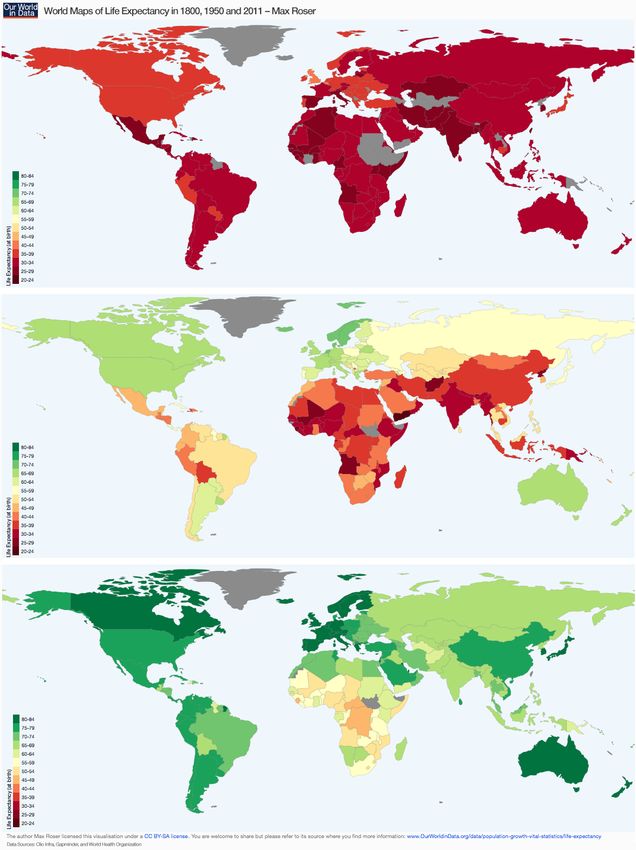
Demography
                                N

                               LEB
✤ Definition                   TFR
                              HDI (or GDP)
✤   Indicators                 IMR
                               Gini
✤   Age          N = number
                 LEB = Life Expectancy at Birth

✤   Historical   TFR = Total Fertility Rate
                 HDI = Human Development Index
                 IMR = Infant Mortality Rate
                 Gini = Income inequality index
Tasks of Demography
Collect data.

Graph data.

Look for regional variation.

Look for historical trends.

Look for interactions between indicators.

For demographers: generate hypotheses, publish, affect public policy.

For human ecologists: build model, connect everything, run predictions,
generate hypotheses, publish.

Demographic indicators: LEB
•   Life Expectancy at Birth                                       determines Death rate (DR)

       cohort   death rate
Age     •
Relationship: LEB vs GDP

    Why are some countries off the curve?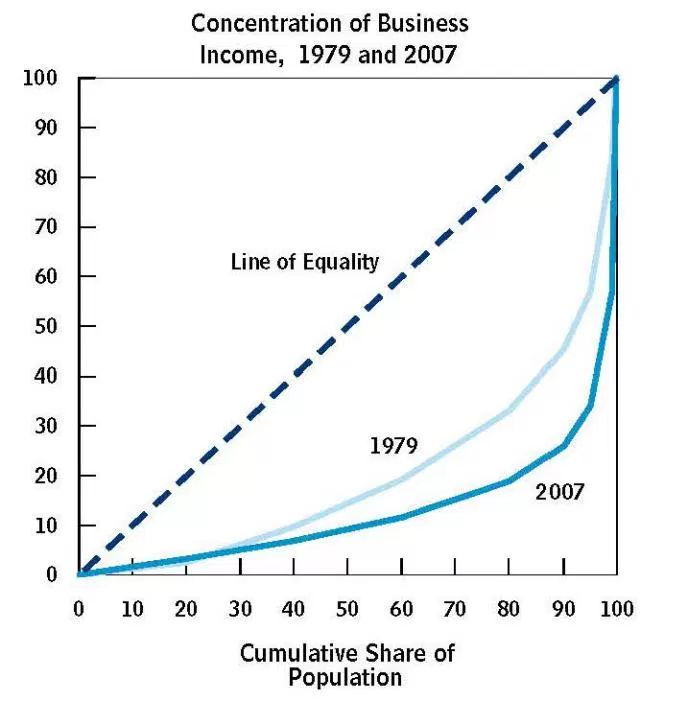
Regionality and history: LEB

                            Maps show
                      regional distribution
                       of life expectancy
                       in 1800, 1950, and
                               2011

                                8
Demographic indicators: TFR
•   Total Fertility Rate                    determines Birth Rate (BR), mostly

https://ourworldindata.org/fertility-rate

Trends: TFR

                           Birth Rate (BR)

•   Total Fertility Rate
Demographic indicators: HDI
influences education,
Human Development Index quality of life,
consumption. Correlates
with LEB
The HDI is the geometric mean of three indices:
Life Expectancy Index Education Index Income Index
LE: Life expectancy at birth (sometimes LEB)
MYSI: Mean years of schooling /15 (MYS=years that a person aged 25 has completed in formal education)
EYSI: Expected years of schooling/18 (EYS=years that a child is expected to spend in formal education)
GNIpc: Gross national income per capits. (II is 1 when GNI per capita is $75,000 and 0 when GNI per capita is $100.)Relationship : HDI , GDP
Each point is a
country or
region.
Relationship is
log-linearRelationship : HDI , GDP
Reduced to rankings,
GDP and HDI are
strongly correlated.
Outliers have high
GDP, low HDI. (High
Gini?)Demographic indicators: IMR
• Infant mortality rate Increases replacement value
• As infant mortality increases, the number of
children reaching child bearing age goes down as
a fraction of births. Increases replacement value.Relationships and Trends: IMR, TFR,
history, regionality
As IMR goes to
zero, TFR also
decreases, with
no exceptions
noted, over time,
over regions.
Does this mean
that the
determinant of
one is also the
determinant of
the other?Demographic indicators: Gini coefficient
Coronado Gini
• Measure of income inequality.
•
Fraction of total wealth
Area over curve, under
diagonal.
• 0≤G≤1
• G=0 represents perfect equality
• G=1 represents a perfect
inequality.
Fraction of population 1
G = 1 - 2∫ L(X) dX
0Historical trends : Gini
US
businesses
became more
unequal in
the period
from 1979 to
2007
http://acivilamericandebate.com/2014/06/14/picking-piketty-apart-part-i-his-contributionHistorical trends : Gini
Decreased income
inequality in Brazil
under Lula, is a
recent example of
decreasing Gini, going
against the trend.Cycle of poverty
The rich get richer, the poor get babies.
population
growth
(+)
poverty population
LtG p.45
Is this the model behind increasing Gini?Relationship: GDP , TFR
Historical trends: HDI , TFR
                                           Each point is a
                                           country or region.

                                           Sometimes called the
                                           "J-curve". TFR seems
                                           to turn up at very high
                                           HDI.

                                           Trends show
                                           increases in HDI,
                                           decreases in TFR, with
                                           exceptions.

   http://demographymatters.blogspot.com/2009/08/
Historical trends: Demographic transition.
1. As technology increases, death rate
decreases.
2. As death rate decreases, population
Stages: increases.
3. As population increases, birth rate decreases.
4. As birth rate decreases, population stabilizes.
5. Population stabilizes or declines
22
https://en.wikipedia.org/wiki/Demographic_transitionDemographic transition: Why?
Why does birth rate decrease as death rate decreases
and population increases?
1. Because women decide to have fewer babies knowing
survival rates are better?
2. Because the economy gets better with increasing
population and higher life expectancy, so children are
more expensive?
3. Because the economy gets better with increasing
population, escaping the cycle of poverty?
4. Because the food supply becomes limiting as the
population increases?
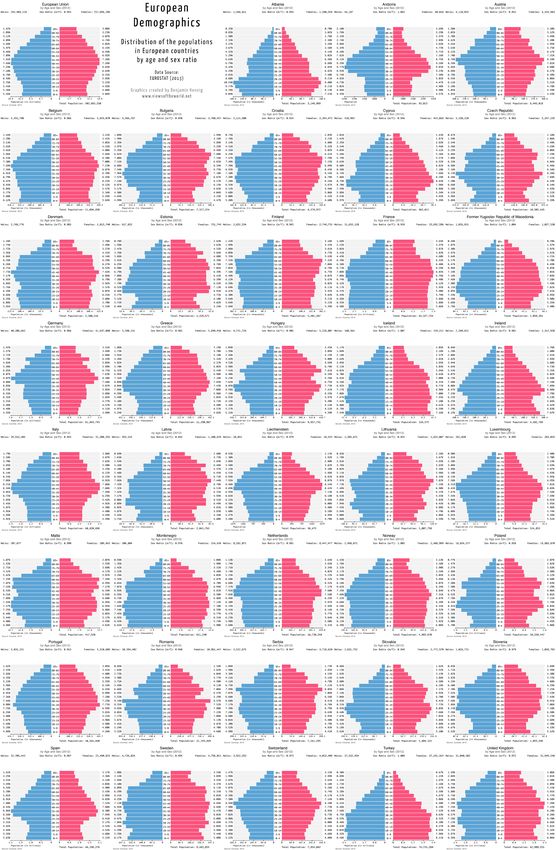
23Demographic indicators: age
Population may be broken down by age and sex, sometimes
called "population pyramids, since they usually get smaller
towards the top. Age demographics are useful for predicting future growth/
decline and for comparing between nations or regions.
24http://populationpyramid.net/ 25
Japan, 1960, 2010 and future

        WW2
                      echo
Post-WW2
baby boom

   Japan's birth rate and
   death rate both became
   low after WW2 with the
   subsequent economic
   and quality of life
   improvements.
                              26
Age
of Europe
http://www.viewsoftheworld.net/
demographics
27Family from growing population
age pyramid
for Mali 2015
photo from blogs.redcross.org.uk.
28Family from shrinking population
age pyramid
for China
2015
chinese family
29Stock type: conveyer
inflow outflow
# of buckets =
# of years before
reaching Overflow
Diagram of a Conveyor Stock With Fixed Delay
Number In Overflow bucket = [people]
Total Number In all buckets = [[people]]
If you plot a conveyer stock, you see only the Overflow. Create a variable and link it to [[stock]], plot that instead.
Read about Stocks: https://insightmaker.com/stocksin class
demo
exercise
IM 3 : age demographics using "conveyer" stocks
child = 100 (delay=25), adult = 50 (delay=30), old = 20 , people=[[child]]+[[adult]]+[[old]]
birth rate = Fix(RandNormal([mean birth rate], [uncertainty in birth rate]))
death rates = sliders.
simulate for 200 years. Do sensitivity test.Age demographics of a shrinking population
old
population
adult
child
year 0 25 55 80 150Age demographics of a growing population
child
adult
old
year 0 25 55 80 150Are we "in the weeds"
To determine if we are in the weeds, consider whether the
questions that we are asking require the added detail (e.g. of
age demographics.) Do they? Is there a simpler, "proxy
metric"?
34HUMAN Pop 2018 -- Debate description and rubrick
Instructions for debaters:
First week of classes
Go to Sign-Up Genius to select which dates you would like to debate, on which team (Affirmative
or Negative) and which presenter role (1N, 2N, 3N, 1A, 2A, 3A). On the other debate days you will be a
Panelist.
One week before -- announcement of debate topic, affirmative and negative.
Within 2 minutes of the announcement of the debate topic, enter your "naive verdict" on the debate
topic: Select Affirmative (A) or Negative (N), and select a confidence level in the range 50 (no idea, toss-
up) to 100 (absolute certainty).
One class meeting before the debate -- group discussion.
On the class meeting before debate day, you will have about 30 minutes of debate preparation at
the end of the class period. Meet with your team and finalize your three (or 4) principal arguments. Each
argument should be one short paragraph, written as clearly as possible. Before the end of the class, give
your written arguments to the other debate team. (Panelists can work on something else.)
In the days before the debate, work as a team to find errors, weaknesses, counter arguments or
fallacies to refute the arguments of the other side. Develop rebuttal arguments and counter-rebuttals to
strengthen your case. Make slides to show data that supports your principle arguments.
Debate day
Please, combine all slides into one file (Powerpoint, KeyNote or PDF) and send35to the instructor at
the beginning of class on Debate Day. Get slides ready. Go. Instructor will keep time.
Stage Time Presenter(s)the beginning of class on Debate Day. Get slides ready. Go. Instructor will keep time.
Stage Time Presenter(s)
Affimative Argument 1 5 minutes 1A
1st Negative Cross-Examination 3 minutes 3N (4N) asks/1A answers
Negative Argument 1 5 minutes 1N
1st Affirmative Cross-Examination 3 minutes 3A (4A) asks/1N answers
Affirmative Argument 2 5 minutes 2A
2nd Negative Cross-Examination 3 minutes 2N (3N) asks/2A answers
Negative Argument 2 5 minutes 2N
2nd Affirmative Cross-Examination 3 minutes 2A (3A) asks/2N answers
Affirmative Argument 3 5 minutes 3A
3rd Negative Cross-Examination 3 minutes 1N (2N) asks/3A answers
Negative Argument 3 5 minutes 3N
3rd Affirmative Cross-Examination 3 minutes 1A (2A) asks/3N answers
Affirmative Argument 4 5 minutes 4A
4th Negative Cross-Examination 3 minutes 1N asks/4A answers
Negative Argument 4 5 minutes 4N
36Stage Time Presenter(s)
4th Affirmative Cross-Examination 3 minutes 1A asks/4N answers
Questions from the panel 5 minutes Panel asks/Anyone answers
Time-out 8 minutes/team May be used before Cross-Examination
total. stages to prepare, if needed.
Instructions for panel: Panel reports.
The Panel members work independently to generate a Argument Diagram of the debate. Write
a concise listing of the arguments and label them with letters. Say one or two sentences
about how well supported each argument was, in your opinion. Then use the letter labels to
build the Argument Diagram. Save as Word or PDF and email or turn in on paper at the first
class meeting after the debate. See example.
Argument diagrams: A modified version of Van Heuveln's method
(http://www.cogsci.rpi.edu/~heuveb/teaching/CriticalThinking/Web/Presentations ArgumentDiagrams.pdf)
Use a circle to indicate a statement.
A statement is something that can be true or false. When you write the statement, if you are not
sure it is a statement, ask yourself whether it makes sense to say, "It is true that X" where X is the
statement. If that doesn't make sense, then X is not a statement.
Use a line to associate statements.
Use an arrowhead on a line to indicate support for a statement.
Use a bar-end on a line to indicate refutation of a statement.
Support or refutation can apply to a statement (circle) or to the association of the
statement (line). For instance, if A and B are falsely grouped together draw a bar-end line
to the line associating A and B. You can also refute a refutation! Or support a refutation, or
refute support. 37Example Panel report
The debate "Technology Will Save the World" consisted of four statements as follows:
A. Technology of war has led to an increased survival rate among soldiers. Presented by 1A. This
statement was well founded by graphs and statistics.
B. Improvements in birth control have lowered the fertility rate. Presented by 2A. This statement was
well founded by historical records.
C. Population in this century will level off or fall gradually. Presented by 2N. This is a conclusion based
on A and B, but was not sufficient.
D. C does not follow from A and B because the death rate must equal the birth rate. Presented by 1N.
This refutation is correct because A and B are not sufficient to conclude C.
A
B
D
C
(In words: D refutes the conclusion that A and B combine to support C.)
38Debate 1: Topic
• TBA
39Tessman_p74-78
Discussion of Tessman_p74-78

      First order judgement
 • Save the baby!!

    Second order judgement

• Smother the baby. :(

                                           43
First order judgement
trigger
input data
immediate
actionSecond order judgement
reasoning
input data
slow well-
considered actionFirst order versus second order
Fast versus Slow
No cognitive load versus Cognitive load
Alarm bells versus Currency
Intuitive versus Reasoning
May be non- Never non-
negotiable versus negotiable
46Types of "Alarm bells"
• Love --> Protect
• Disgust --> Avoid
• Fear --> Flee
47Can you turn off the alarm
bells?
48For Tuesday:
• Study Bram Van Heuveln
• http://www.cogsci.rpi.edu/~heuveb/
Teaching/CriticalWisdom/Fallacies.htm
• Debaters, start developing your
arguments.
49You can also read