Scottish Independence - Charting the implications of demographic change Ben Franklin
←
→
Page content transcription
If your browser does not render page correctly, please read the page content below
Scottish Independence
    Charting the implications
    of demographic change
           Ben Franklin        I May 2014 I

                          w w w. i l c. o r g . u k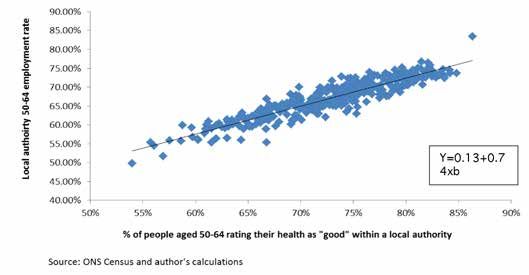
Summary

    By 2037
    Scotland’s working
    age population is
    expected to be

    3.5%
    than it was in 2013

•   By 2037 Scotland’s working age population is expected to be 3.5% smaller than it was
    in 2013 – the largest percentage fall of any UK nation.

•   If we assume that employment rates by age remain the same, this would imply a fall of
    45,000 (-2%) in total employment compared with a 1.7 million (+6%) rise across the UK
    as a whole.

•   To help ensure continued economic growth, Scotland will need to support longer
    working lives. Yet since 1981, at birth male life expectancy in Scotland has been
    around 2 years shorter than across the UK as a whole.

•   And perhaps most importantly, at birth disability-free life expectancy for males in
    Scotland is below State Pension Age and four years shorter than in the UK as a whole.
    It will therefore be particularly critical that Scotland addresses problems associated
    with health and disability in order to support longer working lives.

•   Over the next two decades the dependency ratio (the ratio of non-working age people
    to working age) will rise by 40% in Scotland by comparison to a 30% rise in the UK. At
    the same time, a key source of tax revenue for the region - oil and gas - is anticipated
    to fall from an historic average of £5.5bn per annum during the years 1980-2013, to
    around £2bn per annum during the period 2014-2041.

•   The combination of an ageing population and declining revenues from oil and gas
    extraction is likely to place downward pressures on government spending as well
    as upward pressures on taxation. The Institute for Fiscal Studies has estimated that
    without policy action, Scottish debt to GDP will reach 100% by 2033-34.

             Scottish
             Scottish Independence
                      Independence Charting
                                   Charting the
                                            the implications
                                                implications of
                                                             of demographic change II 2
                                                                demographic change    2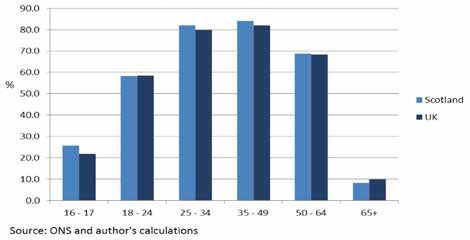
Introduction
The Referendum on Scottish Independence is just a few months away and it appears
as though the “Yes” vote is gathering steam with the gap narrowing to 7 percentage
points – the closest it has been since the Referendum was announced (see Chart). With
polling day approaching, now is a good time to take stock of the unique demographic
challenges facing an independent Scotland and discuss some of their economic and
fiscal implications through a number of charts and tables. What follows, relies heavily on
the most up to date population projections from the Office for National Statistics – the 2012
Principal Projection published in 2013.
Figure 1: Opinion poll results (Jan 2013-April 2014)

Source: Financial Times: http://www.ft.com/cms/s/0/2a5bdce0-c4a4-11e3-b2fb-00144feabdc0.html#axzz2zbuucFSo

Demographic Challenges
…mind the fertility gap: a declining working age population
Scotland is set to experience the most significant fall in its working age population (those
aged 15-64) of any UK region. The chart below shows that Scotland’s working age
population is expected to be 3.5% smaller in 2037 than it was in 2013 by comparison to a
5% rise in the working age population for England (see chart).
Figure 2: Percentage change in number of people of 'working age' 2013-2037

                          Scottish Independence Charting the implications of demographic change I 3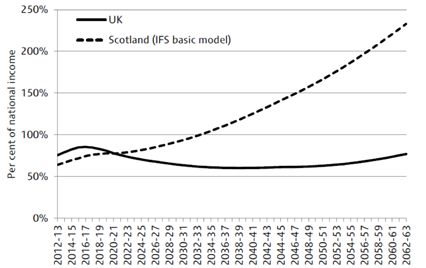
Differences in current and expected fertility rates help to explain why Scotland’s working
age population is expected to fall while England’s is expected to rise. The chart below
shows the stark difference in fertility rates per women across different age bands. In the
year 2014, it is anticipated that there will be 19 more babies for every 1,000 women aged
30-34 in England than in Scotland. The fertility gap between England and Scotland is
expected to shrink over time though fertility remains higher in England than in Scotland
over the forecast period.
Figure 3: Fertility rates per 1,000 females by age group

…falling employment, stagnant economy
In order to grow overall economic output an economy is reliant on two things – labour and
capital. A shrinking working age population could therefore imply slower economic growth
if it means a reduction in the amount of labour. We have modelled the impact of anticipated
population trends in the UK and Scotland on levels of employment to show how
demographic change could affect the labour supply (see chart). The crucial assumption
that we have made is that the employment rates by age for both countries remain as they
were at the end of 2013/beginning of 2014.
Figure 4: Percentage change in numbers in employment relative to 2012

The difference between the UK and Scotland is significant – while total employment falls by
over 1.5% in Scotland, it rises by nearly 6% in the UK as a whole. Incidentally, this difference
is not driven by regional differences in employment rates by age group as the UK and
Scotland have relatively similar employment rates by age band (see chart).

              Scottish Independence Charting the implications of demographic change I 4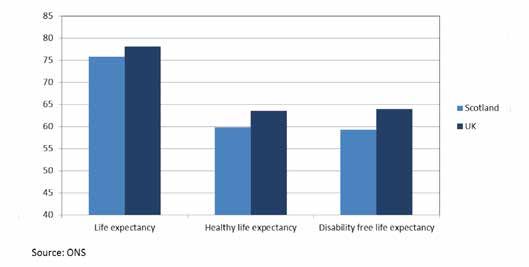
Figure 5: Employment rates by age band

Crucially, employment rates by age are unlikely to remain constant. Indeed, one way to
counteract the economic effects of a falling working age population is to boost the labour
force participation of all age groups including the over 65s which have by far the lowest
employment rate. This is likely to be a necessary move for the whole of the UK, and it is
particularly important for Scotland given the rate of decline in working age population
relative to all other UK regions.

…the importance of health
Health is a key determining factor in explaining whether someone is able to continue
working in later life. The below scatterplot shows the relationship between health and
employment of the 50-64 age group across local authorities in 2011 (each blue dot
represents a unique local authority). As the proportion of people aged 50-64 in “good”
or “very good” health rises, so does the employment rate of this age group within a
local authority. Indeed, according to our rough calculations, 85% of the variation in local
authority employment rates for the 50-64 age group can be explained by variations in
perceived health amongst this group (see chart)1.
Figure 6: Scatterplot of self rated health against employment rate by local authority

1
  This data relates to Census 2011 data on local authorities for England and Wales. We have conducted a simple bivariate regression model to
calculate the statistical relationship and more work is needed to identify other factors that are likely to be at play and whether the relationship is
robust over time. We are planning to work up the model in the coming weeks and apply it to Scotland.

                        Scottish Independence Charting the implications of demographic change I 5
…Scotland worse than UK for life expectancy, healthy life expectancy
and disability free life expectancy
Figure 7: At birth male life expectancy by region 2008-2010
As the chart above shows, healthy life expectancy and disability free life expectancy in
Scotland is short of 60 whereas for the UK as a whole each is approaching the current
State Pension Age of 65. In percentage terms, a man born in the UK is expected to live, on
average, 8% longer than someone in Scotland. In other words, the challenge of health as a
barrier to working longer and boosting the employment rates of older age groups is likely
to be particularly acute in Scotland. And there is the possibility that a large proportion of
the population will fail to reach retirement age in good health.
We may see some convergence between regions in terms of life expectancy though
past data suggests that regional differences may be here to stay. The Office for National
Statistics certainly seems to think so. The ONS estimates a consistent gap between the life
expectancy of males born in Scotland and those born in the UK during the period 1981-
2030 (see Chart).
Figure 8: Life expectancy by region 1981-2030
Scottish Independence Charting the implications of demographic change I 6Fiscal challenges: Rising
dependency and falling oil
revenues
While the number of people of working age in Scotland is anticipated to fall, the number
of people over the age of 65 is expected to rise by 59% (see chart)2. Unless the Scottish
Government can identify ways to substantially increase tax revenues over this time, this
rise in the dependency ratio is likely to have significant fiscal implications.
Figure 9: Dependency ratio indexed to 2012
…Oil revenues are unlikely to be a silver bullet
A project being undertaken by the Scottish Government allows us to estimate the
proportion of total tax revenue generated within Scotland accounted for by North Sea Oil
revenues over the last 30 years. It does this by allocating the revenues of North Sea Oil on a
geographic basis. The chart below shows that revenue from North Sea oil allocated on this
basis accounted for nearly 50% of total Scottish tax revenue in mid-1980s before falling to
below 10% in the 1990s. Since the 2000s it picked up and remains close to 20% (a sizable
chunk just above the long-run average).
Figure 10: Scotland’s reliance on North Sea Oil revenues
2
There are many different ways of calculating the dependency ratio. In this paper we have calculated it as:
Total dependency= (number of people aged 0-14+number of people aged 65+)/number of people aged 15-64)
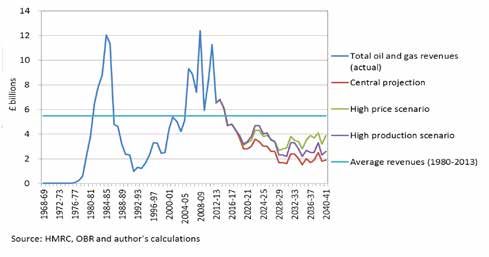
Scottish Independence Charting the implications of demographic change I 7But revenues from oil and gas are expected to fall as a consequence of falling production.
According to projections from the Office for Budget Responsibility (OBR) the UKs official
economic forecasting agency total revenues from oil and gas are likely to fall to around £2bn
per annum (central forecast) by comparison to an average of £5.5bn during the years 1980-
2013. Even under the OBRs most optimistic scenario where the price of fossil fuel is greater,
revenues remain significantly down relative to the historic average (fluctuating between £3-4bn
per annum during the years 2014-2040) (see chart). The central reason is that oil production
is flagging. In 1998 the UK produced 148 million tonnes equivalent in oil, but by 2013 this had
fallen to 49 million3.
Figure 11: Total oil and gas revenues: actual and projected
…potential impact on Government spending
Spending per person in Scotland is currently higher than in the UK, at £12,629 per person in
201112, compared with £11,381. The Institute for Fiscal Studies has modelled what might
happen to the government finances of an independent Scotland assuming that there is no
policy change. As a result of demographic trends and slowing oil revenues, the IFS forecast
that public sector net debt in Scotland will exceed 100% of national income by 2033-34. By
comparison, the UK which has somewhat more favourable demographics and is less reliant on
revenues from fossil fuel, will see net debt to GDP fall to around 60% over the same time period4.
Figure 12: Public sector net debt projections
Source: Institute for Fiscal Studies:
http://www.ifs.org.uk/comms/r88.pdf
3
https://www.gov.uk/oil-and-gas-uk-field-data#uk-production-data
4
http://www.ifs.org.uk/comms/r88.pdf
Scottish Independence Charting the implications of demographic change I 8Concluding remarks
The demographic challenges facing Scotland are similar to many other developed nations.
Scotland is expected to experience a decline in the working age population and a rise
in the population over the age of 65. Against this backdrop, economic policy will need to
incentivise longer working lives and increased investment in capital in order to improve the
productivity of the workforce and drive economic growth.
The demographic challenges are starker in Scotland than the rest of the UK - where the
working age population is expected to continue growing - so the need for an appropriate
policy response to ageing is particularly acute north of the border. An independent
Scotland will also have to face up to a future of slowing revenues from North Sea Oil which,
combined with an ageing population, could result in significant downward pressures on
government spending over the years ahead. Like many other nations, an independent
Scotland would have to make some tough decisions in order to ensure a vibrant yet
sustainable economic future.
Contact
For more information please contact, Ben Franklin, ILC-UK, 11 Tufton Street, London,
SW1P 3QB. Tel: 020 7340 0440. Email: benfranklin@ilcuk.org.uk
Scottish Independence Charting the implications of demographic change I 9The International Longevity Centre - UK (ILC-UK) is an independent, non-partisan think-tank dedicated to addressing issues of longevity, ageing and population change. It develops ideas, undertakes research and creates a forum for debate. ILC–UK 11 Tufton Street London SW1P 3QB Tel : +44 (0) 20 7340 0440 www.ilcuk.org.uk Published in May 2014 © ILC-UK 2014 The ILC-UK is a registered charity (no. 1080496) incorporated with limited liability in England and Wales (company no. 3798902).
You can also read