RANDSTAD MONITOR 2017 - RANDSTAD REGION IN EUROPE - metropolitan areas
←
→
Page content transcription
If your browser does not render page correctly, please read the page content below

Th
                                             com e Ran
                                          top par dsta
                                       me 20 E ed to d
                                         tro uro th
                                            po              e
                                               lita pean
                                                   na
                                                      rea
                                                          s

RANDSTAD REGION IN EUROPE
                                2017
                             MONITOR
                            RANDSTAD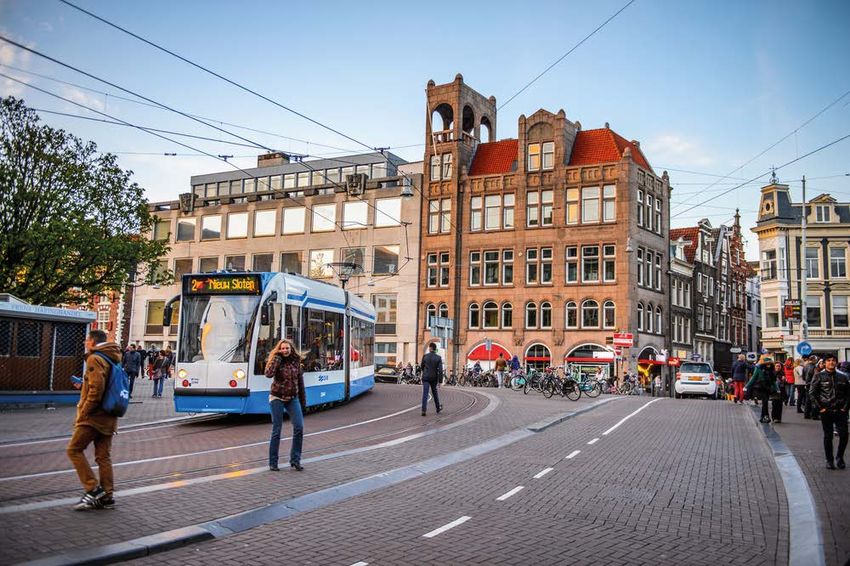
Noord-Holland

                                      Lelystad
                     Amsterdam   Flevoland
           Haarlem

                         Utrecht
Den Haag                 Utrecht

  Rotterdam
    Zuid-Holland
WELCOME to the Randstad Region!
The Randstad Region comprises four provinces in
the western Netherlands: Noord-Holland,
Zuid-Holland, Utrecht and Flevoland.
The ‘Randstad’ is not a single city and it is not an
agglomeration around a single city, such as one sees in
Paris or London. Rather it is a conglomerate of large and                   8.1 million
midsize cities. Together, these cities have all the facilities             inhabitants
necessary to play a significant role in the world.
It is a dynamic metropolitan region where 8.1 million
people – nearly half of the country’s population – live and
work. The well-known cities of Amsterdam, Rotterdam,
Utrecht and The Hague are located in the Randstad.
The region offers a wide spectrum of economic activities.
With a gross regional product (GRP) of EUR 367 billion,
the Randstad Region is the fourth-largest metropolitan
region in Europe after London, Paris and the Rhine-Ruhr.
More than half of the Netherlands’ gross national product
is generated in the Randstad.                                             GRP in EUR
The Randstad is a key point of access for Northwestern
                                                                          367 billion
Europe. The region offers direct connections to the
rest of the world, including through mainports such as
the Port of Rotterdam, the largest port in Europe, and
Amsterdam Schiphol Airport. In addition to other factors,
such as world-class museums in Amsterdam, this excellent
international accessibility makes the region appealing to
international businesses, conferences and tourists.
As a regional cluster, the Randstad is an important
driver for knowledge and innovation. Many knowledge
institutions – including leading universities – are located
in the Randstad Region.

                                                                 RANDSTAD Monitor 2017    1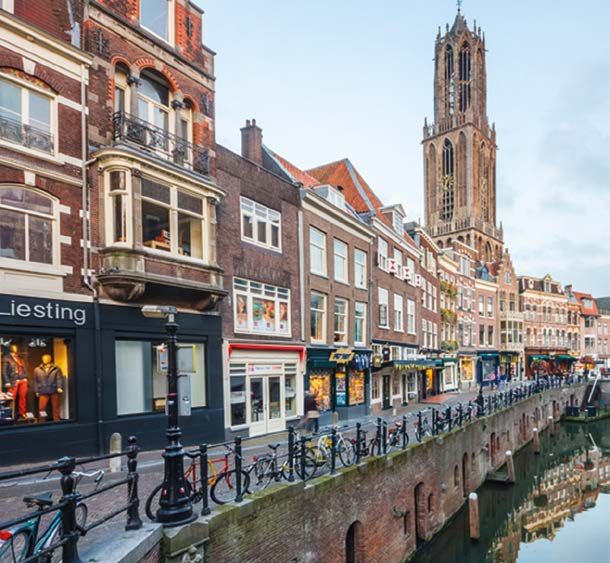
Comparing the top 20
                             European metropolitan areas
                   Economic activities around the world are concentrated in
                   metropolitan areas, and the same is true in Europe. The
                   objective of the Randstad Monitor research underlying this
                   brochure is to monitor the Randstad Region’s performance
                   and compare it to the top 20 metropolitan areas in Europe.
                   This is based on two core concepts: competitiveness and
                   liveability.
                   The metropolitan areas to which the Randstad was
                   compared were chosen based on internationally used
                   indicators. The indicators do not relate to the size of the
                   regions, but to the functions they fulfil.
                   The premise in this regard is that the regions must
                   be comparable to one another, which means that a
                   metropolitan region consists of both a city centre and the
                   surrounding area. This is referred to as the ‘daily urban
                   system’ that can be considered a natural spatial-economic
                   unit consisting of one or more employment centres and the
                   areas where the persons who work in those centres live.

2   RANDSTAD Monitor 2017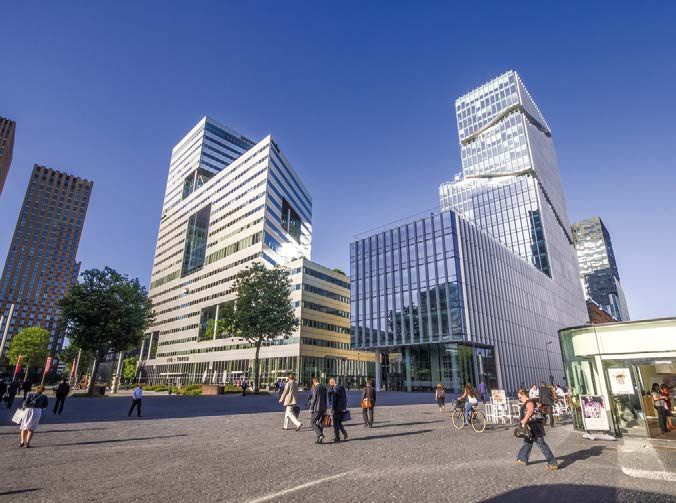
1    London           2    Paris                                                                   7   Madrid             8     Frankfurt
     790                   675                                                                          213                     197
     12,851                12,132                                                                       6,429                   4,016

3    Rhine-Ruhr       4    Randstad                                                                9   Munich            10     Berlin
     446                   367                                                                         177                      169
     11,704                8,116                                                                       2,887                    5,267

5    Milan            6    Brussels-Antwerp                                                       11   Barcelona         12     Rome
     295                   226                                                                         154                      153
     7,795                 4,968                                                                       5,443                    4,346

                                                                                   18
                                                                         13

                      17                                  15
                                                     14
                                            4                 10              19
                            1
                                        6       3 8                20
                                    2                     9             16

                                                     5

                                                              12
                            11
                  7

13   Stockholm        14   Hamburg              15   Copenhagen
     149                   148                       118
     2,257                 3,272                     2,007

16   Vienna           17   Manchester           18   Helsinki
     111                   93                        81
     2,513                 2,774                     1,627

19   Warsaw           20   Prague                                                       Gross Regional Product 2016 (bn Euro)
     80                    60                                                           Population (x1000)
     3,397                 2,607

                                                                                                        RANDSTAD Monitor 2017            3
Demographics
    The Randstad region is home to 8.1 million people. The population
    of the Randstad grew steadily between 1996 and 2016, with the
    number of inhabitants rising by approximately 1 million during that
    period. The Randstad, just like other metropolitan areas, continues
    to urbanise.
    While the increase in population in the Randstad remains
    relatively stable, population increases in other metropolitan areas
    are accelerating. With its 0.7 percent per year growth between
    1996 and 2000, the Randstad was still the fourth fastest-growing
    region in Europe, but its ranking dropped significantly between
    2014 and 2016, despite achieving that same rate of growth. On
    balance, the increase in the Randstad’s population is now at the
    average rate for the top 20 European metropolitan areas.
    Although ageing is the dominant trend in Europe, the population in
    the Randstad is relatively young. While the share of the Randstad’s
    population aged 15 to 74 – the potential working population – is
    average in size; the group of people aged 0 to 14 is relatively large.

4       RANDSTAD Monitor 2017
Population size and
        average population growth per period

                      London         Paris     Rhine-Ruhr       Randstad            Milan
Population (x1000)
2016                  12,851        12,132      11,704            8,116             7,795
Population growth
2014-16               1.4%           0.3%        0.8%             0.7%              0.3%
1996-00               0.8%           0.4%        -0.1%            0.7%              0.2%

                      Madrid       Barcelona     Berlin     Brussels-Antwerp        Rome
Population (x1000)
2016                  6,429          5,443       5,267           4,968              4,346
Population growth
2014-16               0.2%          -0.1%        1.4%            0.7%               1.1%
1996-00               1.0%          0.3%         0.0%            0.2%               -0.2%
                     Frankfurt      Warsaw      Hamburg         Munich           Manchester
Population (x1000)
2016                  4,016          3,397       3,272           2,887              2,774
Population growth
2014-16               1.4%           0.6%        1.1%            1.6%               0.7%
1996-00               0.2%           0.8%        0.4%            0.2%               0.1%

                      Prague        Vienna     Stockholm      Copenhagen           Helsinki
Population (x1000)
2016                  2,607          2,513       2,257           2,007              1,627
Population growth
2014-16               0.9%           1.7%        1.7%            1.2%               1.1%
1996-00               -0.2%          0.3%        1.1%            0.4%               1.3%

                                                                    RANDSTAD Monitor 2017     5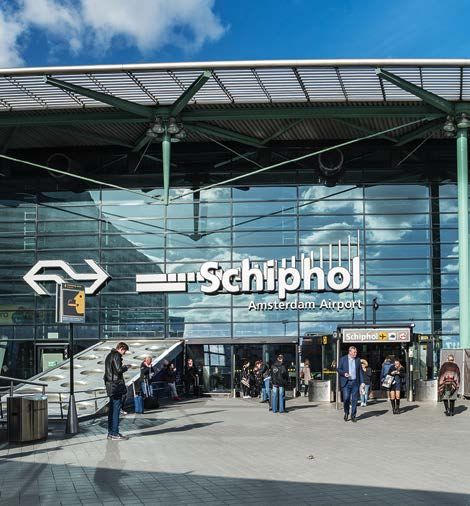
The five largest economies in Europe                        Gross Regional Product per capita

      790                                                                              66 000
    bn Euro      675                                                                   Stockholm
               bn Euro     446     367                        8     45 000
                         bn Euro bn Euro 295                      Randstad
                                         bn Euro                                                61 000
                                                                                                Munich

                                                                                               61 000
      London

                 Paris

                          Rhine-Ruhr

                                       Randstad

                                                     Milan
                                                                    56 000                     London
                                                                     Paris

                                        4                                       59 000
                                                                              Copenhagen

        Economic growth 2014-2016

                 4.5 %                             4.3 %             3.7 %                 3.2 %
               Stockholm                          Warsaw             London                Madrid

                 2.9 %                             2.8 %             2.8 %                 2.5 %
               Copenhagen                         Barcelona          Prague                Randstad     8

6      RANDSTAD Monitor 2017
Economic growth

The Randstad is the fourth-largest                  The Randstad also ranks in the sub-top in terms
                                                    of per capita growth in GRP; it may even take
economy in Europe, after London, Paris              fifth place, according to the provisional growth
and the Rhine-Ruhr, achieving a gross               figures for 2016. With an average GRP of EUR
                                                    45,000 per capita, the Randstad ranks eighth
regional product (GRP) of EUR 367                   in the top 20. Stockholm, London, Munich,
billion in 2016.                                    Copenhagen and Paris are the wealthiest urban
                                                    areas in Europe.
Since 2014, the Randstad has been experiencing
a significant recovery in economic growth. In       The recovery of the Dutch economy is centred
terms of economic growth, the 2.5 percent           in the Randstad. The Randstad’s recovery
increase in its GRP has returned the Randstad       is being driven by an increase in exports via
from bringing up the rear to a respectable          the airports and seaports in Amsterdam and
position in the sub-top of Europe. In the years     Rotterdam and is now being supported by the
2014-2016, the top 5 consisted of Stockholm,        recovery of the housing market and an increase
Warsaw, London, Madrid and Copenhagen. The          in confidence attributable to job recovery. The
Randstad is growing at a rate that is higher than   stabilised financial sector is also contributing to
that of the Netherlands as a whole (2.5 percent     the recovery of confidence. As a result, domestic
versus 2.1 percent).                                spending and consumption are on the rise. In
                                                    addition to the wholesale, commerce and
                                                    transport markets, the recovery is also making
                                                    itself felt in the hospitality, ICT and professional
                                                    services industries. The construction industry is
                                                    playing a special role, bouncing back strongly
                                                    with the improvement of the housing market.

                                                                           Fourth-largest
                                                                           economy in Europe

                                                                             RANDSTAD Monitor 2017   7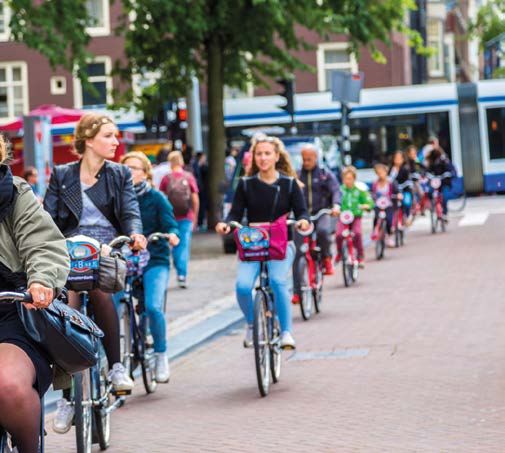
Employment
                            Employment is on the increase. But where prior to 2009
                            economic growth was primarily dependent on an increase in
                            the number of persons with jobs, the role of labour productivity
                            has become more prominent in recent years. For the years
                            2014-2016, the Randstad ranks an average of third in terms of
                            increased labour productivity.
                            Although the unemployment rate has started to drop, it remains
                            at a higher average than it did prior to 2009, when the Randstad
                            had one of the lowest unemployment rates among Europe’s
                            metropolitan areas.
                            The percentage of the people aged 15 to 74 that are working or
                            looking for work – known as the participation rate – is at a high
                            level of 70 percent, but that figure is not increasing. The average
                            for all metropolitan areas is 67 percent.
                            The period between 1995 and 2000 was a very successful
                            one for the Randstad, driven largely by domestic spending
                            through the strong development of the housing market and
                            the generous availability of credit, combined with a rapidly
                            increasing participation rate that made more people confident.
                            The gross participation rate is now moving towards the average
                            for metropolitan areas.

                                                Increase labour
                             2.4%               productivity
                                                2014-16

                              70%               Participation rate

8   RANDSTAD Monitor 2017
Working population and unemployment rate
6,581 6,222 6.005
5.1 9.6 5.3
London Paris Rhine-Ruhr
4,340 3,697 2.289
7.1 7.9 7.8
Randstad Milan Brussels-Antwerp
Number of workers (x1000, 2016) Unemployment rate (%, 2015)
Gross participation rate (2015)
76 % 72 % 71 % 71 % 70 % 5
Stockholm Munich Warsaw London Randstad
70 % 70 % 70 % 70 % 68 %
Copenhagen Helsinki Madrid Madrid Barcelona
=
Labour productivity
75 €/h
8 60 €/h Paris
Randstad
66 €/h 74 €/h
London Stockholm
70 €/h 73 €/h
Munich Copenhagen
RANDSTAD Monitor 2017 9Knowledge and innovation
Investments in Research & Development are on the upswing in
the Randstad; these now account for 2 percent of the GRP, just
under the average of 2.2 percent. To be in the European top,
however, R&D must account for some 3.7 percent of the GRP.
Of the working population in the Randstad, 39 percent are
highly educated, which is average for the top 20 metropolitan
areas. While this percentage is increasing in the Randstad, it
is increasing more significantly in other regions. The number
of foreign students is higher in the top European regions. The
number of people with lower-level educations is higher in the
Randstad than on average in other metropolitan areas, but the
number with average-level educations is lower.
In terms of trademark filings and product design rights, the
Randstad falls in the middle. The same is true for knowledge-
intensive, technologically oriented services.
10 RANDSTAD Monitor 2017Investment in Research and Development (in % of GRP in 2014)
3.9
Copenhagen
3.6
Stockholm
2.0 11
Randstad
Munich Helsinki Frankfurt
4.2 3.7 3.1
% of working population with higher education
49 % London
49 % Helsinki
48 % Paris
48 % Madrid
39 % Randstad 11
Foreign students 2014 as % of the total number of students
13 12.1
38.3 Randstad
London
18.0
26.3 Munich
Vienna
18.5
26.2 Copenhagen
Manchester
19.0
Berlin
RANDSTAD Monitor 2017 11Number of multinationals, total turnover
Paris
27
1,566,545
London
3 Randstad 21
12 1,004,222
702,762
Metropolitan area Number of multinationals Turnover in million US$
Traffic congestion: travel time lost due to traffic jams in 2016
22 % Randstad 1
23 % Copenhagen
25 % Madrid
Passenger air travel Internet traffic via main internet
(mln passengers, 2016) exchanges in Europe in 2017
158 London
3,417 Gb/s
Frankfurt
97 Paris
64 Randstad 3 652 Gb/s 3,130 Gb/s
Stockholm Randstad
61 Frankfurt
2,094 Gb/s
London
50 Madrid
12 RANDSTAD Monitor 2017Business climate
The Randstad is considered attractive to very
attractive for businesses. After London and
Paris, the Randstad ranks as the most important
location for multinationals in Fortune’s Global
500. Amsterdam’s overcapacity in the top
segment of the market for international office
space is a thing of the past. The recovery began
slowly in 2013, accelerating in 2016.
In terms of accessibility, the Randstad is among
the top regions of Europe. The Randstad has
the least traffic congestion (lost travel time
due to traffic jams) of the top 20 metropolitan
areas. Passenger air travel is developing apace
thanks to Schiphol Airport and the same is
true for freight transport thanks to the Port of
Rotterdam.
In terms of data traffic, Amsterdam and
Frankfurt are the two largest Internet exchange
hubs in Europe, distantly followed by London
and Stockholm.
The Randstad is also strong on tourism, now
ranking fourth of the top 5 thanks to above-
average growth in recent years. The Randstad
In terms of
holds first place when it comes to the number accessibility,
of international conferences. the Randstad is
among the top
The air quality of the Randstad region is relatively
good, ranking in the sub-top of metropolitan regions of Europe
areas.
RANDSTAD Monitor 2017 13Number of international conferences Number of nights spent
by tourists
254 1
Randstad
195 77
Berlin Paris
186 76
Paris Barcelona
185
Brussels-Antwerp 45
185 Hamburg
Barcelona
41 41
178 4
Berlin
Vienna Randstad
* N o data available
for London
Air quality in 2014 (particulate matter, PM)
28.5 % 32 % 32.3 % 36.3%
Manchester Madrid Munich Randstad
7
14 RANDSTAD Monitor 2017The Representation of the
Randstad Region in Brussels
The Representation of the Randstad Region promotes the
joint European interests of the provinces of Noord-Holland,
Zuid-Holland, Utrecht and Flevoland. The partnership
primarily focuses on the following topics:
Smart Randstad
Regional economy and accessibility
Circular economy and energy
Agrofood Colophon
This brochure is a publication of the
Environment, nature conservation & water Representation of the Randstad Region
in Brussels. The brochure is based on the
In Brussels, the Representation of the Randstad follows the “Randstad Monitor 2016: De Top-20 van
European policy agenda closely in an effort to contribute to Europese grootstedelijke regio’s 1995-
European regulations that are effective and enforceable, 2016” published by NEO Observatory (only
as well as to the optimal use of available European funds. available in Dutch).
The Representation of the Randstad accomplishes this Translation: Balance, www.balance2.nl
by sharing its knowledge and expertise with European Design: AdGrafics, www.adgrafics.eu
policymakers and other stakeholders and by actively Images: © Shutterstock
participating in networks of European regions. Disclaimer
The Representation of the Randstad
The Representation of the Randstad Region works from Region accepts no liability in connection
the House of the Dutch Provinces, where all twelve Dutch with possible inaccuracies and/or errors.
provinces maintain offices. No rights may be derived from the
information in this brochure.
RANDSTAD Monitor 2017 15Notes 16 RANDSTAD Monitor 2017
RANDSTAD REGION
Representation of the Randstad Region
c/o House of the Dutch Provinces
Trierstraat 59-61
B-1040 Brussels, Belgium
+32 2 737 99 82
regiorandstad@nl-prov.eu
www.randstadregion.eu
You can also read