INVESTOR PRESENTATION - October 2016 including FY 2016 Results - Redbubble
←
→
Page content transcription
If your browser does not render page correctly, please read the page content below
INVESTOR PRESENTATION
October 2016 including FY 2016 Results
Disclaimer

The material herein is a presentation of non-specific background
information about the Company’s current activities. It is information
given in summary form and does not purport to be complete. Investors
or potential investors should seek their own independent advice.
This material is not intended to be relied upon as advice to investors or
potential investors and does not take into account the investment
objectives, financial situation or needs of a particular investor. These
should be considered when deciding if a particular investment is
appropriate.

                                                                            2
#   AGENDA
    1.   What is Redbubble?

    2. Key Metrics & Drivers

    3. Growth strategy & Update

    4. Forecasts and Conclusion

                                  3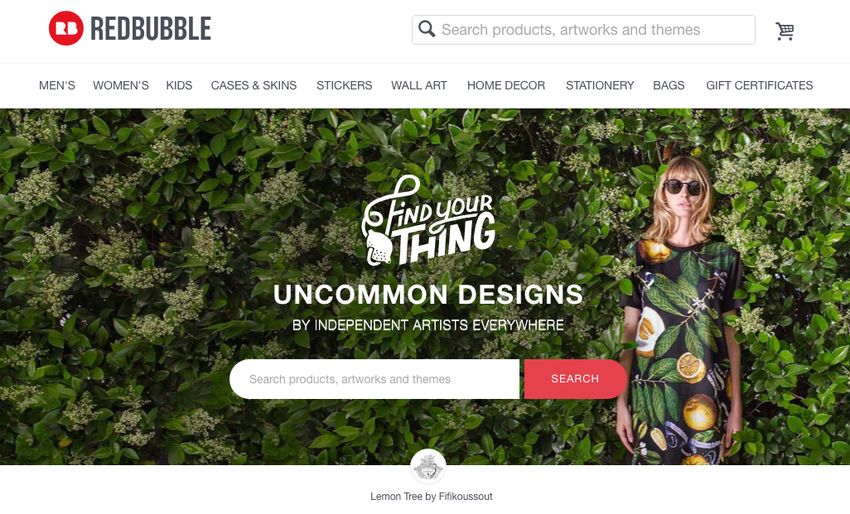
1   What is Redbubble?

                         4
A brief recap on our business for investors hearing the story for the first time
Founded in 2006 and listed in May 2016, Redbubble is a three sided marketplace with strong organic
growth driven by network effects

                                                            ARTISTS

              CUSTOMERS                                                                             CONTENT

                                                             438,0001
                                                          (as at 30 June 2016)

                  2.2M
               (full year FY16)                                                                              10.2M1
                                                                                                      (as at 30 June 2016)
                                                  3rd PARTY FULFILLERS
                                                                                                redbubble.com/about

                                           12 FULFILLERS (18 locations), 57 PRODUCTS,
         1. Net of removals: Source: Redbubble internal data                                                                 5
         All $’s are AUD throughout presentation and all years are Financial Year End 30 June
The Redbubble mission

              REDBUBBLE IS CREATING THE WORLD’S
      LARGEST MARKETPLACE FOR INDEPENDENT ARTISTS,
                 BRINGING    MORE CREATIVITY
                        INTO THE WORLD

                                                     6
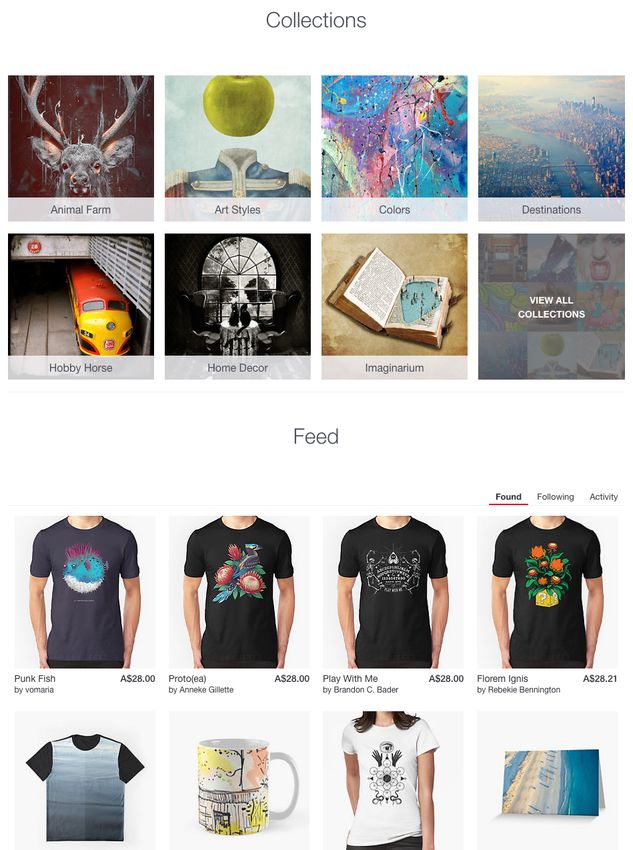
Redbubble provides for granular content: An example
In 2016 Hillary Clinton started a meme on deplorables, which RB artists seized

                                                                                 7
RB product growth takes advantage of this
60 products, a key growth driver

                                            8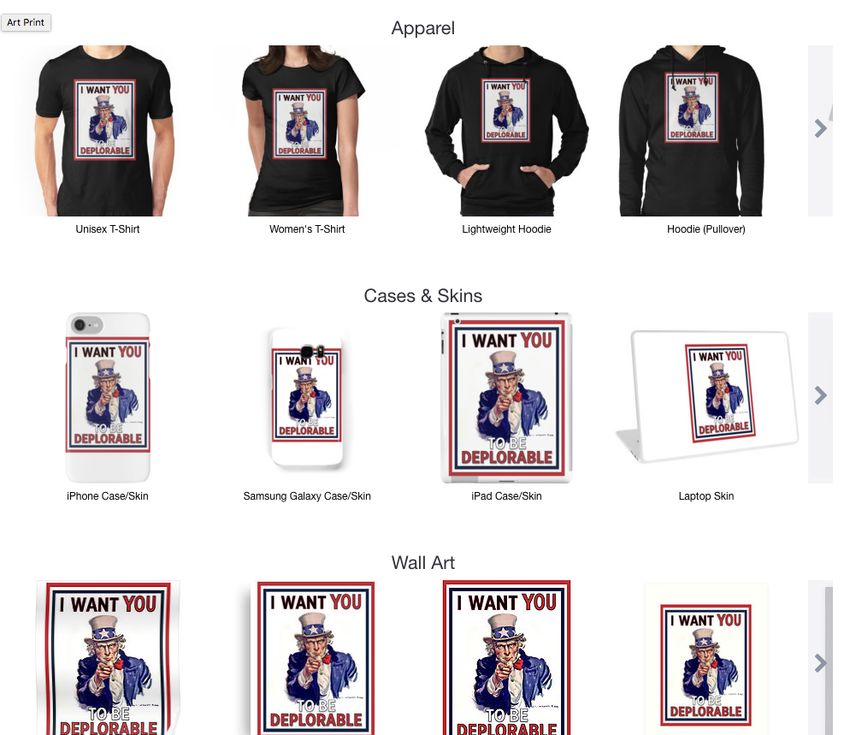
Riding the wave of consumers seeking personal style
  The success of Redbubble has been driven by a change in consumer sentiments

            Market Share of Brand Logos             Reflected in Attitudes
40%                                                 o   Individuality, creatively expressed, is the new
                                                        cool
35%
                                                    o   Tribalism is the new conformity
30%

25%                                                 & Lifestyle choices
20%                                                 o   Clothing (de-branded, retro, edgy)

15%                                                 o   Body art (tattoos, piercings)

                                                    o   Consumables (craft beers, new labels, slow
10%
                                                        food, Etsy)
 5%                                                 o   Media (social, user generated, shared)

0%                                                  o   Travel (Airbnb, Uber, Lyft)
Spring-01                                 Fall-14

                                                                                                          9
A distinctive offer to a large consumer base
Consumers come to Redbubble to buy what they cannot get elsewhere

       67%
      Of sales from
                                          Key Customer Stats                                    62%
                                                                                                 Under 35
                                                                                                               *

     works that sold
     50 times or less

                                        “I’VE BEEN USING REDBUBBLE FOR

       58%                                                                                      57%
                       1.                                                                                     *
                                           ALL MY GIFTS (BIRTHDAY AND
                                           CHRISTMAS)! I LOVE FINDING                             Female
     Sales from works
    that are >6mths old                     INCREDIBLY EXCLUSIVE AND
                                              UNIQUE ITEMS THAT YOU
                                         NORMALLY WOULDN’T FIND IN A
         63
      NPS (Jun 2016)
                                               TRADITIONAL STORE!”
                                                                                                36%
                                                                                             Repeat purchase %
                                                                                               of GTV FY2016
                                                                                               76% Growth in
                                                                                                Repeat GTV

          * Source: Data as per the May 2016 Prospectus
                                                                                                                   10
          1. In the management presentation accompanying the 4e there was a typo with the > sign reversed..
ARTISTS - With a huge & loyal group of creative sellers
Strong growth in selling artists drives the network
R
UARTE
438,000 154,300
G BY Q
Key Artist Stats
SELLIN
Total Selling Artists Creatives with sales
In FY2016
S
30 June 2016
ARTIST
Up 62% YOY
40% 98,000
Artists who sold in FY2007 are
$54,006
still selling in FY2016 Q4 FY2016
Top earning creative
in FY16
36%
of creatives exclusive
to Redbubble1
20,000
Q1 FY2013
1. Redbubble Artist Survey 2016
11Adding more products and fulfillers
Enabling the business to scale, improve customer experience and reduce risk
57
Number of Redbubble Fulfillers and Products
(at year end)
48
Split of sales by product category
FY2016
63% Apparel 35
12% Accessories
7% Home wares
10% Stationery / stickers 27
25
7% Artwork IN 18
19 19
LOCATIONS
12 12 11 12
9
7 7 7
5 5 5
3 3
FY2007 FY2008 FY2009 FY2010 FY2011 FY2012 FY2013 FY2014 FY2015 FY2016
Fulfillers Total Products
Note: Delivered 12 new products and discontinued 3 existing products in FY2016
Source: Redbubble internal data
122 Key Metrics & Drivers
13Strong growth in key measures FY2016 vs FY2015
FY2015 FY2016 YOY growth
Visits 103.1M 147.8M 43% • Continued work on
Search Engine
Conversion rate1 1.75% 1.87% 7%
Optimisation and paid
marketing effectiveness
AOV2 $49.6 $52.6 6% • Customer and Selling
Artist numbers both
grow in line with
delivery of growth
Customers 1.44M 2.20M 53% initiatives
• Driven by cart and
Selling Artists 95,500 154,300 62%
mobile user experience
improvements
1. Conversion rate is the percentage of visits to the site that result in a purchase being made
2. AOV: Average Order Value (Order sales / Order count)
Source: Redbubble internal data
14Redbubble continues to see a strong sales growth trajectory
With a naturally hedged geographic mix
GTV ($M) by Year & Quarter since launch
FY16
$142.9M
FY2016 GTV split by region
FY15
(no significant change on 2015)
$88.4M
65% Americas
27% Europe FY14
$59.3M
7% Oceania
1% ROW FY13
$33.7M
FY12
FY11 $15.7M
FY09 FY10
FY08 $6.0M
$3.6M $4.2M
$1.3M
Q1 Q2 Q3 Q4
Source: Redbubble internal data
15Scalable cash generating model
Redbubble margin analysis vs typical e-commerce retailer
RB Cash Generating Model (1H FY16) Global Internet Retailer
124% 6% 100% 0% 50%
18%
100% 67%
15%
8%
0% 33% 27%
GTV Tax Artist Rev Cost of Ware- GM as a % Sales Tax Cost Distrib- Ware- GM as a
Markup (IFRS) Sales housing of Rev of Sales ution housing % of Rev
& Inventory
• Margins going forward expected at 34% in line with full year results * > A$1bn in global sales, >$100m in Australia
16Redbubble grows strongly with low customer acquisition costs
All paid channels are GP accretive, 68.5% of FY2016 traffic is from free sources
Organic growth fuels sales…. ….with all channels profitable on first purchase
Sales by source (FY16) Gross Profit (FY16)
Organic
Search1
(39.0%)
68.5%
FREE $26.7M
Direct2
(14.0%)
Email (6.3%)
Other Free
(9.2%)
31.5%
Paid3 (31.5%) $12.3M
PAID (before paid
acquisition
cost of $7.7M)
1. Organic Search = traffic to the site originating from search click through that we do not pay for
2. Direct = Traffic from people coming directly to the RB homepage 17
3. Paid = Traffic to the site from sources we pay for (Google ads, Facebook ads etc.)
Source: Redbubble internal data3 Growth Strategy
18The strategic plan is about reinforcing the marketplace dynamics
MOBILE & CUSTOMER PRODUCTS & SUPPLY
EXPERIENCE CHAIN
Data Traffic Search Physical Products &
Supply Chain
Shop
Engage
Mobile
ARTISTS
NEW & CONTENT
GEOGRAPHIES
Artist services
New markets
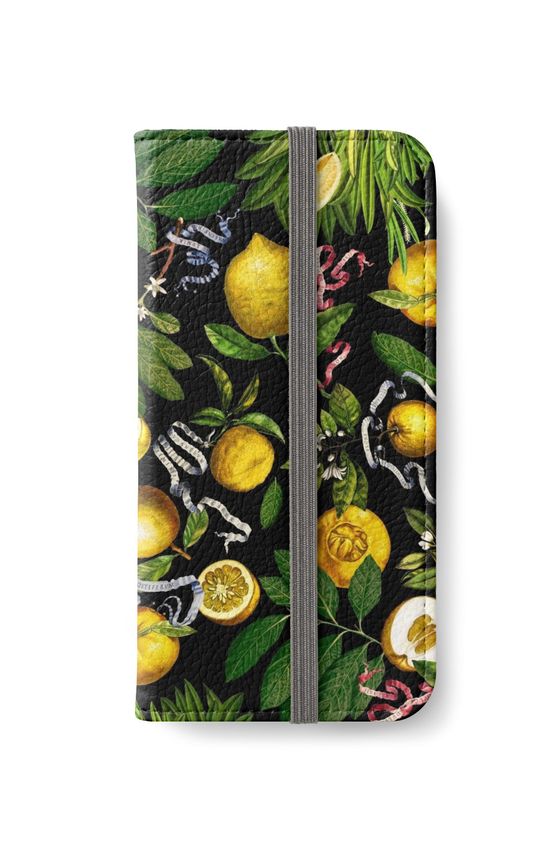
19Physical Products & Supply Chain
iPhone Wallet
Six new products launched since January
A-line Triblend
Dress Tee Chiffon
Top Contrast
Tank Heavy TeeEngage
New homepage
21New markets
Thee new local language sites
GERMAN
FRENCH
22Planned for H1 2017
Data - Improve search relevancy onsite and with Google
Traffic - Google Shopping and Facebook integration upgrades
Search
- New email platform
Product - 6 new physical products focused on home and gift giving for holiday
&
Supply - Continued localisation of fulfillment (EU focus)
Chain - Improve speed of new product launch process
Shop - Shift focus to website speed improvements
New Markets - Focus on growth of German, French and Spanish language markets
Engage - Improve personalisation of site and “browseability”
Mobile - Focus on mobile web browser experience
Artist - Improve the flow of traffic from Artist social activity (>400k artists)
234 Financials and Conclusion
24Tracking to Forecast with EBITDA ahead of target as Redbubble scales
Achieved FY2016 revenue and gross profit targets with less Operating expenses than anticipated
P&L FY2015 FY2016 FY 2017
Full Year Full Year
(A$M) Full Year 1H Actual1 2H Actual Forecast
Actual Forecast
GTV 88.4 80.3 62.6 142.9 143.5 214.9
Revenue 71.1 62.3 52.2 114.6 114.5 172.2
Cost of Sales (47.0) (41.8) (33.7) (75.6) (76.0) (113.5)
Gross Profit 24.1 20.5 18.5 39.0 38.5 58.7
GP Margin 33.9% 32.9% 35.4% 34.0% 33.6% 34%
Operating
(30.1) (24.4) (22.8) (47.2) (48.7) (60.0)
Expenses2
Other Income/
(0.6) (0.3) (0.1) (0.5) 0.0 0
Costs
EBITDA (loss) (6.5) (4.2) (4.5) (8.7) (10.1) (1.3)
1. Redbubble is a highly seasonal retail business, experiencing large sales volumes at Christmas
2. FY 16 2H Actual, FY and FY Forecast exclude Offer transaction costs
Source: Redbubble internal data 25Year on year Q3 and Q4 analysis, demonstrates scaling of the business
P&L Q3 Q4
(A$M) Q3 FY15 Q3 FY16 Growth Q4 FY15 Q4 FY16 Growth
GTV 20.6 30.3 47.2% 23.0 32.3 40.4%
Revenue 16.4 26.2 59.2% 18.3 26.11 42.8%
Cost of Sales (11.3) (17.2) 51.8% (11.9) (16.6) 39.0%
Gross Profit 5.1 9.0 75.6% 6.3 9.5 50.1%
GP Margin 31.1% 34.3% 10.3% 34.7% 36.5% 5.1%
Operating
(6.9) (10.4) 49.9% (10.7) (12.5)2 16.8%
Expenses
Other Income/
(0.3) 0.1 124.2% (0.0) (0.2) (476%)
Costs
EBITDA (loss) (2.0) (1.3) 36.0% (4.4) (3.2) 27.7%
1. The QoQ growth in GTV is not reflected at the Revenue level because Revenue is recognised on date of shipment whilst GTV is recognised on date of sale. At
December 2015, there was a larger than usual delay in Christmas shipping which gave rise to an improved Q3 Revenue result as compared to GTV.
2. Excludes Offer transaction costs of $2.0m
Source: Redbubble internal data 26Redbubble has enjoyed exceptional growth and is scaling profitability on the
back of strong fundamentals.
Massive Global Market High Entry Barriers
Redbubble is part of a massive fast growing global The Redbubble marketplace attracts more artists and
market (online apparel, accessories, stationary and customers in a reinforcing cycle that is difficult for
home wares). Redbubble estimates these markets at new entrants to compete against and further extends
US $22b. RB’s current market share is negligible. market leadership.
Scaleable Business Model Low Customer Acquisition Costs
As the marketplace, Redbubble does not generate the The marketplace provides low customer acquisition
content or undertake fulfillment. This provides for a costs averaging $5c for every $1 of GTV in FY 2016.
strong cash cycle as demonstrated by scaling to The diverse, growing and enduring content library
$100M in revenue in 2014 with just $8.7M in external attracts customers cost effectively via search, social
capital. and repeat customers.
Riding Shift in Consumer Tastes Multiple Growth Accelerants
Redbubble has strong structural tailwinds from Existing capabilities provide multiple means to drive
consumers preferences moving towards the more growth including: new products, new geographies,
personal, creative and individually relevant and away user experience improvements and remarketing to
from the mass produced and mass marketed. drive repeat customers.
2728
You can also read