Introduction to iRobot - Investor Relations December 2019

Page created by Kenneth Simpson
 
CONTINUE READING
Introduction to iRobot - Investor Relations December 2019
R

    Introduction to iRobot
         Investor Relations
          December 2019

                              December 2019   1
Introduction to iRobot - Investor Relations December 2019
Forward Looking Statements

• Certain statements made in this presentation that are not based on historical information are forward-looking
  statements which are made pursuant to the safe harbor provisions of the Private Securities Litigation Reform Act of
  1995.
• These statements are neither promises nor guarantees, but are subject to a variety of risks and uncertainties, many
  of which are beyond our control, which could cause actual results to differ materially from those contemplated in
  these forward-looking statements.
• Investors are cautioned not to place undue reliance on these forward-looking statements, which speak only as of the
  date hereof. iRobot Corporation undertakes no obligation to update or revise the information contained in this
  presentation, whether as a result of new information, future events or circumstances or otherwise.
• For additional disclosure regarding these and other risks faced by iRobot Corporation, see the disclosure contained
  in our public filings with the Securities and Exchange Commission.

                                                                                                       December 2019    2
Introduction to iRobot - Investor Relations December 2019
Investment Highlights
NASDAQ: IRBT                            Market Cap: $1.4B*                   HQ: Bedford, MA

 Category creator, innovator and leader in Robotic Vacuum Cleaners
 (RVCs)

 Track record of strong revenue growth with continued runway to
 support expansion

 Ongoing progress to diversify product portfolio and build position within
 Smart Home ecosystem

 Navigating challenging market conditions in the U.S. that have
 impacted 2019 performance

 Execute on 2020 strategic priorities to fuel growth, defend category
 leadership and fund initiatives critical to long-term value creation

* Based on stock price as of 12/12/19
                                                                                   December 2019   3
Introduction to iRobot - Investor Relations December 2019
Category Creator, Innovator & Leader
Introduced in 2002, 25m units sold, 9m+ connected robots
 Global category leader well positioned for future expansion

 Broadened portfolio over the past two years to extend premium position

 Consistent innovation across the portfolio to widen competitive moat
                             Global $ Segment Share (RVC+, +$200)

                                                            10%       11%
                     16%              19%
      22%                                                   2%         1%
                                                            3%         2%
                      3%                                    4%        3%            Others
                                      2%                    1%         3%
                      5%              3%                               3%
       6%             3%              2%                    4%                      Dyson
       2%                                                              4%
                     10%              10%                   11%        5%           Samsung
       7%
                                                                                    Panasonic
                                                                      14%           Cecotec
                                                                                    Neato
                                                                                    Shark
                                                                                    Roborock
      63%            63%              64%                   62%                     Mi
                                                                      52%           Ecovacs
                                                                                    iRobot

      CY'14         CY'15             CY'16                CY'17      CY'18   *Source: Global market size
     $945M         $1,130M         $1,394M               $1,779M    $2,489M   for Vacuum Cleaners >$200
                                                                              (Third-Party Market Data and   December 2019   4
                     +23%            +29%                  +28%       +40%    iRobot internal estimates).
Introduction to iRobot - Investor Relations December 2019
Track Record of Strong Revenue Growth
Continued double-digit international expansion
                                                 Revenue                                            Revenue by Geography
                                                                                                              (FY16)
                                                 ($ in millions)
$1,400
                                                                                                      APAC
                                                                                   $1.2 to $1.21B      22%
$1,200
                                                                          $1,093
                                                                                                                        Americas
$1,000                                                                     $171                                           53%
                                                                                                    EMEA
                                          $884                                                       25%

  $800                                    $154
                                                                           $312
                        $656
  $600                                    $242                                                      Revenue by Geography
                         $141                                                                                (9 Mos. 2019)

                         $166                                                                           APAC
  $400
                                                                                                         19%
                                                                           $610
                                          $488
  $200                                                                                                                  Americas
                         $349                                                                                             49%

                                                                                                      EMEA
                                                                                                       32%
     $-
                         2016             2017                             2018       2019e

                                            Americas    EMEA       APAC

* Expectations for FY19e as of 10/23/19
                                                                                                                  December 2019    5
Introduction to iRobot - Investor Relations December 2019
Continued Runway to Support Expansion
    RVCs Gaining Momentum with Consumers but Household Penetration Remains Low

                2012: ~$5B Market

                                                                            Immediate addressable market ~2X current installed base
                                       RVC
                                       13%

                         Non-RVC
                           87%                                                                                                          86MM
                                                                                                                                        HH’s
                                                                                                                                                              125MM
                                                                                                                                                               HH’s
                2018: $10B Market
                   12% CAGR

                                        RVC           RVC:
                                                                  ~14.2MM HH’s                                  25MM
                                        24%           25% CAGR    ~11% of Total                                 HH’s

Non-RVC:
10% CAGR                                                           Installed Base                        Incremental Potential   Longer Term Potential    Total U.S. HH's
                   Non-RVC
                     76%                                         Source: iRobot estimate at the end of 2018

 *Source: Global market size for Vacuum Cleaners >$200
 (Third-Party Market Data and iRobot internal estimates).

                                                                                                                                                         December 2019      6
Introduction to iRobot - Investor Relations December 2019
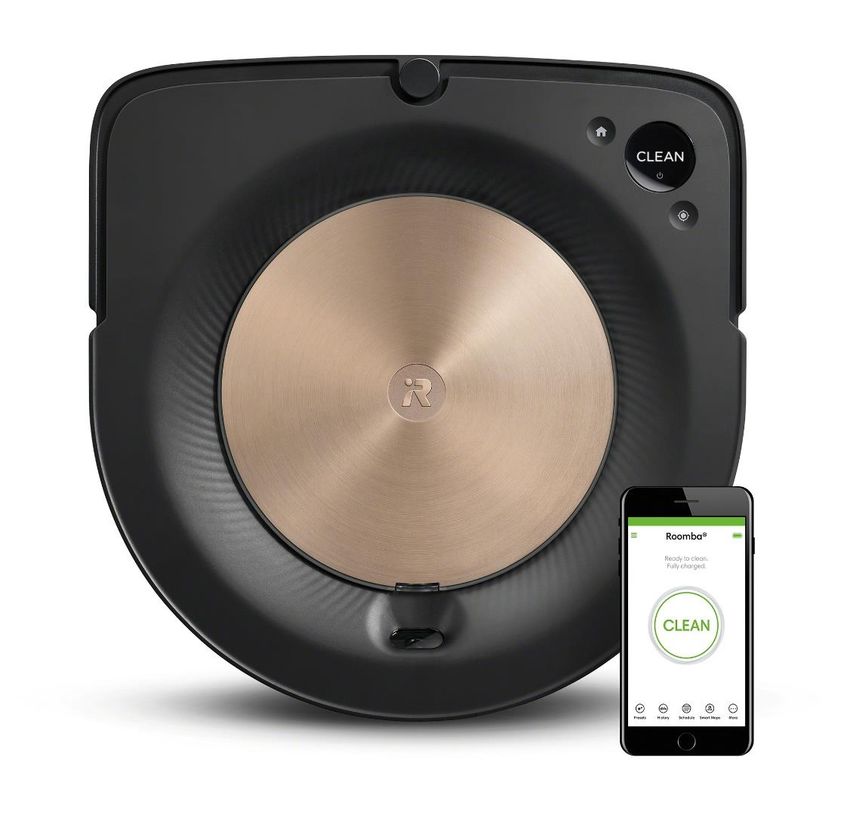
Fortify RVC Category Leadership
2018 Global Retail Share
                                                      2% 1% 1%
                                                4%
          North America                                                                  iRobot
                                                                                                                            EMEA               15%          iRobot
                                                                                                                                       2%
                  $809M                       10%                                        Shark                          $706M           6%
                                                                                                                                                            Cecotec
                                                                                         Neato                                                              Ecovacs
                                                                                         Samsung                                                     61%    Neato
                                                                    82%                  Ecovacs
                                                                                                                                        6%
                                                                                                                                                            iLife
                                                                                         All Others                                      10%                All Others

                                                     2%
                                               3%                                                                Global (excl China)
                          Japan                          4%                                                                             3%     12%            iRobot
                                                                                         iRobot
                  $187M                         5%
                                                                                         Panasonic
                                                                                                                      $1,785M          3%                     Shark
                                                                                                                                   4%                         Neato
                                                                                         Hitachi
                                                                                         Electrolux                                4%                         Cecotec
                                         22%                         64%
                                                                                         Dyson                                                       70%      Ecovacs
                                                                                                                                   5%
                                                                                         All Others                                                           Panasonic
                                                                                                                                                              All Others

*Source: Global market size for Vacuum Cleaners >$200 (Third-Party Market Data and iRobot internal estimates).
                                                                                                                                                           December 2019   7
Introduction to iRobot - Investor Relations December 2019
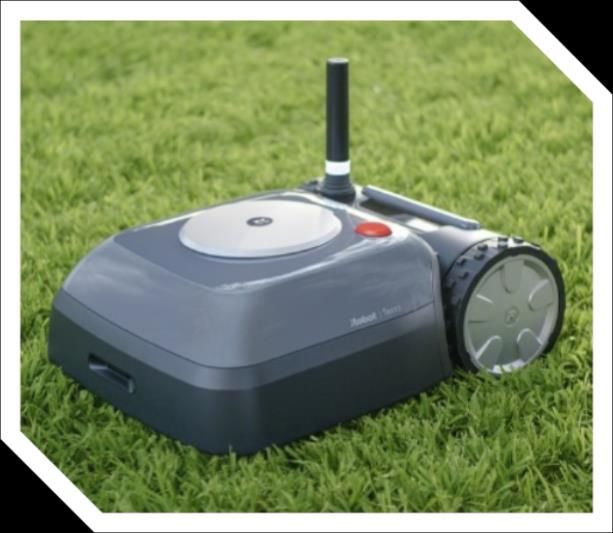
Fortifying RVC Category Leadership
  The Roomba Experience           What our customers want
                                                                           “
                                        “
                          AUTONOMY
                                                   I want…
                                            my robot to complete
                                            its mission every time
                                                                           “
                                                                           “
                                        “
                                                   I want…
                           CLEANING             clean floors.

                                                  I want…
                                              my robot to work
                          EASE OF USE       the way that I would

                                                           December 2019   8
Introduction to iRobot - Investor Relations December 2019
Our Innovation Establishes New Bars for RVC Leadership
                           Roomba s9/s9+                                                             Roomba i7/i7+                                       Roomba 900
                                                                Imprint™ Smart Mapping
                                                                                                                                                                  $649
                                  $1,099      $1,399                                                         $699   $1,099                                        vSLAM Advanced Navigation
                                  with Clean Base™                                                           with Clean Base™
                                                                                                                                                                  5x the air power*
                                  Automatic Dirt Disposal                                                    Automatic Dirt Disposal
                                  vSLAM Advanced Navigation                                                  vSLAM Advanced Navigation
                                                                     Clean Base™                             10x the air power*
                                  40x the air power*
                                  Deepest cleaning robot yet
                                                                 Automatic Dirt Disposal

                          Roomba e5                              AeroForce® Cleaning System                Cloud Connectivity                        Washable Bin
                                                                   Virtually no Maintenance
                                       $375

                       Roomba 675                              Cloud Connectivity             Dual multi-surface brushes                 Intelligent Navigation
                                        $299

   Introduce Innovation in flagship product; Flow innovation across lower price point products
* Compared to Roomba 600 series                                                                                                                                   December 2019       9
Introduction to iRobot - Investor Relations December 2019
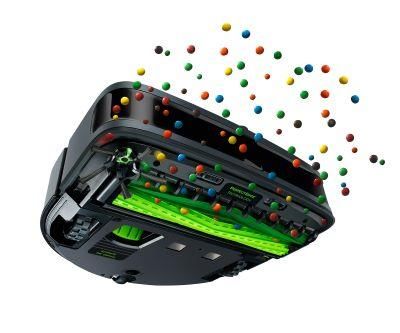
IEEE Top 20 Patent Powerhouses
Widening Our Competitive Moat                                                           Electronics - 2017
                                                                                     Rank        Company              Headquarters
    Sword                                                         Shield
    Encourage or force competitors to          Ensure freedom to operate              1          Apple Inc.                US
    design products that avoid
                                                                                      2          Sonos Inc.                US
    iRobot’s technology
    and brand identity                                                                3     LG Electronics Inc.        South Korea
                                                                                      4          GoPro Inc.                US

                                                                                      5     iRobot Corp.                  US
                                                                                             Dolby Laboratories
                                                                                      6                                    US
                                                                                                    Inc.
                                                                                      7          Sony Corp.              Japan
                                                                                      8            Canon                 Japan
                                                                                              Koninklijke Philips
                                                                                      9                                Netherlands
                                                                                                     NV
                                                                                             Hand Held Products
                                                                                      10                                   US
                                                                                            Inc. (Honeywell Int’l.)
                                                                                      11        Goertek Inc.             China
                                                                                      12         Kimree Inc.             China
                                                                                      13     Samsung SDI Co.           South Korea
     Openness
     Embrace open source and                    Enforcement                           14      Panasonic Corp.            Japan
     interoperability where appropriate   Take actions necessary to ensure            15         Hitachi Ltd.            Japan
                                                fair competitive landscape            16         Xerox Corp                US
                                                                                      17       Knowles Corp.               US
                                                                                              Fujifilm Holdings
                                                                                      18                                 Japan
                                                                                                     Corp.
                                                                                                 Int'l Game
                                                                                      19                                   UK
                                                                                                Technology
2017: Favorable final determination from ITC on iRobot U.S. infringement claim
                                                                                      20     Schneider Electric            US
2019: Pursuing IP infringement litigation against Shark-Ninja
                                                                                                    December 2019         10
Diversify Product Portfolio Beyond RVCs
                                              Mopping – Braava robot mopping family
                                              •   2019e revenue: ~$100m
                                              •   Introduced new Braava jet® m6 Robot Mop in May 2019
                                                    -   Advanced cleaning performance
                                                    -   Extended Coverage
                                                    -   iAdapt® 3.0 Navigation with Imprint™ Smart Mapping
                                                        Technology
                                                    -   Imprint™ Link Technology for teaming missions with s9, i7
                                                        or 900 series RVCs
                                                    -   Smart Charge & Resume and other Roomba digital features

                                              Mowing – Terra robot mower
                                              •   2019 beta tests in Germany and the U.S.
                                              •   Limited online sales in 2020 – larger scale commercial
  Vacuuming                                       launch in 2021
                                              •   Highly differentiated
                                                    -   Newly-developed wire-free beacon system
                                                    -   Imprint™ Smart Mapping Technology for intelligent
                                                        navigation
                                                    -   iRobot HOME App for customization and control
                                                    -   Smart Charge & Resume and other Roomba digital features

              Large, Global and Growth-Oriented Total Addressable Markets

                                                                                              December 2019    11
Digital Features Help Drive Differentiation

            Mapping & Navigation
            Makes our robots smarter, simpler to use, and to provide valuable spatial context

            User Experience
            Rich, convenient ways to interact with our family of products and
            customize their utility to support an ever-changing range of lifestyles

            Smart Home
            An ecosystem of connected, coordinated robots, sensors, and devices
            that helps deliver a higher quality of life

                                                                                      December 2019   12
Build position
within Smart
Home Ecosystem
                                  `

                                      `
   Smart devices provide
    actionable insights
      into the home...

                                                           `
                           `

 …and a system of devices using
       our products’ Home
  Understanding can deliver on
the promise of the Smart Home.        December 2019   13
Navigating Challenging Market Conditions in the U.S.

• Direct and indirect headwinds from U.S.-China trade war and
  escalating tariffs
 • May 2019: 25% tariff on RVCs, up from 10% in Sept. 2018
 • Limited competitor marketing in the U.S. through October 2019
• Price increases in July 2019 aimed at partially offsetting tariffs
  but resulted in suboptimal sell-through
 • Category growth slower than originally expected
 • iRobot gained share through August 2019
• Rolled back prices to pre-tariff levels on most SKUs and
  expect demand/sell-through to increase
• Excellent progress with supply chain diversification
 • Establish manufacturing in Malaysia
 • Rebalance manufacturing volumes within China
• Disciplined management of cost structure
                                                                       December 2019   14
Supply Chain Diversification – Considerations
                                      Geographic Risk
                              Location outside China with optimal
                              balance of infrastructure, expertise,
  Industry Trends             cost and proximity to iRobot offices        Dual-Source Risk
Diversification outside of                                              Opportunity to further dual-
China gains momentum                                                     sourcing efforts across
                                         Establish
                                                                              iRobot SKUs
                                     Manufacturing in
                                    Penang, Malaysia in
                                    2019 with continued
Product Roadmap                        ramp in 2020                            Expectations
We won’t sacrifice the                                                      Balance profitability
timing of new product                                                    expectations with need to
     introductions                Rebalance manufacturing                ensure continuity of supply
                                    volume within China;                                               Malaysia Manufacturing Update
                                    ensure dual sourcing                                               •   Great progress during 2019
                                                                                                       •   Successfully qualified production in Q319
             ROI                                                         Tariffs                       •   2020 volume plans being finalized
       Cost to establish                                              Impacts timing                   •   Plan to produce one entry-level SKU and
  manufacturing in Malaysia                                            and volume                          add additional SKUs as needed
 vs. cost in China with Tariffs

                                                                                                                           December 2019   15
Anticipated 2019 Performance* Shaped By …
                Revenue by Geography                                       Annual Revenue & Gross Margin                                               Annual Operating Margin & EPS
                         ($ in millions)                                                      ($ in millions)
$1,400                                                                                                                     $1.2B -             $3.50                                                          12%
                                                                      $1,250                                                           60.0%
                                                                                                                           $1.21B
                                                                                                                                                                                  $3.07
                                                    $1,200 - $1,210                                         $1,093
                                                                                                                                               $3.00
$1,200                                                                                                             50.8%                                                                 10% $2.60 - $2.80    10%
                                           $1,093                                     48.3%         49.0%
                                                                      $1,000
                                                                                                $884                                                          9%
                                                                                                                                 45%           $2.50
$1,000                                      $171
                          $884                                                                                                                                            8%                                  8%
                                                                                                                                       40.0%
                                                                       $750                                                                    $2.00               $1.77
 $800                      $154                                                $656
                                           $312                                                                                                                                                       6%      6%
            $656                                                                                                                                       $1.48
                                                                                                                                               $1.50
 $600       $141           $242                                        $500
                                                                                                                                                                                                              4%
                                                                                                                                       20.0%   $1.00
 $400       $166
                                            $610                       $250                                                                                                                                   2%
                           $488                                                                                                                $0.50
 $200       $349
                                                                                                                                                 $-                                                           0%
    $-                                                                    $-                                                           0.0%            2016        2017           2018          2019e
                                                                               2016             2017        2018           2019e
            2016           2017            2018         2019e
                                                                                         Revenue            Gross Margin %                                            EPS          OI %
                      Americas    EMEA     APAC

                                                                      Pricing/Promotion actions and tariffs impact                               Adjusted OpEx to mitigate lower revenue and
   Muted U.S. category growth colored by tariffs
                                                                                     gross margin                                                          gross margin pressure

       Strong category growth in EMEA with
     aggressive competitor pricing & promotion

     Modest category expansion in Japan as
   expected – and we have gained notable share

     * Expectations for FY19e as of 10/23/19
                                                                                                                                                                               December 2019                 16
2020 Strategic Priorities

                                                     Pre-tariff pricing, ongoing promotion and new
Drive U.S. segment growth
                                                     marketing activities
                                                     Capitalize on working media efficiency while
Fuel Roomba sales globally
                                                     tapping further into strong brand loyalty
                                                     Extend differentiation and elevate consumer
Leverage substantial investment in software
                                                     experience through digital features
                                                     Delight consumers across portfolio of RVCs,
Deliver on product roadmaps
                                                     robotic mops and robotic lawn mowers
                                                     Protect three decades of innovation and 1,400+
Defend intellectual property
                                                     patents; advance current IP litigation
                                                     Diversify supply chain, tighten discretionary
Limit expense growth while funding key initiatives
                                                     spending and control timing/pacing of new hires

                                                                                         December 2019   17
Preliminary View into 2020
                 Revenue growth in excess of 10%

              Gross margins expected to drop below 40%

                Maintain investment to drive long-term
                          shareholder value

           Minimal operating expense leverage only partially
                     offsets gross margin decline

           Operating income down significantly from 2019

                                                               December 2019   18
Summary

Category creator, innovator and leader in Robotic Vacuum Cleaners
(RVCs)

Track record of strong revenue growth with continued runway to
support expansion

Ongoing progress to diversify product portfolio and build position within
Smart Home ecosystem

Navigating challenging market conditions in the U.S. that have
impacted 2019 performance

Execute on 2020 strategic priorities to fuel growth, defend category
leadership and fund initiatives critical to long-term value creation

                                                                            December 2019   19
THANK YOU

Any questions?

                 December 2019   20
You can also read