An Update on the Impact of COVID-19 and Low Oil Prices on Alberta's Power System - June 2020 - AESO
←
→
Page content transcription
If your browser does not render page correctly, please read the page content below

An Update on the Impact of
COVID-19 and Low Oil Prices on
Alberta’s Power System
June 2020
Ongoing monitoring and reporting of the
impact of COVID-19 and low oil prices
•   In April 2020, the AESO provided to the stakeholders two
    reports with initial observations and scenarios on load and
    reliability
     –   These analyses were in response to the declaration on March 17 of
         a public health emergency in Alberta related to the COVID-19
         pandemic and the start of low oil prices due to a collapse in global
         demand and oversupply due to OPEC+ disputes
     –   Scenarios tested a range of weakened economic conditions and oil
         production shut-ins
     –   These scenarios were designed as stress cases and no supply
         adequacy concerns were revealed during these simulations

•   The AESO published the following reports:
     –   A stand-alone report with preliminary analysis on load
     –   A supplement to the May 2020 Long-term Adequacy report with
         simulation results

•   This memo presents an update on load trends and provides
    revised scenarios for the next two years

                                                                                2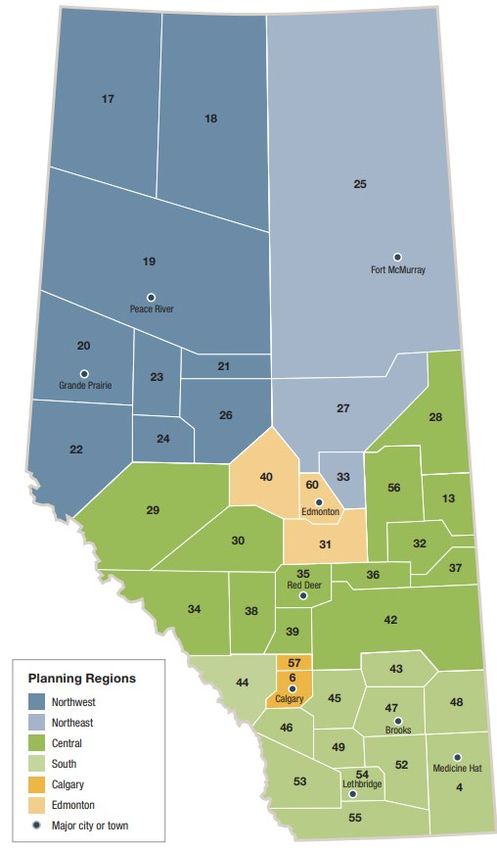
Highlights

•   COVID-19 and low oil prices have had unique impacts on Alberta Internal Load (AIL)
     –   COVID-19 directly impacted system load, which was the primary driver of downward trends in AIL in
         March-April
     –   Load at behind-the-fence (BTF) industrial sites was stable until late April, and has since begun to
         decline due to persistently low oil prices
     –   The decline in BTF load since May has negated the modest recoveries in system load

•   As the province re-launches from the pandemic, the effects of a low oil price environment
    are expected to weigh more heavily on AIL growth
     –   Load at oilsands sites has dropped mainly due to production reductions; other industrial loads
         including pipelines, oil and gas drilling, and gas processing facilities are also down

•   Economic recovery back to 2019 levels may not occur in the next two years
     –   Economic outlooks point to a decline in 2020 and modest growth in 2021

•   Accordingly, the AESO’s current 2-year AIL load forecast (based on P50 weather) indicates
    a drop between 273 and 353 MW on average in 2020 compared to 2019
•   The AESO will continue to monitor economic and energy trends, with updates to be
    provided as needed

                                                                                                               3
Context
Since the April memo, restrictions aimed at
slowing COVID-19 have eased…
•   Since April, the COVID-19 curve has been flattening due to a series of policies and
    measures
                                                                              Daily New COVID-19 Cases in Alberta
                                                                 400
                       # of New Cases (= Confirmed + Probable)
                                                                 350

                                                                 300

                                                                 250

                                                                 200

                                                                 150

                                                                 100

                                                                  50

                                                                   0
                                                                 2020-01-01   2020-01-31   2020-03-01   2020-03-31   2020-04-30   2020-05-30

                                     Source: AHS, June 15 2020; https://www.alberta.ca/stats/covid-19-alberta-statistics.htm

•   The province is now relaunching the economy from the outbreak, following a staged
    recovery plan
     –   On May 14th, restrictions on commercial activities were gradually lifted and employers were given
         more flexibility to no longer operate in a work-from-home only mode
     –   The next phase of the Government of Alberta’s Relaunch Strategy (date currently unannounced) is
         expected to open all workplaces and relax public gathering restrictions

                                                                                                                                               5
… on the other hand, the energy sector has
shown signs of deterioration…
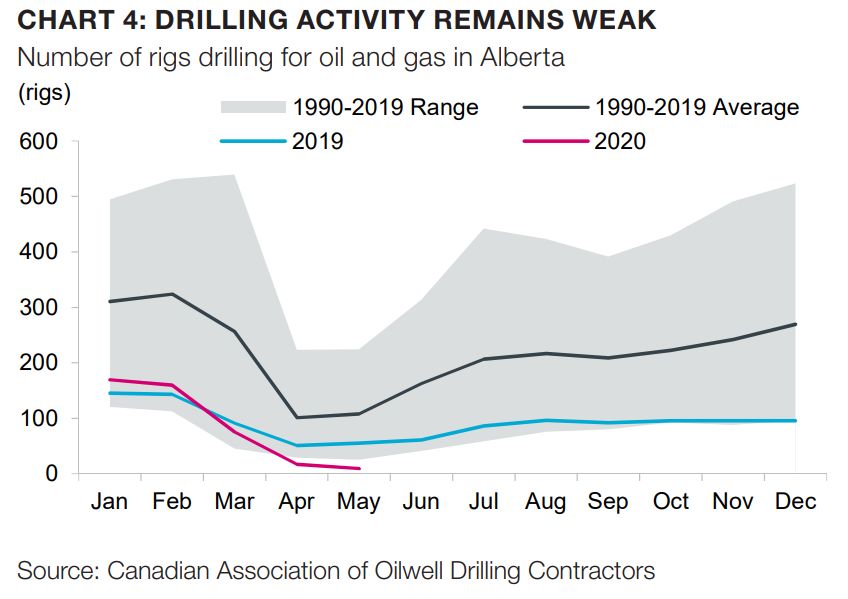
• Global oil demand decreased in Q1 and Q2
2020 due to the global impact of COVID-19
– Earliest recovery expected is fall of 2020 but
could be later
US$/bbl
• Global uncertainty has led to downward
pressure in oil prices, including Alberta’s
Western Canadian Select (WCS)
• Oilsands producers have reacted by shutting in
high cost heavy oil production as impact of pre- Source: Daily Oil Bulletin
existing market issues are exacerbated with low
oil prices
– CAPEX cut of ~ $9 billion from Canadian oil
producers
– Alberta curtailment policy – production limit is
expected to be maintained thru 2020
• New oil and gas activities are also down in
response
Copied from Alberta Finance and Treasury Board’s Weekly Economic Review for the
week of June 5, 2020 (link)
6… and oil futures suggest Alberta energy
sector has tough times ahead
• Brent, West Texas Intermediate (WTI) and WCS prices remain low and are expected to
move modestly higher in the medium-term as supply and demand balance
– OPEC+ deal in May amounted to the largest coordinated cut in history, but quota cheating has
offset expected cuts
• Current market expectations suggest that price recovery is not expected to reach levels
that would support the economics of Alberta producers
– WTI future prices are expected to remain below US$40/bbl
Oil Prices WTI Futures (as of June 17, 2020)
Brent OPEC Reference Basket WTI 80.0
80 70.0
60 60.0
US $ per barrel
US$ per barrel
40 50.0
20 37.4 37.7 37.9 38.1 38.4 38.5 38.7 38.9 39.1
40.0
0
30.0
-20
20.0
-40
-60 10.0
0.0
Jul Aug Sep Oct Nov Dec Jan Feb Mar
2020 2020 2020 2020 2020 2020 2021 2021 2021
Source: Quandl API queries of EIA and commodities market data Source: marketwatch.com
7Recent Observations and Analysis
Overview of the Alberta Interconnected
Electricity System (AIES)
•        The AESO divides the AIES into 6 transmission
         planning regions
                –     Regions are further divided into 42 planning areas

•        Industrialized regions contribute the most to load
                –     Oil and gas-heavy regions: NE (includes Fort McMurray) +
                      NW = ~38%
                –     Other industrials and service regions: Edmonton + Central
                      = ~38%

•        Regions with a smaller industrial footprint account for
         ~24% of load
                –     Calgary = ~13% ; South = ~11%

                                  Regional Breakdown
                    Northeast   Northwest   Edmonton   Central   South   Calgary
    2017-2019

                          27%        11%      19%       19%       11%    13%

                0%     10% 20% 30% 40% 50% 60% 70% 80% 90% 100%                    Source: https://www.aeso.ca/assets/Uploads/PlanningRegions-Nov26-
                                                                                   PRINT.pdf
                                                                                                                                                       9
How to interpret the following analysis?
• Our analysis compares actual load values against a normalized load
– Normalized load means values that would have been expected based on actual weather and
season but without the effects of COVID-19 and low oil prices
– Normalized load is a hypothetical load that is absent of these two major shocks*
• February 2020 is set as the reference period
– We re-base all comparisons between actual and normal load to February 2020 values
– Given that COVID-19 and low oil prices began to impact Alberta load in March 2020, re-basing to
February isolates the impact of COVID-19 and low oil prices within the larger baseline trend
observed earlier in 2020
• The difference between actual and normalized load compared to the reference period can
be interpreted as the load decline associated to COVID-19 and low oil prices
– Difference estimates are smoothed via a moving average that is centered within a 30-day range –
i.e., the April 30th estimate is the average of estimates from April 16 to May 15
* Normalized load is generated using a linear regression model with time series data of temperature and calendar/seasonal variables for each load type. The model period covers 2017
thru February 2020 (the reference period). The resulting coefficients are then used with observed temperature and calendar/seasonal variables since the reference period to calculate
the predicted value for each load type. This methodological approach is similar to Cicala (2020), Shaffer, Leach and Rivers (2020), and TESLA Inc. (2020).
10COVID-19 and low oil price impact to date on
Alberta Internal Load
• Alberta internal load (AIL) has been negatively impacted by the confluence of factors such
as measures imposed to control and flatten COVID-19 cases and reductions in industrial
output in response to a low oil price environment
• AIL declined by almost 8% compared to normalized AIL benchmarked to the reference
period
AIL - 30-day Rolling Average Change
10%
Change in Actuals vs Normal (%)
8%
6%
4%
2%
0%
-2%
-4% AIL
-6%
-8%
-10%
11Unpacking AIL: system load and behind-the-
fence load are responding differently
• AIL is composed of system load (73%) plus behind-the-fence (BTF) load (27%)*
– From March through April, AIL declines were primarily driven by declines in system load while BTF
held relatively constant
– Since May system load showed signs of slight increases; but a declining BTF load has completely
offset these incremental gains, leaving AIL relatively flat
• Load reductions at BTF industrial sites and non-industrial sites were driven by persistently low oil prices and
commercial/educational activities respectively
• Non-industrial sites are a smaller portion of BTF load and include centres such as Medicine Hat and University
of Alberta
30-day Rolling Average Change
10%
Change in Actuals vs Normal (%)
5%
0% AIL
System Load
-5%
BTF
-10%
* For context, system load is generally represented by residential, commercial and industrial without self-supply; whereas behind-the-fence (BTF) represents load that is served by on-
site generation, typically located at industrial sites
12Regional assessment shows how COVID-19 and oil
prices carry different impacts across Alberta
• AIL declines began with COVID-19, intensified with low oil prices
– From a regional perspective, AIL declines are driven mostly by loads in regions that are densely-
populated and/or with service-oriented commercial sectors (Calgary, Edmonton, Central and South;
chart on left)
– Northern regions had relative higher load up until mid-April; starting in May load from these regions
started trending downward, which coincides with increased uncertainty in oil markets (chart on
right)
30-day Rolling Average Change 30-day Rolling Average Change
10% 10%
Change in Actuals vs Normal (%)
Change in Actuals vs Normal (%)
5% 5%
0% 0%
AIL
-5% Calgary -5% AIL
-10% Central -10% Northeast
-15% Edmonton -15% Northwest
-20% South -20%
13Oil prices impacting key sub-regions the
most
• Energy sector is driving load declines, which is concentrated in eastern Alberta
– Northeast region* has declined by 8% compared to normalized load benchmarked to the reference
period, driven primarily by Fort McMurray (Area 25) which has declined by almost 15% (chart on
left)
• Load at oilsands sites are down due to a combination of seasonal outages and production reductions/shut-ins
• Offsetting the decline in the Northeast region is Fort Saskatchewan (Area 33) where load has increased at
some industrial sites
– Loads in Central East and South East sub-regions** have also registered significant declines; these
sub-regions have high industrial loads including pipelines, oil and gas drilling, and gas processing
facilities
30-day Rolling Average Change 30-day Rolling Average Change
10% 10%
Change in Actuals vs Normal (%)
Change in Actuals vs Normal (%)
5% 5%
0% 0%
-5% -5%
Northeast Central East
-10% -10%
Area 25 South East
-15% -15%
-20% -20%
* NE regions is composed of Areas 25, 27 and 33
** Central East is composed of Areas 13, 28, 32, 36, 37, 42 and 56; South East is composed of Areas 4, 43, 47, 48 and 52 14Load Forecast Scenarios
Exploring uncertainties through scenarios

•   Alberta’s economy and subsequent AIL growth will depend on post-pandemic recovery and
    the response to the volatility in oil markets
•   Given the uncertainty on the future impact of COVID-19 and oil prices on Alberta’s
    economy, a series of load scenarios are modelled to represent the potential load variances
     –   Forecasts of economic data from Conference Board of Canada and Canadian banks are used as
         inputs into the load forecast model
     –   These economic projections factor in the COVID-19 and oil price environments

•   Quick recovery back to 2019 levels is not an expectation for the Alberta economy
     –   Economic outlooks point to a decline in 2020 and modest growth in 2021
     –   Scenarios range from a ‘modest recovery’ by 2022 to a ‘slow recovery’ by 2023

•   Compared to the April reports, economic views have worsened
     –   Updated economic assumptions demonstrate a deterioration in expectations for Alberta
     –   Compared to 2019 Long Term Outlook (LTO), all the new economic scenarios result in lower
         projection for AIL
     –   It should be noted that the 2019 LTO weather profile is based on P90 whereas all the other
         scenarios shown in this analysis are based on P50 weather assumptions

                                                                                                      16
Scenarios summarized
• Lower load on average is expected in 2020 compared to 20191
– Between 273 and 353 MW reduction in load on average in 2020 compared to projections produced
prior to COVID-19 and low oil prices impacts (“March 2020 MTLF”)
– As economic outlooks worsen the energy outlook shows steeper decline
March 2020 Modest
Scenario LTO Low Growth2 Slow Recovery5
MTLF3 Recovery4
Year 2020 2021 2020 2021 2020 2021 2020 2021
Real GDP
1.1% 1.1% 2.4% 3.1% -6.8% 6.5% -11.2% 4.6%
Growth, %
Unemployment
~6% ~6% 7.8% 8% 10.8% 9.2% 11.0% 9.7%
Rate, %
AIL Growth,
1.7% 0.6% -0.1% 2.1% -3.0% 2.4% -3.8% 0.7%
YoY %
Average AIL,
9,863 9,927 9,681 9,885 9,408 9,632 9,328 9,391
MW
AIL Difference
from “March
+182 +42 - - -273 -253 -353 -494
2020 MTLF”,
MW
1 9,695 MW average load in 2019 4 Economic Data from May 2020 CBOC Outlook
2 AESO 2019 LTO Low Growth Scenario 5 Economic Data from May 2020 RBC Outlook
3 Economic Data from January 2020 CBOC Outlook
17Load forecast scenarios
• AIL forecast scenarios using updated economic outlook
– Compared to 2019 LTO*, all the new economic scenarios result in lower projection for AIL
AIL Scenario Comparison 2020-2021
12000
11000
10000 Actual
AIL (MW)
LTO Reference Case
9000 LTO Low Growth
March 2020 MTLF
8000 Modest Recovery
Slow Recovery
7000
Oct 2020
Apr 2020
Nov 2020
Dec 2020
Oct 2021
Nov 2021
Dec 2021
Aug 2020
Sep 2020
Apr 2021
Aug 2021
Sep 2021
Mar 2020
Mar 2021
Jan 2020
Feb 2020
Jun 2020
Jan 2021
Feb 2021
Jun 2021
Jul 2020
Jul 2021
May 2020
May 2021
The 2019 LTO weather profile uses the 90th percentile of the last 10 years of historical weather whereas all the other scenarios shown in this analysis are based
on 50th percentile weather assumptions 18Looking at a longer time horizon
• These load scenarios provide an analysis of the current 2-year AIL outlook
• Further analysis is required to determine whether there are permanent effects on energy
consumption due to the COVID-19 pandemic and the way Albertans respond to it
• Similarly, the impact of prolonged low oil prices can have disruptive consequences to the
energy sector and the Alberta economy as a whole, that will need to be assessed from a
load and co-generation perspective
• The AESO is assessing these trends and potential impacts in preparation for the next LTO
• We will continue monitoring and reporting on these developments as needed
• Questions or inquiries on the memo can be made at forecast@aeso.ca
19You can also read