11TH ANNUAL VITAMIN STUDY - JUNE 2018 - HUBSPOT
←
→
Page content transcription
If your browser does not render page correctly, please read the page content below
11th Annual Vitamin Study
         June 2018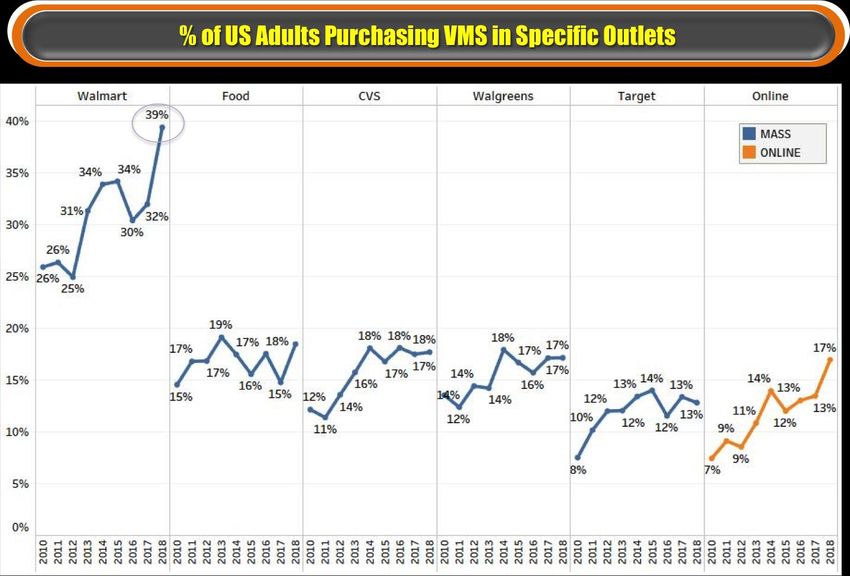
Executive Summary
In Spring 2018, TABS Analytics conducted a comprehensive survey to understand shopping
patterns for vitamins, minerals and nutritional supplements (VMS). This is an estimated $14
billion industry and TABS sought to examine trends regarding what types of vitamins and
nutritional supplements are purchased, how frequently they are purchased and the outlets
at which they are purchased.

Key Findings

   • VMS Sales Hit the Heights – This category continues to grow gradually, reaching its
     highest level in 2018. While heavy buyer (3+ types of products) purchasing remained
     stable, occasional buyers were responsible for the increases this year.

   • Adult Multivitamins and Vitamins B and D Soar, While Fish Oil and Calcium
     Continue Downward Slide – Driven by gummy and gender-specific product launches,
     adult multivitamins scored big gains. Once hot products, fish oil and calcium,
     continue dropping from past peaks.

   • Light Buyers Drive Sales Growth in Mass Market and Online; Specialty Outlets Drop
     – Buyers of only 1-2 types of VMS products were responsible for gains in both the
     mass market and eCommerce channels. Mirroring trends in other sectors, like baby
     and sporting goods, specialty outlets experienced lower penetration.

   • Walmart Dominates in Mass Market and Gains Online Share; Amazon Still Tops in
     eCommerce – Walmart is growing consistently in the VMS space, both in brick and
     mortar, and online. Amazon rebounded from a decline in 2017, and Puritan's Pride
     shows solid performance as the No. 3 eCommerce retailer.

                                                             11TH ANNUAL VITAMIN STUDY        1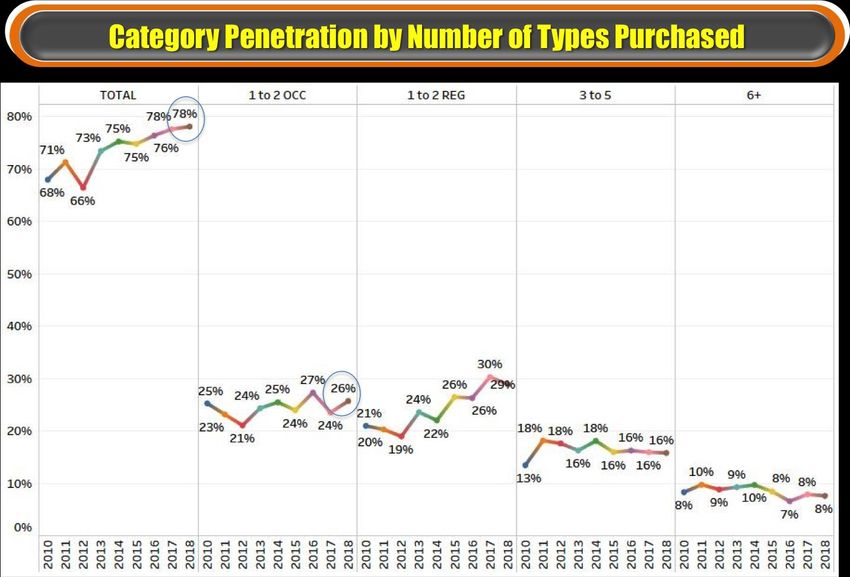
Methodology
TABS Analytics conducted a survey of 1,000 consumers via Caravan Panel, part of ORC
International. Consumers surveyed were geographically and demographically dispersed and
weighted by age and gender. This survey was first conducted in spring 2005 and was later
conducted in 2008, and has been done annually since 2010.

The goal of the survey is to discover:
   • How many types of vitamins and nutritional supplements were purchased?
   • What types were purchased and which were purchased regularly (3+ times per
      year)?
   • At which outlets were vitamins purchased and where are they purchased regularly?

VMS Survey Glossary
   •   Channel – The outlet in which a VMS product is sold.
   •   FDMCD – Food, drug, mass outlet, club and dollar stores.
   •   Mass Market – Same as FDMCD.
   •   Online – The online retailers selling VMS products. These include eCommerce pure
       play (those without a brick and mortar presence, such as Amazon) as well as the
       online extension of a brick and mortar retailer (Walmart.com, Target.com, etc.).
   •   Share – Defined as share of occasion, in the sense of how often consumers buy via a
       particular channel. This specifically does not mean market share or share of wallet. It
       is strictly a measure of frequency. There is a high correlation between share of
       occasion as identified by the panel and validated share of occasion in the market
       data, making this a highly reliable metric to use in calculating an additional metric,
       “share of outlet mentions.”
   •   Share of Mentions – Used as a proxy for “Share of Transactions.”
   •   Specialty – Nutritional specialty stores (such as GNC), natural food stores, catalog,
       multilevel marketing (MLM), practitioners, military and other.
   •   Type – A specific segment or form within the VMS category
   •   VMS – Vitamins, minerals and supplements, as defining the category

                                                                11TH ANNUAL VITAMIN STUDY 2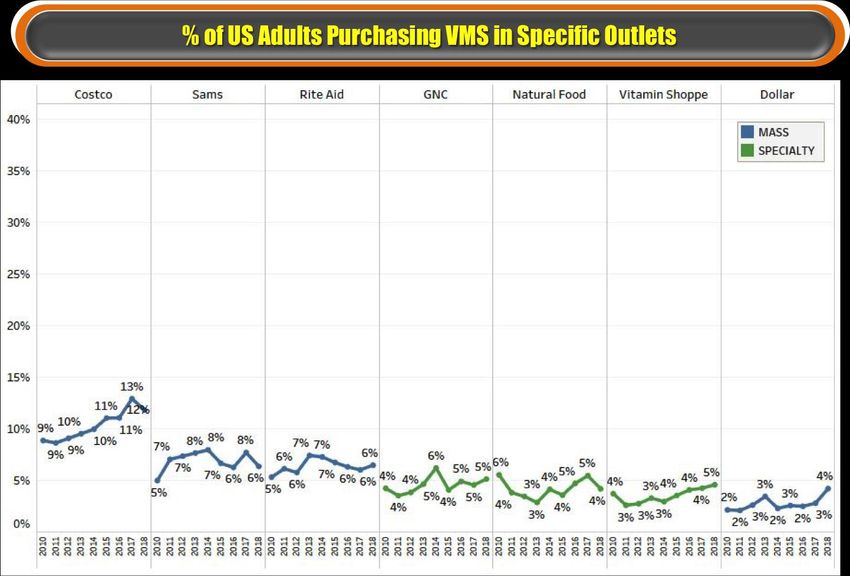
VMS Sales Hit the Heights
The vitamins, minerals and nutritional supplements category continues to grow gradually,
from a penetration low in 2012 of 66 percent to 78 percent in 2018 – its highest level in the
history of the TABS Analytics survey.

Purchasing by heavy buyer groups – those who buy three to five products, or more than 6
products, annually – was flat year-over-year, at 16 percent and 8 percent, respectively.

The growth in this category was largely attributable to an increase in occasional purchasers
from 24 percent in 2017 to 26 percent. Occasional purchasers are defined as those who buy
one to two products annually.

                                                               11TH ANNUAL VITAMIN STUDY        3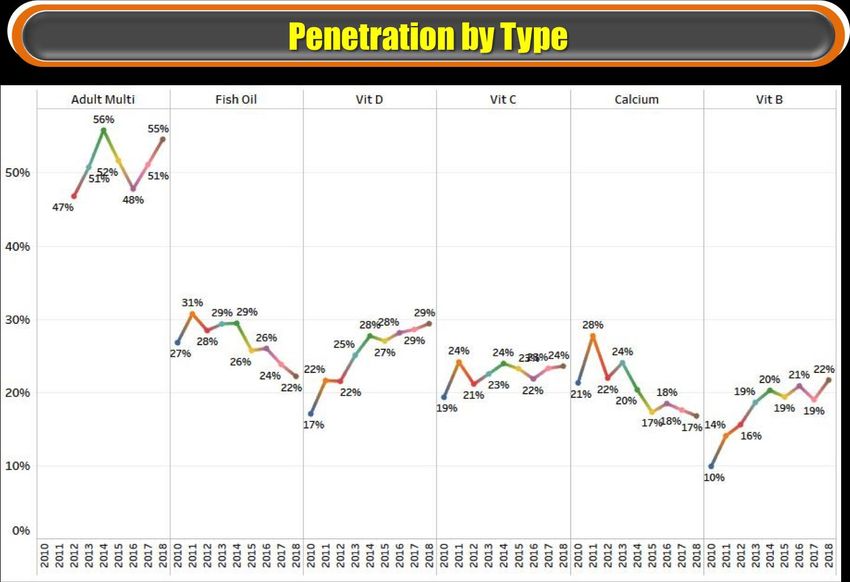
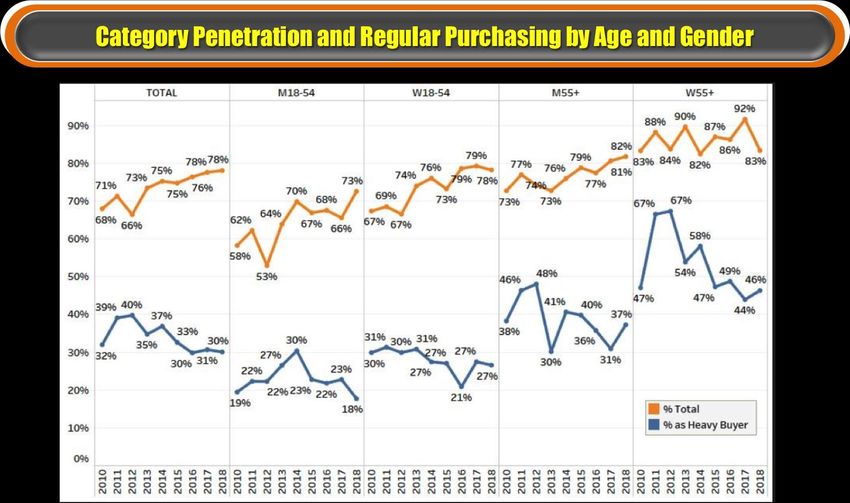
When breaking the VMS category down to examine penetration, we see that about 30
percent are considered heavy buyers (3+ product types) – which has remained stable over
the last three years.

Overall, looking at results by age and gender, we see that most groups have increased or
remained stable over time, except for women ages 55+. There was a significant dip in total
penetration among this group – down 9 points to 83 percent in just a year. Men – in both
the 18-54 and 55+ age ranges – have increased their total purchases of VMS products.
However, some of these gains were offset declines in purchasing by the heaviest buyers.

                                                             11TH ANNUAL VITAMIN STUDY 4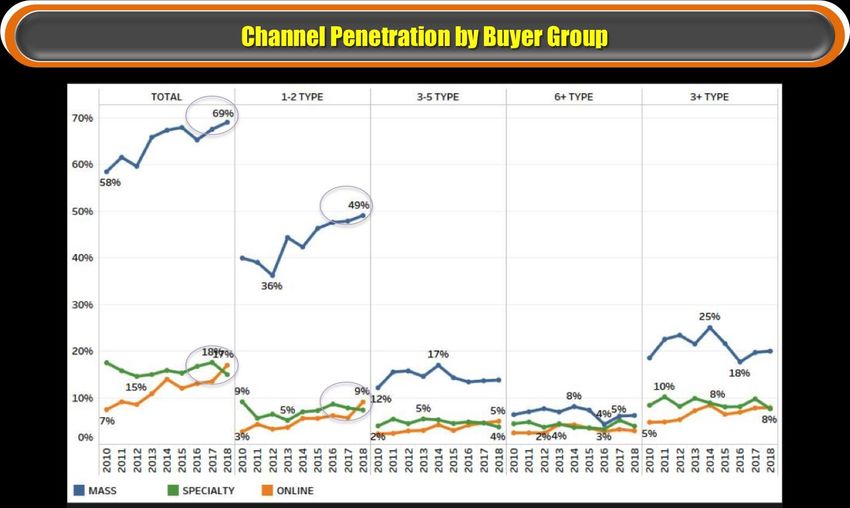
Adult Multivitamins and Vitamins B and D Soar, While Fish Oil and
Calcium Continue Downward Slide
Adult multivitamins is the largest type of VMS product purchased. In 2018, these products
experienced their second consecutive year of big gains, growing from 48 percent in 2016,
to 55 percent this year. Much of the gains are a result of the growing popularity of gummy
multivitamins and launches of new gender-specific products.

Other winners include Vitamin D and Vitamin B, which have shown a steady growth
trajectory over time and hit all-time highs at 29 percent and 22 percent, respectively.

Fish oil, which was once the second largest type of product purchases, has declined
considerably over the last seven years – from a high of 31 percent in 2011 to 22 percent
now. Calcium also has followed a similar path, reaching its highest point (28 percent) in
2011 and dropping to 17 percent by 2018, after seeming to stabilize in the previous two
years.

                                                               11TH ANNUAL VITAMIN STUDY     5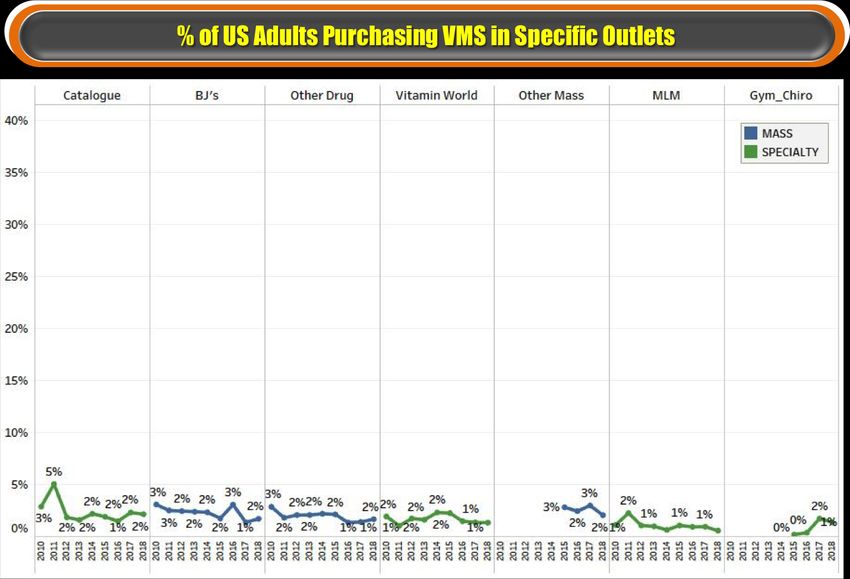
Looking at other products,
illustrated in the two charts at
the right, both probiotics and
child multivitamin sales have
leveled off at 13 percent and 10
percent, respectively. Earlier
growth of probiotics potentially
had more to do with the way the
survey question was worded,
making it clearer to consumers
which types of products
considered here. The child
multivitamin market grew early
on with the launch of gummy
products.

Joint relief experienced its
second straight year of decline.
At a high of 11 percent earlier in
the decade, it has dropped to
about 8 percent. While down
only 3 percentage points, this is
a significant change, since joint
relief products tend to be a high
dollar, high productivity
segment.

Melatonin continues to show
meaningful gains, steadily rising
from 4 percent to 9 percent.
What is interesting about
melatonin is that it exhibits high
SKU elasticity.

Hair/skin/nail multivitamins is a relative newcomer in this segment, and a solid contributor
with 10 percent, thanks to several new products and successful launches, as well as a focus
on a key ingredient: folic acid.

                                                              11TH ANNUAL VITAMIN STUDY 6
In examining specific product purchases by age and gender, TABS found that women's
purchasing levels (illustrated by the blue line in the chart below) exceed men across all
products, except calcium, Vitamin C and fish oil. Because of their breadth of purchasing,
women tend to be a more important target for marketers in this category.

Calcium usage by women 55+ has dropped considerably – from 63 percent at its height in
2011 to 34 percent in 2018. Younger men (18-54) have increased purchasing of calcium,
but not to the extent that it can bring calcium up to previous sales levels.

Typically VMS sales skew toward older consumers, but there are three categories that
seem to have a broader appeal to both younger men and women (ages 18-54):
hair/skin/nail, probiotics and melatonin. TABS sees a strategic value to bringing these types
of products into the mix, not just to increase age diversity, but also to address demand by
income and ethnicity.

                                                               11TH ANNUAL VITAMIN STUDY        7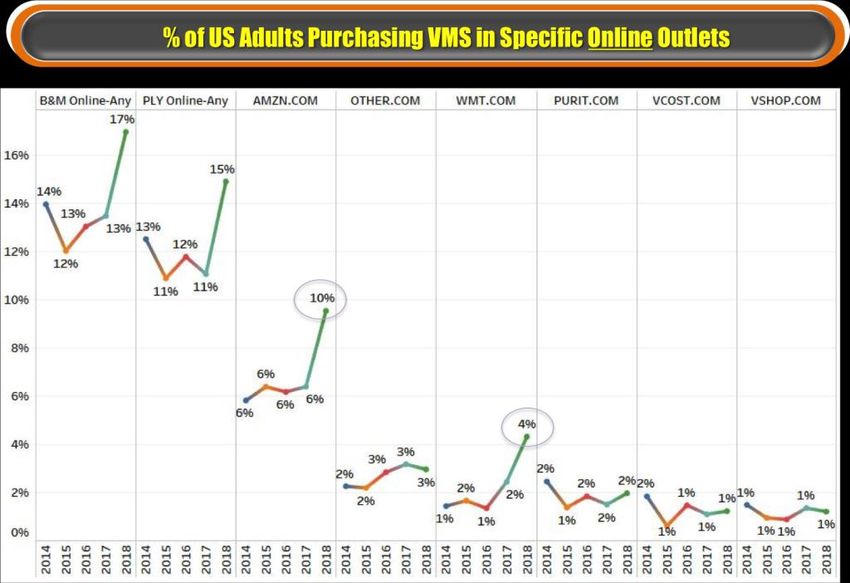
Light Buyers Drive Sales Growth in Mass Market and Online; Specialty
Outlets Drop
Mass market remains the strongest channel for VMS sales, and continues to grow, reaching
an all-time high of 69 percent in 2018. Online reached an historical high, as well, growing to
19 percent this year. These two channels were fueled by an increase in the number of light
buyers, who purchased one to two types of VMS products annually.

Mirroring trends in other segments – like baby, sporting goods and books – specialty
retailer sales were on the decline. It is clear that specialty channels are under duress and a
future uptick is unlikely.

                                                                11TH ANNUAL VITAMIN STUDY 8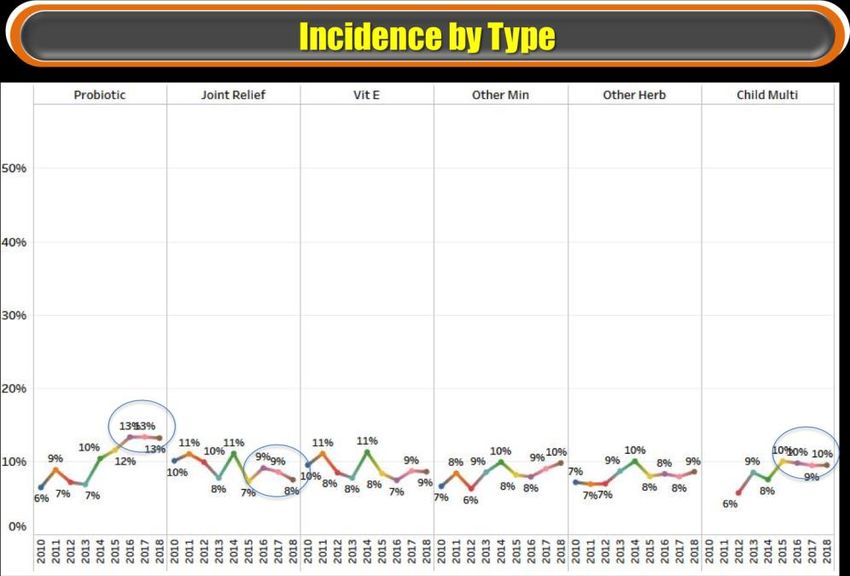
Walmart Dominates in Mass Market and Gains Online Share; Amazon
Still Tops in eCommerce
Walmart was the clear winner among brick and mortar outlets, growing from 32 percent in
2017 to 39 percent last year. Another mass market gainer was food stores, while outlets
like CVS, Target and Walgreens remained flat.

Among the smaller outlets experiencing gains were dollar stores. GNC and Vitamin Shoppe
held stable.

Big box stores Costco and Sams experienced declines in the number of VMS buyers, as did
natural food stores and smaller specialty outlets, like catalog, multilevel marketing and
Vitamin World. These small specialty outlets are bearing the brunt of the decline in the user
base, with catalog shifting to eCommerce.

                                                              11TH ANNUAL VITAMIN STUDY         9
11TH ANNUAL VITAMIN STUDY 10
Both Amazon and Walmart.com
saw big gains in reported
purchasing in 2018. Amazon
experienced a sharp uptick from
6 percent last year to 10 percent
now, while Walmart.com
doubled to 4 percent year-over-
year. The gains for both came
entirely from consumers who
said they purchased from these
eCommerce outlets just 1 or 2
times. Regular purchasing
actually dipped slightly for both
domains.

Compared to the two leaders, no
other platform pulls in more than
2 percent of VMS purchases,
although GNC.com, Ebay and
Target.com all saw meaningful
gains. Previously Target.com had
skewed more toward younger
shoppers – not the key
demographic in VMS sales – but
now with growth in some
products squarely aimed at this
market and consumers’ desire
for a one-stop shop, Target.com
could potentially benefit.

                                    11TH ANNUAL VITAMIN STUDY   11
The share of mentions chart below illustrates that mass market was the big winner in 2018,
fueled by gains from Walmart, food and Walgreens.
While online sales grew, share dropped slightly as there was no growth in regular
purchasing at the top two eCommerce retailers: Amazon and Walmart.com
Specialty outlets declined sharply, with secondary outlets feeling the biggest impact.
Additionally, this was the second straight year that CVS lost share.
11TH ANNUAL VITAMIN STUDY 12Amazon rebounded strongly in 2018 after flat purchasing and share declines in 2018, as
seen in the chart below. Walmart continues a steady rise in eCommerce, concurrent with
its gains in the brick and mortar sales.
Puritan's Pride, which got its start through catalogs, is emerging as the No. 3 eCommerce
retailer, which is impressive considering other catalog-related VMS products have struggled
to move their customers over to eCommerce.
11TH ANNUAL VITAMIN STUDY 132018 and Beyond
Going forward, TABS’ analysis of macro factors suggests that the trend of growth in the
mass market and eCommerce will continue, at the expense of specialty retailers.
Projections for 2019-2021 suggest growth of 4 percent to 5 percent, but it could be higher
depending on inflationary pressures.
11TH ANNUAL VITAMIN STUDY 14Conclusions
• VMS sales continued healthy gains, which were first seen in last year’s study.
• Gains were fueled by significant growth in light buyers (1-2 types of products),
continuing a long-term trend in this category.
o There was also evidence that Heavy Buyers were buying more Types and
purchasing at more outlets.
• All age/gender groups – except for women ages 55+ – saw increased penetration.
o The percent of heavy buyers (3+ types of products) has declined significantly,
but has been somewhat offset by growth in the number of occasional
purchasers.
• Adult multivitamins – the most popular product – had a second year of major gains
going from 51 percent to 55 percent of adults, thanks to in-market gains in gender-
specific multivitamins and gummies.
• Vitamin B and D are two major products with strong long-term growth potential.
Penetration increased for both in 2018.
• Hair/skin/nail multivitamins are emerging as a significant presence in VMS.
Purchasing increased to 10 percent, from 8 percent in 2017, with particularly strong
gains among younger women (ages 18-54).
• Calcium and fish oil are seeing fairly dramatic long-term declines, as older women
(55+) abandon these products in larger numbers. Penetration has declined more
than 40 percent for each among that group.
o Gains from younger men (ages 18-54) partially offset the decline in calcium;
but penetration is still only at 11 percent among this group, which is 35
percent below national average.
• ECommerce saw dramatic growth behind gains from both Amazon and Walmart,
driven by occasional shoppers. Regular purchasing from those sites were flat.
o Puritan’s Pride picked up online share and is a solid No. 3 player.
11TH ANNUAL VITAMIN STUDY 15• Mass market also saw gains as there was an uptick in the number of light VMS buyers
shopping in the channel.
o Share Winners: Walmart, Food, Walgreens
o Share Losers: CVS (2nd straight year), Costco, Sam’s, GNC, and specialty
outlets, in general, which are under siege industrywide.
• Growth in both Mass Market and eCommerce show that it’s not an “either, or”
situation.
o ECommerce growth can be largely incremental.
o Walmart posted strong gains in both channels.
o Mass market gains were fairly widespread, not just centered around Walmart.
• Nutritional specialty retailers need to consider if their strategy is viable.
o Assortment and merchandising geared towards heavy buyers only; light buyers
are priced out of the market.
o Loyalty offers exclude marginal customers.
o Most brands carried have very low awareness.
o Overdevelopment of PVL not working.
o Specialty retailers are bearing most of the brunt of eCommerce growth.
TABS Syndicated Survey Tracker Service
In addition to our annual VMS survey, TABS offers a Syndicated Category Survey Tracker
covering VMS and Sports Nutrition. Available via online access, the tracker monitors 30
brands in vitamins and sports nutrition, including segment and type tracking, as well as
outlets where purchased. The Quarterly Nutritional Tracker also include some consulting
support.
The Experts in Consumer Analytics®
Tabs Analytics, founded by Dr. Kurt Jetta in 1998, is a technology-enabled analytics firm
servicing the consumer products industry. Our mission is to simplify and improve the way
analytics is conducted through analytical innovation, which translates into a competitive
advantage for our clients. TABS is the leading outsourced sales and marketing analytics firm
in the consumer-packaged goods (CPG) industry.
For more information about TABS Analytics services or this white paper, please contact
Robert Baldwin at robertbaldwin@tabsanaltyics.com or (203) 446-8837.
11TH ANNUAL VITAMIN STUDY 16You can also read


