FY17 Results Presentation - September 2017 - Kathmandu Holdings
←
→
Page content transcription
If your browser does not render page correctly, please read the page content below

FY17 Results Presentation
                 September 2017
Financial highlights
Sales Same Store Sales
AU 6.9%
$445.3m 4.6% +5.5% NZ 3.6%
EBIT Net Profit After Tax
$57.0m 12.0% $38.0m 13.5%
Dividend Net Debt
13cps 18.2% $6.9m $29.9m
2
Contents   1. Strategy update
           2. Result overview
           3. Key line items
           4. Segment results
           5. Cash Flow, Balance Sheet, Dividend
           6. Summary
           7. Questions
           A. Appendices

                                                   3
1. Strategy update

                     4
1. Strategy update

        “Design great, innovative, distinctive
         and sustainable quality products”

              “Be customer-centric in
                everything we do”

                                   GROWTH STRATEGIES
                Continuous improvement           Growth initiatives
                » Brand and customer             » International
                » Store optimisation             » Marketplaces
                » Pricing and promotion          » Store network expansion
                » Omni-channel
                » Cost efficiency

                                                                             5
1. Strategy update – continuous improvement

                                             Initiatives                                            Progress update

                 » Elevate brand distinctiveness through product design and » Our innovative travel design focus is highlighted
                   innovation                                                 by products such as the Benmore 5-in-1 travel
                 » Focus on our expertise in adventure travel                 jacket and Transfer pack
   Brand and                                                                » Summit Club 1.7m active members (+8.2% year
                 » Inspire our customers and engage with our Summit Club
   customer                                                                   on year), 1.1m active Australian members
                   members with a focus on social media and digital
                 »   Enhance the customer service experience and staff            » 30% increase in social media reach year on year
                     product knowledge                                            » Net promoter score >75%

                 »   Focus on same store sales growth                             » Strong same store sales growth in both Australia
                 »   Optimise space allocation to maximise gross profit             +6.9% and New Zealand +3.6%
                 »   Improve customer conversion rates in-store                   » Store VM and product ranging trials conducted in
      Store                                                                         FY16 and executed successfully in FY17
  optimisation   »   Refine visual merchandising and product presentation
                                                                                  » FY17: 4 relocations, 4 refurbishments, 2
                 »   Invest in relocations / refurbishments that deliver return
                                                                                    expansions completed
                     on capital
                                                                                  » FY18: 5 relocations, c.15 refurbishments scheduled

                 »   Continually refine the structure of promotions to:           » Maintain key competitive price points on footfall
  Pricing and                                                                       driving products
                        »   leverage foot traffic in key trading periods
  promotion
                        »   increase basket size and maximise gross profit        » Average basket size increase of 4.7% in FY17

                                                                                                                                   6
1. Strategy update – continuous improvement

                                           Initiatives                                             Progress update

                »   Provide a channel agnostic offer: one range available to     » Responsive website launched in November 2016
                    all customers wherever they choose to shop                   » Online sales are 7.5% of total sales
                »   Invest in our online platform to further improve usability   » Digital marketing cloud tools deployed 1H FY17
                    and functionality                                              providing targeted email capability
 Omni-channel   »   Offer complementary products and services through our        » 67% increase in website traffic originating from
                    online channels                                                social media with corresponding increase in
                »   Drive site visitation through:                                 associated purchase conversion
                       » targeted Summit Club campaigns
                       » affiliate partnering
                       » social media

                »   Drive supply chain efficiency through infrastructure         » Australian distribution centre investment
                    investments and automation                                     completed, efficiency benefits to be realised from
                »   Increase productivity by leveraging rostering systems          FY18 onwards
      Cost
                    investment                                                   » Continue to drive productivity through foot
   efficiency
                »   Leverage advertising content, particularly in social and       traffic and conversion KPI’s
                    digital media channels                                       » Constant innovation with social media partners
                                                                                   to maximise return on digital advertising spend

                                                                                                                                 7
1. Strategy update – growth

                                            Initiatives                                         Progress update

                                                                              » Kathmandu products now selling through
                  » Identify and promote brand and product distinctive
                                                                                SportScheck and Go Outdoors. Opportunity to
                    attributes that make Kathmandu relevant internationally
                                                                                expand our range for future seasons
                  » Leverage our brand equity and online platform to expand
  International                                                               » Direct to consumer international responsive
                    internationally using a capital light model
                                                                                website launched
                  » Entry strategies for key growth markets include online,
                                                                                 » Exhibited at European trade shows to showcase
                    wholesale distribution, licensed or franchised retail stores
                                                                                   the Kathmandu brand and distinctive products

                  »   Sell through additional open marketplace sites where    » Marketplace sales grew by 50% year on year
                      strategically relevant                                  » Tmall Global targeted at Mainland China
  Marketplaces                                                                  commencing 1H FY18
                                                                              » Increased collaboration with marketplaces on
                                                                                marketing programmes

                  »   Store footprint expansion where return on investment    » Four new stores opened during FY17
 Store network        justifies
   expansion
                  »   Store network target of 180 across Australasia

                                                                                                                              8
1. Sustainability

 Our goal:
 Australasian
 industry
 leadership in
 sustainability

For more information:
Kathmandu’s 2017 Sustainability Report
released mid-October
                                         9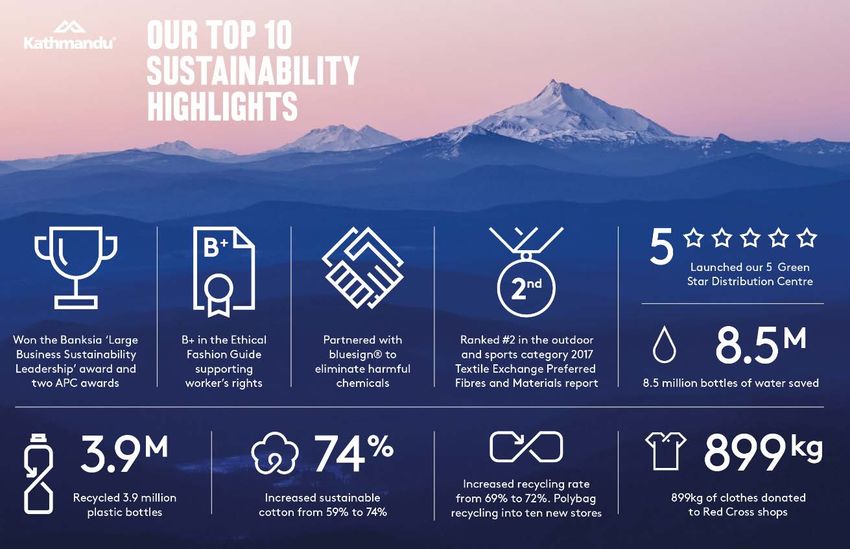
2. Result overview

                     10
2. Result overview: Year-on-Year
NZD $m*1 FY17 FY16 Var $ Var %
SALES 445.3 425.6 19.7 4.6%
GROSS PROFIT 276.2 266.4 9.8 3.7%
Gross margin 62.0% 62.6%
OPERATING EXPENSES (205.4) (201.6) 3.8 1.9%
% of Sales 46.1% 47.4%
EBITDA 70.8 64.8 6.0 9.3%
EBITDA margin % 15.9% 15.2%
EBIT*2 57.0 50.9 6.1 12.0%
EBIT margin % 12.8% 12.0%
NPAT 38.0 33.5 4.5 13.5%
Store count*3 164 162 2
1. FY17 NZD/AUD conversion rate 0.947 (FY16: 0.934), FY17 NZD/GBP conversion rate 0.563 (FY16: 0.457)
2. EBIT YOY adverse exchange rate translation impact in FY17: -$0.6m (FY16 -$1.0m)
3. Four new stores opened during FY17, and three stores closed. One temporary store still open at balance date and closed in August. Excludes Online stores
4. Rounding differences may arise in totals, both $ and %
113. Key line items
123. Sales
SALES: +4.6% to $445.3m Group Sales (NZD $m)
» Sales growth year on year:*1
$445.3
AU 7.9%, NZ 3.3% $384.0 $392.9 $409.4 $425.6
» At constant exchange rates sales growth
$24.5m / 5.8%
» Online sales are 7.5% of total sales
FY13 FY14 FY15 FY16 FY17
Australia (AUD $m) New Zealand (NZD $m)
$280.7
$242.1 $260.1
$227.8
$198.4
$137.0 $141.0 $139.1 $141.7 $146.4
FY13 FY14 FY15 FY16 FY17 FY13 FY14 FY15 FY16 FY17
1. Calculated on local currency sales results (not affected by year-on-year exchange rate variation)
2. Country sales totals exclude inter-company sales
133. Australasian sales growth – constant currency
» Core business (AU/NZ) constant currency sales growth +6.4%
Australia and New Zealand Sales (NZD $m)
$5.3
$21.5
$4.1
$446.9 $442.8
$420.1
FY16 Retail Online FY17 Exchange FY17
AU/NZ Stores AU/NZ Rate AU/NZ
Sales Sales NZD:AUD Sales
(constant
currency)
1. Rounding differences may arise in totals, both $ and %
143. Same Store Sales result
Australia New Zealand
SAME STORE SALES: +5.5% at constant rates Australia New Zealand
6.7% 6.9% 6.9%
» Same store sales:
4.4% 3.6%
+4.4% actual exchange rates 2.6%
+5.5% constant exchange rates:
» Stores +4.7%
-0.1% -0.1%
» Online +15.9% -1.1%
-2.7%
FY13 FY14 FY15 FY16 FY17
GROUP
Group: -actual
Actualrates
Rates GROUP
Group:- constant
Constantrates
Rates
5.6% 5.5%
4.4% 4.2%
1.8% 1.6%
0.4%
-1.4%
-1.9%
-2.7%
FY13 FY14 FY15 FY16 FY17
1. Measurement period FY17: 52 weeks ended 30 July 2017 compared to 52 weeks ended 31 July 2016
2. Same store sales measurement includes Online and all stores from their 53rd week of trading
153. Gross Margin
AU NZ GROUP
AU NZ GROUP
66.3% 66.3%
63.4% 64.1% 64.1% 63.0% 63.1% 62.6%
61.5% 62.0%
60.1%
57.7% 58.2% 58.5% 57.9%
FY13 FY14 FY15 FY16 FY17
SHARE OF BUSINESS
(GROSS PROFIT $)
» Gross margin long-term target range 61% to 63%
INTERNATIONAL 0.5%
» Sourcing negotiations, product newness, price action and
improved stock control all helped to offset the gross margin NZ 30.7%
challenges caused by:
» higher input costs as a result of foreign currency
» clearance sales mix slightly higher than last year
AU 68.8%
163. Cost of doing business
OPERATING EXPENSES: +1.9% to $205.4m NZD $m FY17 FY16 Var $ Var %
» Rent increase includes transition to new Rent 62.2 58.3 3.9 6.7%
Australian distribution centre and full year % of Sales 14.0% 13.7%
impact of New Zealand support office
Other operating expenses 143.2 143.3 (0.1) (0.1%)
» Efficiencies gained through: % of Sales 32.1% 33.7%
» Targeted promotional spend
» Retail labour productivity
Total operating expenses*1,2 205.4 201.6 3.8 1.9%
» Full year impact of FY16 structural review
% of Sales 46.1% 47.4%
Depreciation 13.8 13.9 (0.1) (0.7%)
% of Sales 3.1% 3.3%
Cost of doing business 219.2 215.5 3.7 1.7%
% of Sales 49.2% 50.6%
1. FY17 total operating expense decrease attributable to year-on-year exchange rate translation movement $2.3m
2. FY16 total operating expenses included $2.0m non-recurring items: Australian distribution centre and closure of UK stores
3. Rounding differences may arise in totals, both $ and %
173. Earnings summary
EBITDA $70.8m EBIT*1 $57.0m NPAT $38.0m
+9.3% +12.0% +13.5%
74.0 74.5 70.8
64.8 63.4 64.3
57.0
47.1 50.9
44.2 42.2 38.0
33.2 33.5
20.4
FY13 FY14 FY15 FY16 FY17 FY13 FY14 FY15 FY16 FY17 FY13 FY14 FY15 FY16 FY17
EBITDA % EBIT % NPAT %
19.3% 19.0% 11.5% 15.2% 15.9% 16.5% 16.4% 8.1% 12.0% 12.8% 11.5% 10.7% 5.0% 7.9% 8.5%
1. EBIT YOY adverse exchange rate translation impact in FY17: -$0.6m (FY16: -$1.0m)
184. Segment results
194. Australia
SALES: +7.9% to $280.7m AUD $m FY17 FY16 Var %
» Gross margin level year-on-year Sales 280.7 260.1 7.9%
» Total operating expenses (incl. depreciation): Same store sales growth 6.9% 2.6%
» FY17 53.1% of sales
» FY16 54.4% of sales
EBIT (trading result)*2 30.8 25.1 22.7%
» 4 new stores, plus one relocated store still
open at balance date and closed in August EBIT margin % 11.0% 9.7%
» 3 stores closed as new stores opened in
better locations Store count 116 114
» 4 relocated stores
EBIT (trading result) AUD $m
» 3 refurbished stores
35.8
30.8 30.8
25.1
14.6
FY13 FY14 FY15 FY16 FY17
1. Rounding differences may arise in totals, both $ and %
2. A reconciliation of EBIT (trading result) to the financial statements is included in Appendix 2
204. New Zealand
SALES: +3.3% to $146.4m NZD $m FY17 FY16 Var %
Sales 146.4 141.7 3.3%
» Gross margin decreased 220bps / 2.2% of
sales Same store sales growth 3.6% (0.1%)
» Total operating expenses (incl. depreciation): EBIT (trading result)*2 28.9 27.4 5.5%
» FY17 38.2% of sales
» FY16 40.8% of sales EBIT margin % 19.7% 19.3%
» 3 refurbished stores
Store count 47 47
EBIT (trading result) NZD $m
30.3 30.3 28.9
27.4
21.5
FY13 FY14 FY15 FY16 FY17
1. Rounding differences may arise in totals, both $ and %
2. A reconciliation of EBIT (trading result) to the financial statements is included in Appendix 2
214. International
SALES: -53.6% to NZD $2.5m NZD $m FY17 FY16 Var %
» Cycling the closure of three UK stores during Sales 2.5 5.5 (53.6%)
FY16, one UK store still to be closed
Same store sales growth (32.7%) 3.7%
» Gross margin improved 650bps / 6.5% of
EBIT (trading result)*2 (0.7) (0.8) 5.2%
due to promotional changes and cycling
prior year store closure clearance sales
EBIT margin % (28.1%) (13.8%)
» Total operating expenses (incl. depreciation,
excl. wholesale start-up): Store count 1 1
» FY17 66.6% of sales
» FY16 64.7% of sales EBIT (trading result) NZD $m
» International wholesale start-up and FY13 FY14 FY15 FY16 FY17
promotion costs NZD $0.5m incurred in FY17
ahead of wholesale sales starting FY18
-0.8 -0.7
-2.5
-2.8
-3.2
1. Rounding differences may arise in totals, both $ and %
2. A reconciliation of EBIT (trading result) to the financial statements is included in Appendix 2
225. Cash Flow, Balance Sheet, Dividend
235. Cash Flow
Operating cash flow: Cash Flow (NZD $m) FY17 FY16
» Strong operating cash flow generated
through improved profitability and NPAT 38.0 33.5
continued inventory reduction Change in working capital 12.9 20.5
Capital expenditure $13.3m (LY $23.2m): Change in non-cash items 16.4 15.1
» Stores $9.5m (LY $8.0m) Operating cash flow 67.3 69.1
» 4 new stores
» 4 relocations
Key Line items:
» 6 refurbishments
Net interest paid (including facility
(2.1) (2.8)
» Infrastructure $2.2m (LY $13.1m) fees)
» Australian distribution centre
completed Income taxes paid (14.6) (15.3)
» Systems $1.6m (LY $2.1m) Capital expenditure (13.3) (23.2)
» Online enhancements including
responsive website design and launch Dividends paid (24.2) (16.1)
of international trading site
» Product lifecycle management Increase/(Decrease) in borrowings (33.2) (24.6)
1. Rounding differences may arise in totals, both $ and %
245. Balance Sheet
Stock Per Store (NZD $m)*1 Balance Sheet (NZD $m) FY17 FY16
Inventories 89.2 95.4
$0.692 $0.708
$0.584 $0.589 Property, plant and equipment 61.0 61.6
$0.544
Intangible assets 279.0 280.1
Other assets 6.3 5.1
Total assets (excl. cash) 435.5 442.2
FY13 FY14 FY15 FY16 FY17 Net interest bearing liabilities and cash 6.9 36.8
Other non-current liabilities 34.3 33.9
» Year on year decrease in stock per store -7.6% Current liabilities 67.2 59.8
» Ongoing working capital efficiency Total liabilities (net of cash) 108.4 130.5
contributing to record low net debt and lower Net assets 327.1 311.7
financing costs
Key Ratios FY17 FY16
Stock Turns*2 1.83x 1.53x
Net Debt to Equity 2.1% 10.6%
1. FY17 includes one temporary store open at balance date
2. COGS (rolling 12 months) / Average Inventories YOY Fixed Charge Cover*3 2.07x 2.01x
3. (EBITDA + Rent)/(Rent+ Net Finance Costs excl. FX)
4. EBIT/(Net Debt + Equity)
5. Rounding differences may arise in totals, both $ and %
ROIC*4 17.1% 14.6%
255. Dividend
» NZ 9.0 cents per share final dividend;
Dividends (NZ cents per share)
» Record high full year payout NZ 13.0 cps (FY16 NZ 11.0 cps)
13
12 12
» Dividend will be fully imputed for New Zealand 11
shareholders
8
9
» Dividend will be fully franked for Australian shareholders 9 9 8
5
» Supplementary dividend of NZ 1.588 cents is payable to
non-NZ shareholders 3 3 3 3 4
» Record date 13 November 2017 FY13 FY14 FY15 FY16 FY17
Interim Final
» Payment date 24 November 2017
265. Foreign currency
FORWARD HEDGING POSITION FY16 FY17 FY18
AUD/USD Effective Rate 0.796 0.728 0.756
NZD/USD Effective Rate 0.732 0.659 0.707
» FY17 USD hedging rates c.9% below FY16
» FY18 USD hedging rates c.5% above FY17
» Forward hedging position:
» Longest dated hedges September 2018
» Rolling cover applied 12 months forward
» No hedging NZD/AUD » 1H FY17 -15% » 2H FY17 -4%
276. Summary
286. Summary
» Outdoor category competitor mix constantly changing and remains competitive
» Sustainability and commitment to ethical business an emerging competitive advantage
» Kathmandu is a strong brand that designs great, innovative, distinctive and sustainable quality products
» We remain committed to continuous improvement with key focuses on:
» same store sales growth, particularly in Australia
» strengthening the Kathmandu brand and customer engagement
» connecting with customers through social media and digital channels
» cost control and efficiencies
» International (northern hemisphere) wholesale business will continue to be developed with a focus on
profitability. Autumn/Winter orders shipped to European customers, initial Spring/Summer 18 orders received
297. Questions
30Appendix 1 – Historical store count
Australia and New Zealand Stores
161 163
156
145
131
114
104
91
FY10 FY11 FY12 FY13 FY14 FY15 FY16 FY17
1. Four new stores opened during FY17, and three stores closed. One temporary store still open at balance date and closed in August. Excludes Online stores
31Appendix 2 – Reconciliation of segment EBIT trading results
FY17 ($’000) Australia New Zealand International Other Total
EBIT per financial statements (NZD) 31,534 29,962 (716) (3,776) 57,004
Internal charges not trading related*1 (NZD) 1,040 (1,040) - - -
EBIT (trading result) (NZD) 32,574 28,922 (716) (3,776) 57,004
EBIT (trading result) (local currency) 30,848
FY16 ($’000) Australia New Zealand International Other Total
EBIT per financial statements (NZD) 25,747 28,553 (755) (2,664) 50,881
Internal charges not trading related*1 (NZD) 1,123 (1,123) - - -
EBIT (trading result) (NZD) 26,870 27,430 (755) (2,664) 50,881
EBIT (trading result) (local currency) 25,097
1. Internal charges not trading related include arm’s length margins charged for internal services
32You can also read