COMING UP Key Financials for the Q3 2020 Friday, November 13, 2020 at 10:00 a.m. (CET) Dr Thomas Kneip, Member of the Board - CENTROTEC SE
←
→
Page content transcription
If your browser does not render page correctly, please read the page content below
COMING UP…

Key Financials for the Q3 2020

Friday, November 13, 2020
at 10:00 a.m. (CET)

                                 presented by

                                 Dr Thomas Kneip,
                                 Member of the Board
CENTROTEC SE
Q3 results 2020

13.11.2020
AGENDA

         !   Market Overview & Key Financials
         !   Operational Highlights
         !   Outlook
German heating market demonstrates stable growth in the third quarter
  MARKET DEVELOPMENT

Quarterly market growth rate of oil and gas heat generating units in Germany                                     Market Impact of
[in percent compared to same quarter of previous year]
                                                                                                                 Corona Pandemia
                     8                                                                                           • Stable growth in Q3 in
                                                                                                                   Germany
                                                                                          6
                                    6                                                                            • Heavy impact on sales in
                                                                     Annual
                                                                   growth rate                                     many Southern and Western
                                                                    plus 2%                                        European markets
    3                                               3
                                                                                  3                       2
                                                                                                  2              • Recovery in China

                                                            0                                                    • Signs of project delays and
                                                                                                                   more intense competition in
                                                                        0                                          the AHU market
                          Annual
                        growth rate
                         plus 3%

                                            -5
  Q1/18           Q2/18            Q3/18   Q4/18   Q1/19   Q2/19      Q3/19      Q4/19   Q1/20   Q2/20   Q3/20

                                                                                                                                            4
  Source: BDH monthly statistics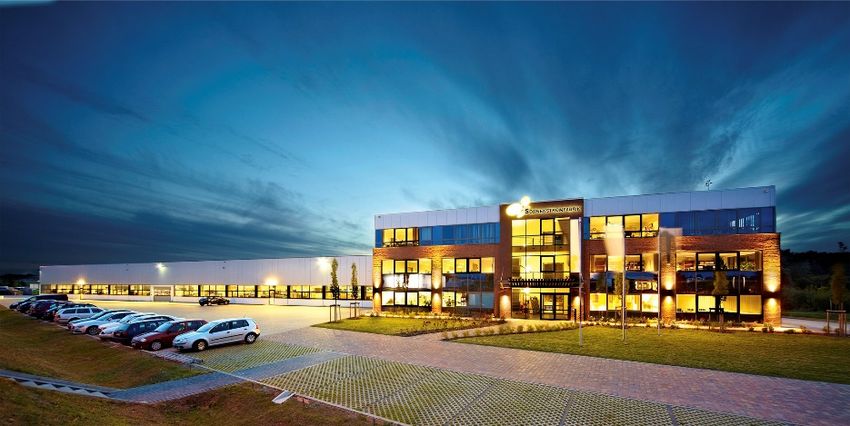
Sales growth in core segments; Corona crisis with a limited and regional impact
REVENUE DEVELOPMENT

By Segment                                                       Drivers of Revenue Development
in EUR million                                                   + Continued groupwide growth in Germany and NL
                                      +4.9%
                                              179.7              + Climate Systems with positive development in the
                           171.4
    Med. Tech. &                              13.3     -4.7%       heat pump, domestic heating and ventilation market
                           13.9
     Eng. Plastics                                               + Acquisition of IVT in the middle of 2019 leads to non-
                                              39.7     +11.1%
Gas Flue Systems            35.7                                   organic growth in Gas Flue Systems sales in H1/20
                                                                 o CHP business stabilized, but on low level
                                                                 o Gas Flue Systems again with stable growth
                                                                 -    China with a very weak first quarter and slow
                                                                      recovery until now due to corona issue
 Climate Systems           121.7              126.8    +4.2%     -    Impact of corona crisis in several markets (Southern
                                                                      Europe, UK) since March

                                                                     Drivers of Regional Sales
                                                                 + Good development in Germany, Netherlands, Poland
                                                                 - Weak development in Italy, France, UK, Croatia and
                           Q3 19              Q3 20
                                                                   China
YtD Q3*                                                          - Share of international sales YTD down to 44% (PY 47%)
                           471.1               502.1     +6.6%
in EUR million
                                                                                                                         5
* Organic Growth Rate: YtD Q3: 6.0%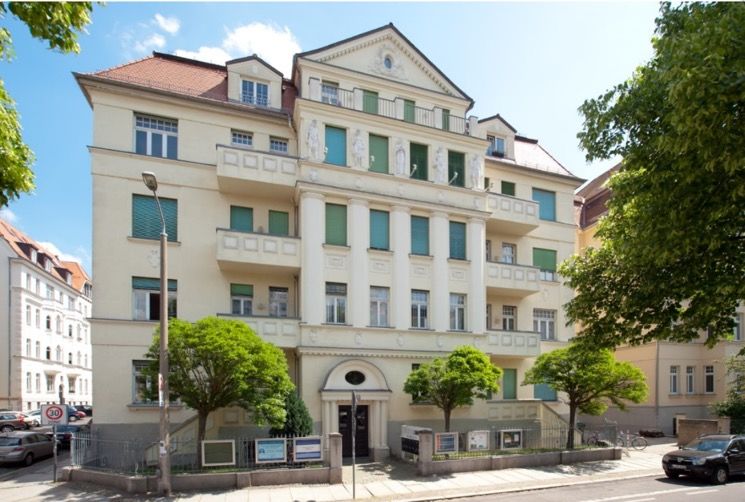
Strong revenue growth in core segments drives earnings increase in the third quarter
 EBIT DEVELOPMENT

                                                            Drivers of EBIT Development
by Segment                  13%
[in EUR million]                  15.8
                                                            Climate Systems
                                   0.4       -63%
                    14.0                                    + Scale effects from sales growth
   Med. Tech. &                                             + Successful implementation of profitability improvement
                     1.1
    Eng. Plastics                  5.3       +53%             project in Air Handling Units
Gas Flue Systems     3.5                                    + Lower expenses for marketing, trade fairs, travelling costs
                                                              etc. due to corona restrictions
                                                            -   Negative contribution from some foreign group companies
                                                                due to corona crisis

                                                            Gas Flue Systems
                                  10.2        +8%
 Climate Systems     9.4                                    + Further sales growth in the 3rd quarter lead to scale effects
                                                            + Strong German market, good Dutch market
                                                            - Weak development in many foreign markets since March

                                                            Med. Tech. & Eng. Plastics
                    Q3 19         Q3 20
                                                            + Sales growth in medical technologies
YtD Q3              22.1          32.6       +48%           - Engineering Plastics cyclical business is impacted by
in EUR million                                                economic slow-down and Corona-crisis                6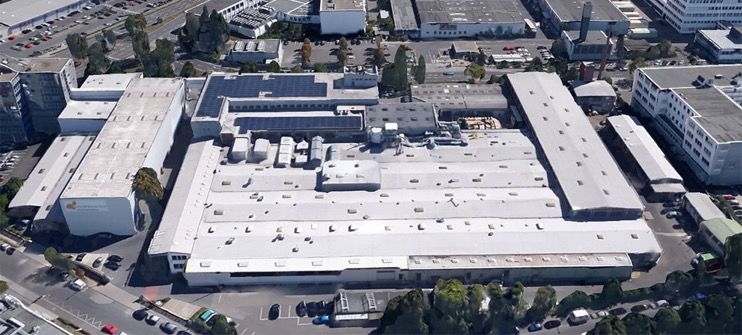
Q3-EAT with several positive effects; YTD EAT still burdened by negative financial result
EAT TRANSITION Q3 2019 VS. Q3 2020

                 [in EUR million]
                                                             Comments

    EAT Q3 2019                          9.9

       Δ EBITDA                          1.6                 • Improved operating result

                                                             • Depreciations slightly reduced due to one-off effect
   Δ Depreciation                              0.2             last year

Δ Financial Result                              0.6          • Positive result in Q3/2020 due to better interest
                                                               result and recovery in other financial result;
                                                             • Tax reduction due to a one-off effect in a Dutch
            Δ Tax                                0.3           subsidiary

                                                             • YTD EAT 2020 at 19,1 Mio. EUR (vs. 16,9 Mio.
    EAT Q3 2020                                       12.7
                                                               EUR in 2019)

                                                                                                                      7
Overall stable key balance sheet ratios; stable positive trend in operating cash flow. PARI
        acquisition not yet reflected in the balance sheet ratios.
        KEY BALANCE SHEET AND CASH FLOW RATIOS

        Net Financial Position / Equity                                                                   Equity Ratio
        0.05
                0.01                                                                                      [percent]
                                                                                                                 44.4    43.9
                                                                                                         41.7                                    42.2
                                                                                                                                 39.3    40.5            39.9                   39.1
-0.03                                                                                                                                                            38.8                  39.0
                                                                                                                                                                         36.1                 37.1       36.6
                                       -0.09
                               -0.14
                       -0.16

                                               -0.23
                                                       -0.28           -0.29
                                                                                       -0.32
                                                                               -0.36
                                                               -0.38
                                                                                                -0.40
                                                                                                         3/17    4/17    1/18    2/18    3/18    4/18    1/19    2/19    3/19   4/19   1/20   2/20       3/20
3/17    4/17    1/18   2/18    3/18    4/18    1/19    2/19    3/19    4/19    1/20    2/20     3/20

                                Net Working Capital                                                        Operating Cash Flow (YTD)
                                [EUR million]                                                              [EUR million]
                                                                95.8            95.4              96.0                                                                          42.0
                                                        93.1                                                                                      38.2
                       85.3     85.2            87.8                                     87.2
81.9            79.5                                                    81.2                                                                                                                             33.2
                                                                                                                  31.6
         70.3                           70.1
                                                                                                                                                                                              20.5

                                                                                                                                          11.7                           10.1
                                                                                                           5.2

                                                                                                                          -2.7    -2.2                                                 -1.1
                                                                                                                                                                  -6.1
3/17     4/17   1/18   2/18     3/18    4/18    1/19    2/19    3/19    4/19    1/20     2/20     3/20                                                   -10.3                                       8

                                                                                                          3/17    4/17    1/18    2/18    3/18    4/18   1/19    2/19    3/19   4/19   1/20   2/20       3/20
Slightly lower investment levels compared to record levels of the previous year
INVESTMENTS BY SEGMENT

Investments (excl. M&A)          -5.1%                          Key Investments
[in EUR]                  7.8
                                          7.4                   Climate Systems:
       Med. Tech. &
                          1.3             0.5    -63%
        Eng. Plastics                                           • Upgrade of two production halls at Wolf in Mainburg
                                                                • IT infrastructure investments
   Gas Flue Systems       1.6                                   • Various product developments at Wolf and Brink
                                          3.2    +>100%

                                                                Gas Flue Systems (including Holding):
                                                                • Building of production plant in China completed
                                                                • Ongoing implementation of HR IT solution for the
     Climate Systems      5.0                                     group
                                          3.7      -25%
                                                                Med. Tech. & Eng. Plastics
                                                                • New production hall prepared for Moeller Medical in
                                                                  Fulda; cost shown in Gas Flue Systems, because
                        Q3 19            Q3 20                    the hall belongs to the Holding
YtD Q3
in EUR million            31.1           29.4      -5%
                                                                                                                     9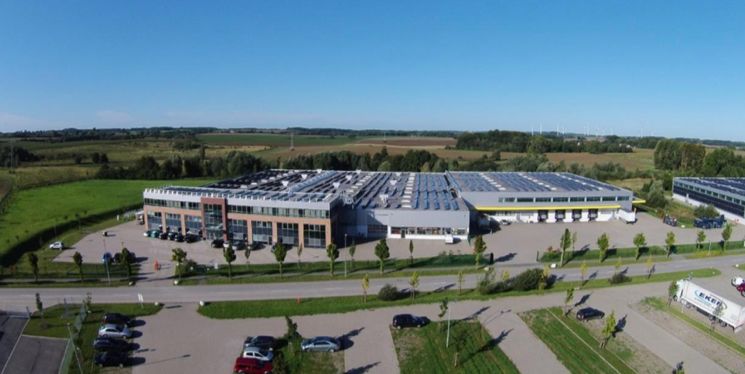
AGENDA
! Market Overview & Key Financials
! Operational Highlights
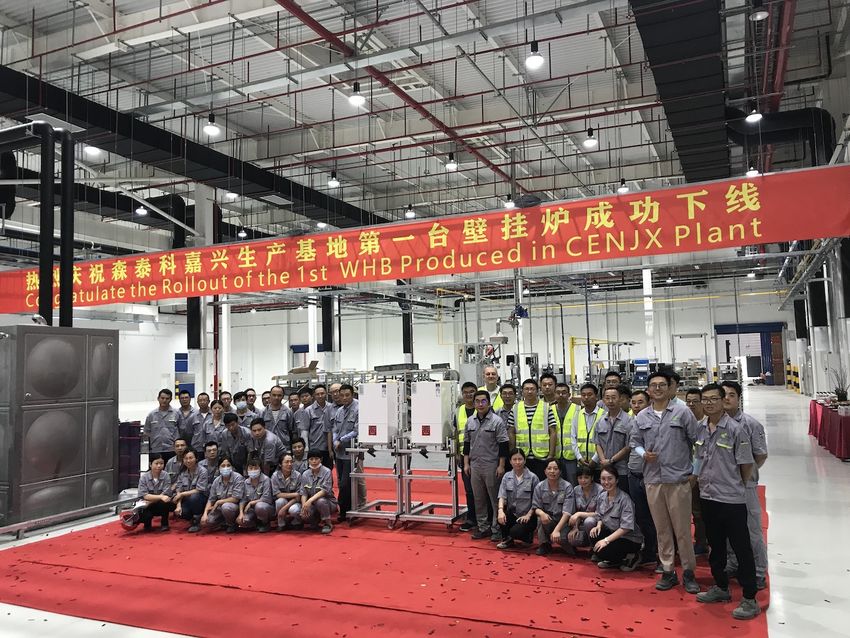
! OutlookThe new CENTROTEC factory in Jiaxing has been inaugurated
JIAXING FACTORY
Highlights
• Production start end of August 2020
• Approx. 35 employees actual; about 50
FTE planned for 2021
• 15,000 sqm production, warehouse, office
space
• Product portfolio produced in Jiaxing will
be extended step by step in the coming
month
• Total investment of EUR 16 million
11Share buy-back program 2020 successfully completed
SHARE BUY BACK PROGRAM
Rationale for Buy-Back Program
• High level of liquidity, long-term secured
• Last years’ acquisition activities smaller than expected; currently only smaller
opportunities in the pipeline
• Need for M&A in climate system segment reduced due to successful heat pump
business development
Key Parameters
• Public Tender Offer
• Fixed price at 14.00 EUR per share
• Up to 1,463,093 shares (9,99%)
Result
• Tender offer was well oversubscribed: 2.093.760 shares offered.
• 1,4630,010 shares bought back (20.5 Mio. EUR)
• Shares have been redeemed in September
• Remaining number of outstanding shares: 13,167,926
12With the acquisition of the PARI group, CENTROTEC serves two key purposes:
strategic diversification and improved financial asset allocation
ACQUISITION OF PARI GROUP AG
Highlights Strategic Rationale
• Profitable German PV module Photovoltaics
manufacturer („Sonnenstromfabrik“) • Diversify product portfolio in the Gas Flue
focussing on high quality durable roof- Systems segment to reduce dependency on
top products long-term declining Gas Flue Systems
market (approx. two thirds of 2019 sales)
• Production facility of CS Wismar and • Expand the use of renewable energy sources
attractive portfolio of real estate for heat and fresh air supply in buildings
properties
Real Estate Investments
Transaction Facts and Figures • Stabilize financial income of the group
• Shift from capital market investments to real
Equity Purchase Price 43,3 MEUR
estate returns
Net Debt* 16,9 MEUR • Professionalize real estate management
within the group
Net Working Capital* 4,9 MEUR
13
* Valued on pro rata basis of the aquired entities, i.e., adjusted for minoritiesAs the power-generation with PV gains competitiveness, the market is expected to
grow with accelerated growth rates
PHOTOVOLTAICS MARKET – EUROPE 2019 – 2023 IN GW
• Total market in Europe growing:
Germany (largest PV market in
Europe) grew by 67% in 2018, and
33% in 2019
• Growth primarily driven by systems
for own use and mid- to large-size
commercial feed-in-tariff-systems
(40kWp to 750kWp)
• Double-digit growth p.a. in the
coming years expected
14
Source: SolarPower 2019With the acquisition of the Sonnenstromfabrik, CENTROTEC steps into the revived
photovoltaics industry, focussing on high quality roof-top solutions
SONNENSTROMFABRIK WISMAR
! Cutting-edge quality leader for solar
modules in made in Germany
! Product range comprises
! framed and frameless glass/glass
modules,
! framed standard modules
! roof-integrated modules
! Low CO2-footprint modules
! 110 employees in Wismar generated
EUR 19.4 million revenue and EUR 0.5
million (EBITDA) in 2019
! EUR 29 million revenue and EUR 1.2
million EBITDA guided for 2020
15The production facility in Wismar and two other largely commercial properties in
attractive city locations provide for a good investment portfolio
REAL ESTATE PROPERTY PORTFOLIO
Wismar, An der Westtangente Leipzig, August Bebel Str. 69 Fürth, Siemensstraße 3-7
Site Area Rental Space Rental Income
100% = 71k sqm 100% = 34k sqm MEUR
2.5
2.1
Potential Actual 16
2020eTwo major real estate projects in Fürth and Leipzig are currently being developed
REAL ESTATE DEVELOPMENT PROJECTS
Gesundheitscampus Fürth, Siemensstraße 3-7 Ärztehaus Leipzig, Steinstraße 10
17Over the last three years, the financial investment strategy delivered a very volitale
result with below expectation returns
OVERALL PERFORMANCE OF FINANCIAL INVESTMENT STRATEGY
Avg. Invested Capital Fund Performance Performance Evaluation
Mio. EUR % • Average Performance since
140 6,00% start of fund:
1.5% p.a.
120 4,00%
100 2,00% • Overall returns from
investment activities since
80 0,00%
start of fund:
60 -2,00% -3.4 Mio. EUR
40 -4,00% • Estimated returns of
alternative holding of liquid
20 -6,00%
funds (negative interest rate)
- -8,00% -1.5 Mio. EUR
2016 2017 2018 2019 2020 (YTD)
Avg. Invested capital Performance
18The second wave is here, keeping us alert on potential risks for our business.
IMPLICATIONS OF CORONA PANDEMIA ON CENTROTEC OUTLOOK
Key components have been
UPDATE
Interruption
of Supply stocked up, but this risk could
Chain return, if (foreign) production
Trend Indicator
facilities are closed in the
course of wave 2
After a brief recovery we
expect similar demand
drops in foreign markets. The risk of business
Corona interruption due to high
Germany and NL are still Interruption
Interruption infection rates has been
hardly affected. In the mid-
of Demand impact on of Business
Processes mitigated through the
term, the drop in real estate
investment activities will
Earnings implementation of a group
impact the AHU business in wide hygiene and safety
concept. But corona
2021.
incidences among
employees are on the rise
again
Unless there is a significant State-
upsurge in infection rates, this ordered
risk is currently seen less likely production
to affect our business stop 19The Air Purifier significantly reduces the infection risk in class rooms or other
frequented rooms like offices, conference-rooms, waiting rooms or restaurants
AIR PURIFIER
New Plug & Play product for Air Purification
+ Suitable for 6 times air filtration in typical class
rooms (60-70 sqm).
+ Removes bio-aerosoles with highly efficient
H14 HEPA filter with a separation
performance of 99,995 % (DIN EN 1822)
+ Extremely silent (42 dB(A) max., 34 dB(A) in
regular mode
+ Plug-n-Play
+ No Ozon
+ In line with VDI 6022 hygiene standards
+ Neutralizes odors (activated carbon filter)
Specifically designed for retrofit in rooms with
limited ventilation possibilities
20AGENDA
! Market Overview & Key Financials
! Operational Highlights
! OutlookGuidance increased in October as a result of the good Q3 performance
OUTLOOK
Revenue
[in million EUR]
670 to 690 690 to 710 Current Assessment
Med. Tech. & 651.0
Eng. Plastics 54.0 + Strong development of Dutch and German
Gas Flue Systems 139.6 market continued throughout the 3rd quarter
+ Pari acquisition will contribute approx. 8
million EUR of sales in Q4
Climate Systems 457.4
+ Positive corona-related effects (approx. 9
Mio. EUR FY EBIT impact):
+ cost savings on travel and marketing
EBIT expenses
[in million EUR]
43 to 46 + Some extra sales and earnings from Air
Purifier in Q4
34 to 36
Med. Tech. & 33.1
Eng. Plastics 3.2 - Heavily affected markets will remain low for
10.1 the coming months
Gas Flue Systems
Climate Systems 19.8
2019 2020e old 2020e new 22While some opportunities prevail, not all of the earnings drivers in 2020 will be sustainable
OUTLOOK BEYOND 2020
Opportunities
• Extra sales of Air Purifier in Q1 2021
• Continued subsidies for heating systems in Germany until end of
2021
• Additional sales and earnings from PARI acquisition
• Long-term general increase in awareness for ventilation systems
Risks
• Cost savings on travel and marketing expenses (7,5 Mio. EUR
estimated for 2020) not sustainable
• New subsidy scheme in Germany (BEG) may lead to loss of USP of
Wolf heat pump (no more extra subsidies for units with high
seasonal performance factor)
• Significant cool-down in commercial building sector expected
• Short-term decline in oil based heating systems (~5% of sales)
• Long-term decline in all conventional heating systems (approx. 50%
of group sales) 23Thank you! This presentation contains forward-looking statements based on current expectations, assumptions and forecasts of the executive board and on currently available information. Various known and unknown risks, unpredictable developments, changes in the economic and political environment and other presently not yet identifiable effects could result in the fact that the actual future results, financial situation or the outlook for the company differ from the estimates given here. We are not obligated to update the forward-looking statements made in this presentation unless there is a legal obligation. CENTROTEC SE Am Patbergschen Dorn 9 59929 Brilon/Germany www.centrotec.de Tel: +49 2961 96631-0 Fax: +49 2961 96631-100 ir@centrotec.de WKN 540750 ISIN DE 000 54 07506
You can also read