First half 2016 results and recent Group acquisitions Rome, July 29th 2016 - Cementir
←
→
Page content transcription
If your browser does not render page correctly, please read the page content below
First half 2016 results and recent Group acquisitions Rome, July 29th 2016
Contents                     2

2016 FIRST HALF RESULTS

SACCI ACQUISITION

BELGIUM ASSETS ACQUISITION
3

2016 FIRST HALF RESULTS
Executive summary - H1 2016                                                                        4

•    Strong performance of operations in Scandinavian countries, Malaysia and Egypt and positive – albeit
     reduced – contribution of Turkey and China, which offset the difficulties faced in Italy
•    Significant negative effect of exchange rates on Ebitda (EUR 5.6 million)
•    H1 2016 revenue from sales and services rose by 1.1% (up 7.1% at constant exchange rates)
•    Cement volumes increased 4.8%, ready-mix up 20% and aggregates down -8%
•    Ebitda decreased by 1.5% to EUR 72.0 million (EUR 73.1 in H1 2015). At constant FX, Ebitda would have
     been EUR 77.6 million. Ebitda margin to 15.0% (15.4% in H1 2015)
•    Net financial expense of EUR 10.2 million (income of 5.2 in H1 2015)
•    Group net profit equal to EUR 11.0 million (23.9 in H1 2015)
•    Net financial debt at EUR 262.9 million (222.1 million at 31 Dec. 2015 and 271.9 million at 31 March
     2016)

•    Confirmed FY 2016 targets at constant perimeter (before acquisitions):
      •   Ebitda approx. EUR 190 million
      •   Net financial debt of approx. EUR 180million
Highlights - Consolidated Income Statement 5 P&L (EUR million) H1 2016 H1 2015 Chg % Q2 2016 Q2 2015 Chg % REVENUE FROM SALES AND SERVICES 481,0 475,7 1,1% 270,6 271,0 (0,2%) Change in inventories (3,2) (0,6) 458,8% (8,2) (13,3) (38,4%) Other revenue 7,5 7,1 5,7% 4,1 3,3 24,7% TOTAL OPERATING REVENUE 485,3 482,2 0,6% 266,4 261,0 2,1% Raw materials costs (206,4) (205,3) 0,5% (109,2) (108,9) 0,2% Personnel costs (78,4) (77,6) 1,0% (39,5) (38,0) 4,2% Other operating costs (128,6) (126,1) 1,9% (67,0) (65,1) 2,9% TOTAL OPERATING COSTS (413,3) (409,1) 1,0% (215,8) (212,0) 1,8% EBITDA 72,0 73,1 (1,6%) 50,6 48,9 3,5% EBITDA Margin % 15,0% 15,4% 18,7% 18,1% Amortisation, depreciation, impairment losses and provisions (40,2) (42,2) (4,7%) (20,0) (21,0) (5,0%) EBIT 31,8 31,0 2,8% 30,7 27,9 9,9% EBIT Margin % 6,6% 6,5% 11,3% 10,3% FINANCIAL INCOME (EXPENSE) (10,2) 5,3 (294,6%) (3,0) 4,53 (167,0%) PROFIT (LOSS) BEFORE TAXES 21,6 36,2 (40,3%) 27,6 32,4 (14,8%) Profit (loss) before taxes Margin % 4,5% 7,6% 10,2% 12,0% Income taxes (5,9) (9,7) - - PROFIT (LOSS) FOR THE PERIOD 15,8 26,5 (40,7%) - - Minorities 4,7 2,7 74,7% - - GROUP NET PROFIT 11,0 23,9 (53,7%) - - Sales volumes (thousands) H1 2016 H1 2015 Chg % Q2 2016 Q2 2015 Chg % Grey and white cement (metric tons) 4.749 4.532 4,8% 2.735 2.680 2,1% Ready-mix concrete (m 3) 2.140 1.783 20,0% 1.229 981 25,3% Aggregates (metric tons) 1.695 1.843 (8,0%) 997 1.053 (5,3%)
Highlights - Volumes                                                                                                          6

              Grey and white cement ( t)                   Ready-mix concrete (m3)                       Aggregates (t)
                                  4.749
                 4.532    4.8%
                                                                              2.140
         H1                                           H1             20.0%                       H1    1.843    -8.0%
                                                             1.783                                                        1.695

                          2.1%    2.735
                 2.680
                                                                     25.3%    1.229
                                                                                                       1.053
         Q2                                           Q2     981
                                                                                                 Q2             -5.3%     997

                          8.7%                                       13.5%                                      -11.7%
         Q1      1.852            2.014               Q1                      911                Q1
                                                             802                                       791                698

                H1 2015          H1 2016                   H1 2015           H1 2016                  H1 2015            H1 2016

•   Denmark: increase in cement volumes (+7.3% in H1), thanks mainly to domestic market demand, driven by strong performance of
    civil and residential construction. Stable ready-mixed concrete volumes.
•   Norway / Sweden: in Norway higher rmc volumes (+13%) thanks to a recovery in the construction sector, above all in the Oslo
    area, which had seen a contraction in 2015. In Sweden strong increase of rmc volume (+28%) driven by residential and
    infrastructure in the South, aggregates volumes fell due to the completion of some important contracts.
•   Asia Pacific: in China domestic volume increased with prices downwards, and fall in export volumes. In Malaysia higher cement
    volumes (+27%) due to white exports to Australia.
•   Egypt: lower volumes on the domestic market, partially mitigated by an increase in sales prices and higher export volumes.
•   Turkey: higher volumes sold of both cement (+9.1%) and rmc (+41.2%), generated by the increase in internal demand in the Izmir
    and Edirne regions.
•   Italy: fall in sales of cement (-9.8%) and rmc (-18.5%) with slightly higher sales prices.
Revenue and Ebitda by Region / Country* 7
Revenue from sales and services
YoY
Change (%)
5% 2% 0% -12% 7% -9% 1%
45,3 -23,8
26,0 38,5
116,9
117,3 481,0
160,9
EUR million
Total
Denmark Other Turkey Egypt Asia Pacific Italy Eliminations
H1 2016
Nordic & Baltic and US Eastern Mediterranean
Ebitda
YoY
Change (%) 11% 7% -20% 11% 34% -66% -2%
5,9 8,8 -9,6
18,9
7,9
72,0
40,1
EUR million
1 Italy
includes Ebitda of
Total
Denmark Other Turkey Egypt Asia Pacific Italy 1 Cementir Holding of -2.5 M€
H1 2016
Nordic & Baltic and US Eastern Mediterranean in H1 2016 (2015: -2.2 M€)
* From 1 January 2016 the Group is divided into four new regions: Nordic & Baltic and US (Denmark,
Norway, Sweden Iceland, UK, Poland, Russia, France and US), Eastern Mediterranean (Turkey and
Egypt), Asia Pacific (China, Malaysia and Australia) and Italy.Cash flow generation and debt financial debt 8
• Net financial debt increased to EUR 262.9 million due to movements in working capital, annual plant
maintenance – performed in the early months of the year – and dividend distribution, paid out in May
• In the second quarter net financial debt improved by EUR 9 million, despite dividend payout
EUR million
*
+40,8
* Of which EUR 15.9 million distributed by Cementir Holding SpaNet financial debt and key financial ratios 9
• Net debt is expected to be reduced to around EUR 180 million at the year-end 2016, not including perimeter
expansion
Net financial debt Key financial ratios
EUR million
~
*H1 2015 Net financial debt / EBITDA is based on the last 12 months EbitdaGroup Balance sheet reclassified 10
EUR/million
CAPITAL EMPLOYED 30/06/2016 31/12/2015
NON CURRENT ASSETS & LIABILITIES
Tangible, intangible and financial assets 1.252,8 1.290,4
Deferred taxes assets/ liabilities 0,6 (8,7)
Other non current assets/ liabilities (33,4) (35,8)
TOTAL NON CURRENT ASSETS & LIABILITIES 1.220,0 1.245,9
CURRENT ASSETS & LIABILITIES
Inventories 132,0 140,0
Trade receivables 203,4 174,1
Trade payables (163,4) (180,5)
Working Capital 172,0 133,6
Other current assets/ liabilities (16,2) (26,3)
TOTAL CURRENT ASSETS & LIABILITIES 155,8 107,3
TOTAL CAPITAL EMPLOYED 1.375,8 1.353,2
FINANCIAL SOURCES 30/06/2016 31/12/2015
Equity attributable to the owners of the parent 1.028,7 1.048,7
Equity attributable to non-controlling interests 84,2 82,4
TOTAL EQUITY 1.112,9 1.131,1
NET FINANCIAL DEBT (262,9) (222,1)
TOTAL FINANCIAL SOURCES 1.375,8 1.353,2The Enlarged Group after acquisitions 11
Volumes sold 2015 2017
Cement (Mt) 9,4 12,5
Ready-mixed concrete (mm3) 3,7 4,5
Aggregates (Mt) 3,8 8,6
2015 2017
Operating Revenue (€ million) 995 1.250
Mature markets 57% 65%
- Italy 9,8% 12,4%
- Belgium - 14,4%
Emerging markets 43% 35%12 SACCI ACQUISITION
Sacci                                                                                                       13
Summary transaction overview

                 • Closing completed on 29 July 2016
  Key Terms
                 • Total transaction value:
                      • EUR 125 million, financed through bridge financing with the related party
                          company ICAL 2 Spa (all-in interest rate of 1.50% per annum)

                 • Price paid in two tranches:
                       • EUR 122.5 milllion - at closing (29 July 2016)
                       • EUR 2.5 million - 24 months after the closing

                 • Part of the transaction value (~20 million), representing items similar in nature to
                   working capital, is subject to price adjustment on the basis of balance sheet at
                   closing

                 • Acquisition of the business division for the production of cement and ready-mixed
                   concrete of Sacci Spa (“Sacci”):
                             –   3 cement plants (Testi- Greve in Chianti, Cagnano Amiterno, Tavernola)
                             –   3 terminals (Manfredonia, Ravenna and Vasto)
                             –   Ready-mixed concrete plants, mainly located in Central Italy
                             –   Transport service
                             –   Equity investments in the consortium companies Energy for Growth and San
                                 Paolo, and in the Swiss registered company Fenicem SA
Sacci: the fifth largest Italian cement player 14
Focus on Sacci’s operations A solid rationale
• Fifth largest player - market share of approx. 6%) • Enhances Cementir’s positioning in Italy
• Vertical integrated in ready-mixed concrete • Complementary geographies (North and Central Italy)
with higher growth potential and greater profitability
• Regions in the North of Italy have normally higher
prices than Central /Southern part of the country
Tavernola (BG) – 0.7 mtpa
• Captures synergies – estimated at around EUR 10 million
once the integration is completed
• Streamline the distribution network for the Sacci’s
Ravenna (RA) new plants and Cementir’s plants
Testi Greve in Chianti (FI) – 0.8 mtpa • Sales and logistics
Livorno (LI) – Idle Castelraimondo (MC) – 0.5 mtpa • Global procurement
Idle from 2015
Cagnano Amiterno (AQ) – 0.5 mtpa Vasto (CH) • Improves Cementir’s position and leverage to any recovery
of the Italian market
Manfredonia (FG)
• Broader and more efficient industrial base to benefit
RMC plants
from expected favourable medium-term upward trend
in Italy
Existing business operations
Business # of plants
Cement 5
Ready-mixed concrete (RMC) 28
Terminals 315 ACQUISITION OF BELGIAN ASSETS
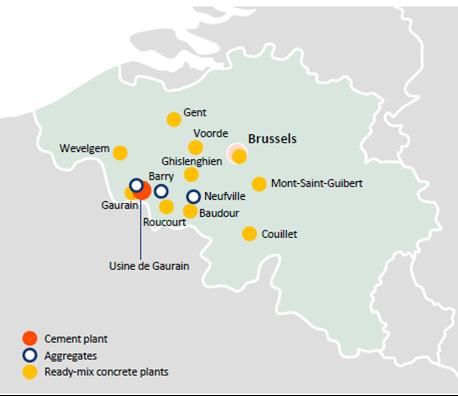
Belgian assets Overview                                                       16

                                             Acquisition rationale

                          • Unique strategic opportunity to:
                              – diversify the Group geographical presence in the
                                core of Western Europe, mainly Belgium, with high
                                quality assets and vertical integrated business
                              – further widen product range into aggregates

                                                  Highlights

                          • Fully integrated cement plant with nominal capacity of
                            2.3 million tons (1.8 Mt of volumes sold in 2015)
                              – Gaurain-Ramecroix is the largest plant in France-
                                Benelux, has a state-of-the-art technology and
                                long-life mineral reserves (over 80 years)
                          • Network of 10 ready-mixed plants (0.8 mm3 of volumes
                            sold in 2015)
                          • Aggregate business (4.8 M of volumes sold in 2015)
                          • 2015 Pro forma Sales of around EUR 180 million
Belgian assets Overview 17
• Agreement with Ciments Français, a subsidiary of Italcementi and of
Key Terms HeidelbergCement to acquire some of their operations in Belgium, primarily
Compagnie des Ciments Belges S.A. (CCB)
• Total Enterprise Value: EUR 312 million, on a cash and debt-free basis
• Closing expected in the second half of 2016
• Subject to European Commission approvalAcquisition Financing 18
• The Acquisition Financing scheme made available by three Mandated Lead Arrangers Banks to
Cementir Holding Group is
Amount Type Maturity Use
18 months
330 M€ Bridge Financing + Extension option 6 to fund acquisition of CCB, to
months refinance Sacci Bridge
Financing and other existing
5 years credit facilities for the Group
315 M€ Term Loan
(average 4 years)
to fund working capital swings
Revolving Credit
+ 150 M€
Facility
5 years and other general purposes of
borrowers
Average All-In annualized financing costs
2.2% - 2.3%Expected Financial Leverage* of the Enlarged Group 19
2016 2016 2017 2018
Current perimeter Pro-forma
Leverage Leverage Leverage Leverage
expected year-end after acquisition** expected year-end expected year-end
expected year-end
0.9x 2.9x 2.2x 1.6x
* Year-end NFP / Ebitda
** Pro-forma on a full-year EbitdaLegal disclaimer 20 This presentation has been prepared by and is the sole responsibility of Cementir Holding S.p.A. (the “Company”) for the sole purpose described herein. In no case may it or any other statement (oral or otherwise) made at any time in connection herewith be interpreted as an offer or invitation to sell or purchase any security issued by the Company or its subsidiaries, nor shall it or any part of it nor the fact of its distribution form the basis of, or be relied on in connection with, any contract or investment decision in relation thereto. This presentation is not for distribution in, nor does it constitute an offer of securities for sale in Canada, Australia, Japan or in any jurisdiction where such distribution or offer is unlawful. Neither the presentation nor any copy of it may be taken or transmitted into the United States of America, its territories or possessions, or distributed, directly or indirectly, in the United States of America, its territories or possessions or to any U.S. person as defined in Regulation S under the US Securities Act 1933 as amended. The content of this document has a merely informative and provisional nature and is not to be construed as providing investment advice. The statements contained herein have not been independently verified. No representation or warranty, either express or implied, is made as to, and no reliance should be placed on, the fairness, accuracy, completeness, correctness or reliability of the information contained herein. Neither the Company nor any of its representatives shall accept any liability whatsoever (whether in negligence or otherwise) arising in any way in relation to such information or in relation to any loss arising from its use or otherwise arising in connection with this presentation. The Company is under no obligation to update or keep current the information contained in this presentation and any opinions expressed herein are subject to change without notice. This document is strictly confidential to the recipient and may not be reproduced or redistributed, in whole or in part, or otherwise disseminated, directly or indirectly, to any other person. The information contained herein and other material discussed at the presentation may include forward-looking statements that are not historical facts, including statements about the Company’s beliefs and current expectations. These statements are based on current plans, estimates and projections, and projects that the Company currently believes are reasonable but could prove to be wrong. However, forward-looking statements involve inherent risks and uncertainties. We caution you that a number of factors could cause the Company’s actual results to differ materially from those contained or implied in any forward-looking statement. Such factors include, but are not limited to: trends in company’s business, its ability to implement cost-cutting plans, changes in the regulatory environment, its ability to successfully diversify and the expected level of future capital expenditures. Therefore, you should not place undue reliance on such forward-looking statements. Past performance of the Company cannot be relied on as a guide to future performance. No representation is made that any of the statements or forecasts will come to pass or that any forecast results will be achieved. By attending this presentation or otherwise accessing these materials, you agree to be bound by the foregoing limitations. For further information please contact our Investor Relations Office: T +39 06 32493481 F +39 06 32493274 E invrel@cementirholding.it
You can also read