Worksession 3 Thrive Montgomery 2050 Public Hearing Draft - Thrive Montgomery 2050 - Work Session
←
→
Page content transcription
If your browser does not render page correctly, please read the page content below
www.thrivemontgomery.com
Montgomery Planning                                   1/14/2021

Worksession 3
Thrive Montgomery 2050 Public Hearing Draft
Plan
Thrive Montgomery 2050 – Work Session 1          12/17/2020   1
Today’s Presentation

     1. Residential Development Capacity Analysis
     2. Proposed draft of Housing chapter
     3. Summary of Transportation Analysis Report
         (for worksession #4 on 1-21-21)

     4. Outline of the revised transportation chapter
         (for worksession #4 on 1-21-21)

Thrive Montgomery 2050– Worksession 3                   1/14/2021   2
Residential Development Capacity Analysis (RDCA)

• The Residential Development Capacity Analysis (RDCA) is an
  estimate of the total potential residential development that
  may be built in Montgomery County, MD under a certain set of
  assumptions and constraints.
• These assumptions include applicable market trends, zoning rules
  and existing policy decisions. These assumptions, further, do not
  include Municipalities that govern their own zoning.
• The RDCA will serve as a baseline measure that aims to estimate
  current residential capacity in Montgomery County in dwelling
  units.
Thrive Montgomery 2050– Worksession 3                           1/14/2021   3
Factors that can affect residential development or feasibility

1.Market forces                         11.Development Incentives
2.Public policy decisions               12. Accessory Dwelling Units
3.Development pattern                   13. Size of multi-family buildings
4.Infrastructure costs                  14. Unit Size
5.Development and Demographic
  trends
6.Master Plans life span
7.Height limits
8.Parcel level conditions
9.Assemblage
10.Competing priorities

Thrive Montgomery 2050– Worksession 3                                    1/14/2021   4
RDCA Methodology

1.Establish the existing dwelling unit count.
2.Add current development pipeline to the existing dwelling unit count to account
  for parcels currently approved for development.

3.Apply attributes to all parcels to enable identification of environmental or man-
  made factors that constrain the development potential.

4.Filter remaining parcels for environmental or man-made constraints to determine
  remaining additional residential development capacity.

5.Determine the residential development potential allowed by the existing zoning
  for all remaining parcels in the county.

Thrive Montgomery 2050– Worksession 3                                                 1/14/2021   5
RDCA Methodology

1.Environmental Constraints: Environmental constraints may exist due to
  government policies that protect land or factors that limit the development
  potential of a site. These areas include areas protected under existing
  laws, regulations, and guidelines.

2.Man-made Constraints: Constraints that are man-made, such as
  transportation and utility infrastructure, may impede the ability for a site
  to reach its development potential and were removed from the
  consideration for capacity.

3.Assumptions: To the extent possible, trends and market forces on realized
  density may impact the final calculation of capacity.

Thrive Montgomery 2050– Worksession 3                                            1/14/2021   6
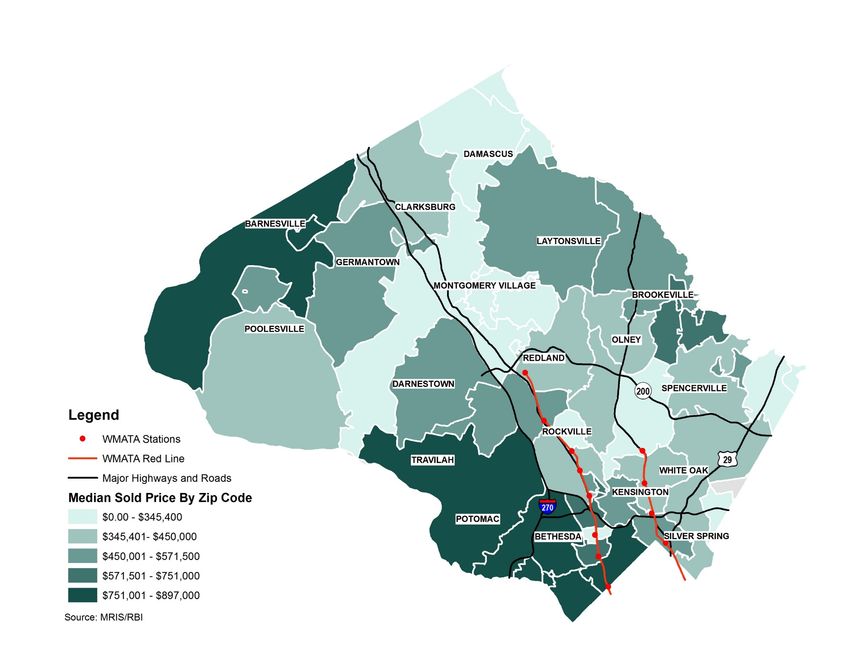
Net Dwelling
                                        Unit Capacity

                                          Residential Capacity Analysis Results

                                        Remaining parcels      3,733
                                        with development
                                        or redevelopment
                                        potential
                                        Total additional       66,569
                                        existing residential
                                        capacity (in units)

Thrive Montgomery 2050– Worksession 3                                   1/14/2021   7
RDCA Results
Parcel Percent of Sum of Net Percent
Count Parcels Capacity of
Capacity
Activity Centers 1,129 12% 43,112 65%
Priority Funding Areas 2,461 25% 61.449 92%
Downcounty 1,068 11% 20,403 31%
Mid-county 828 9% 31,708 48%
Up-county 1,837 19% 14,458 22%
WMATA Red Line Stations Half-Mile 687 7% 25,179 38%
Purple Line Stations Half-Mile 590 5% 15,179 23%
MARC Stations Quarter- Mile 279 3% 10,469 16%
BRT Route Quarter-Mile 936 10% 34,478 52%
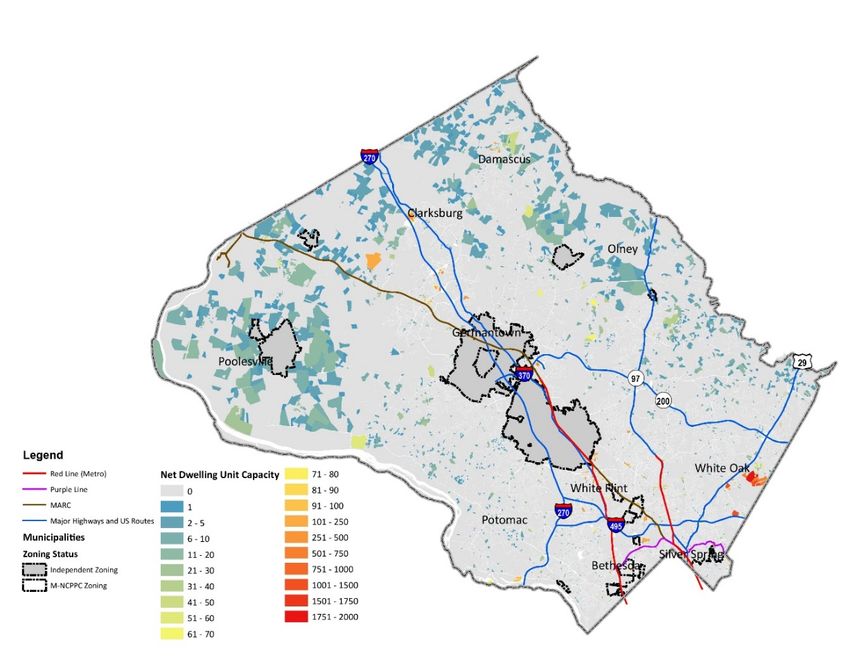
Thrive Montgomery 2050– Worksession 3 1/14/2021 8Net Dwelling
Unit Capacity
>10 Units
Residential Capacity Analysis Results
Remaining parcels 3,733
with development
or redevelopment
potential
Total additional 66,569
existing residential
capacity (in units)
Thrive Montgomery 2050– Worksession 3 1/14/2021 9RDCA Results
Parcel Size Parcel Count Percent of Sum of Net Percent of
Parcels in Size Capacity Capacity
Range
0-1 Acre 1,926 52% 21,104 32%
1-5 Acres 950 25% 24,436 37%
5.01-25 Acres 419 11% 11,746 18%
25.01-50 Acres 216 6% 4,297 6%
50.01-100 Acres 117 3% 1,978 3%
Over 100.01 105 3% 3,008 5%
Acres
Total 3,733 100% 66,569 100%
Thrive Montgomery 2050– Worksession 3 1/14/2021 10RDCA Results
Zone family Parcel Percent Sum of Percent Developable Percent of
Count of Net of Acres Developable
Parcels Capacity Capacity Acres
AR 346 9% 1,066 2% 30,622 72%
CR 885 24% 52,871 79% 1,240 3%
Residential Detached 1,962 53% 9,491 14% 5,383 13%
Residential Multifamily 238 6% 1,815 3% 83 0.2%
Rural Residential 262 7% 965 1% 5,319 12%
Residential Townhouse 11 0.3% 70 0.1% 7 0.0%
Other 29 1% 291 0.4% 45 0.1%
Grand Total 3,733 100% 66,569 100% 42,700 100%
Thrive Montgomery 2050– Worksession 3 1/14/2021 11https://mcatlas.org/rdca
Top 5 Takeaways from RDCA
 While Montgomery County, MD has theoretical capacity for over 65,000 housing units on 3,733 parcels, most of the capacity is
 concentrated near transit, and along the original corridor, the I-270 corridor.

 Most residential capacity is tied up on the small sites – on sites less than 5 acres, highlighting Montgomery County’s development
 pattern shifting from greenfield development and toward infill development and compact form.

 Montgomery County has a diminished availability of available land for redevelopment or development, with the parcels available for
 development or redevelopment representing only 15 percent of the county’s land.

 Findings demonstrate that the county can prioritize agriculture and rural open space and also build more housing, by reevaluating
 previously made policy decisions, like the preservation of single-family zoning near our accessible single-family neighborhoods.

 There are many barriers to building housing, these variables are unable to be fully quantified but are important to consider when
 discussing future capacity. These barriers will be more pronounced in the future as the county continues to build out.
Affordable and attainable housing: more of
everything

  Public Testimony Themes:
  1.Go bold
  2.Missing Middle housing
  3.Single-family zoning
  4.Affordable Housing
Thrive Montgomery 2050– Worksession 3        1/14/2021 14
Affordable and attainable housing: more of
everything
  • PART 1: What is the problem / existing conditions that
    fall short?
  • PART 2: Therefore, Thrive Montgomery 2050 proposes
    the following policies and actions.
  • PART 3: The rationale for how these policies and
    actions will further the key objectives of Thrive
    Montgomery 2050.
  • PART 4: How will we know we are making progress?

Thrive Montgomery 2050– Worksession 3                        1/14/2021 15
Affordable and attainable housing: more of
everything
PART 1: What is the problem / existing conditions
that fall short?
1. Not enough new housing to meet demand.
2. Anemic supply is driving the price of housing up for both renters and home
buyers.
3. A growing gap between changing living patterns and the older housing
stock.
4. The high cost and limited variety of available housing exacerbate
inequality.
5. Expansion and diversification of our housing stock is an essential step
toward reducing these kinds of racial and socioeconomic inequalities.
Thrive Montgomery 2050– Worksession 3 1/14/2021 161.) Not enough housing to meet demand.
12,000 Montgomery County Building Permits 1,200,000
1-unit 2-units 3-4 units 5+ units Population
10,000 1,000,000
8,000 800,000
Population
Units
6,000 600,000
4,000 400,000
2,000 200,000
0 -
1980 1982 1984 1986 1988 1990 1992 1994 1996 1998 2000 2002 2004 2006 2008 2010 2012 2014 2016 2018
Thrive Montgomery 2050– Worksession 3 1/14/2021 172.) Anemic supply is driving the price of housing up for both renters and
home buyers.
Homeownership Rate by Age
90%
80%
70%
60%
50%
40%
30%
20%
1990 1992 1994 1996 1998 2000 2002 2004 2006 2008 2010 2012 2014 2016
< 35 35-44 45-54 55-64 65-74 75+ Total
Thrive Montgomery 2050– Worksession 3 1/14/2021 183.) A growing gap between changing living patterns and the older housing
stock.
Household Family Types 1960-2018
1% 2% 6% 8% 7% 6% 6%
7% Other Non-Family
6% 14%
4% 21% 22% 24% 25% 25%
4% Non-Family, householder living
27% 5%
7% 7% 8% alone
6% 8%
29% 6% 7% 7% Other Family
8%
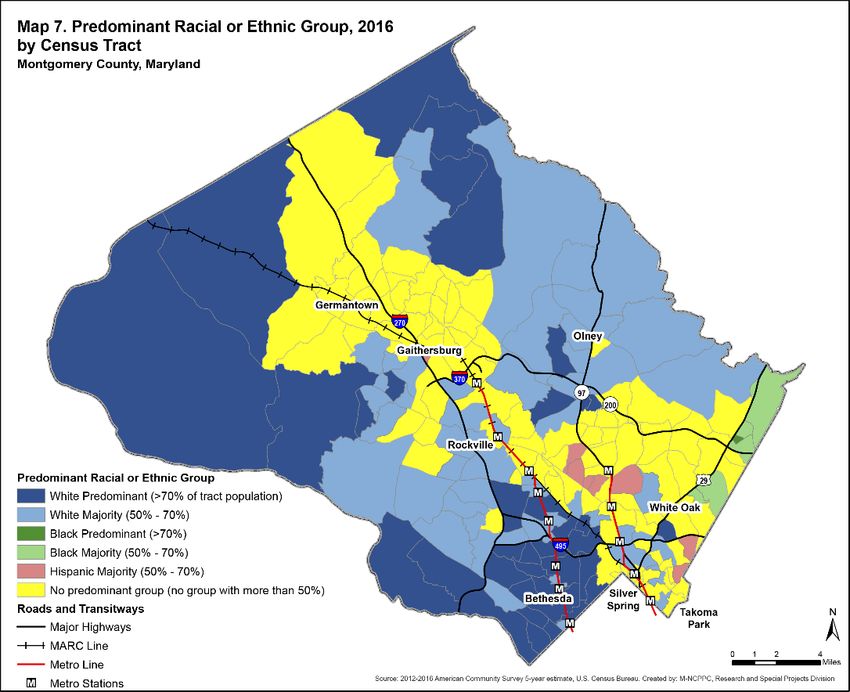
30% Single Parent, children4.) The high cost and limited variety of available housing exacerbate
inequality.
Median Sold Price by Income Predominant Racial
or Ethnic Group
Thrive Montgomery 2050– Worksession 3 1/14/2021 205.) Expansion and diversification of our housing stock is an essential step
toward reducing racial and socioeconomic inequalities.
Housing Forecasts by Type and Tenure, 2020-2040 (%)
60.00% 54.80%
50.00%
40.00%
30.00% 27.40%
20.00%
13.50%
10.00% 4.40%
0.00%
Single-Family Owner Multifamily Owner Single-Family Renter Multifamily Renter
Thrive Montgomery 2050– Worksession 3 1/14/2021 21Affordable and attainable housing: more of
everything
PART 2: Therefore, Thrive Montgomery 2050
proposes the following policies and actions.
1. Encourage the production of more housing to better match supply with
demand
2. Plan for a wide range of housing types and sizes to meet diverse needs
3. Promote racial and economic diversity and equity in housing in every
neighborhood
Thrive Montgomery 2050– Worksession 3 1/14/2021 22Encourage the production of more housing to better match supply with
demand
• Expand opportunities to increase residential density near high-capacity transit and assist in the
development of Complete Communities.
• Reform building codes to reduce costs by accommodating innovative construction methods and
materials including modular prefabricated housing and mass timber.
• Prioritize use of public land for co-location of housing and other uses, particularly where
government agencies design new facilities or dispose of real property.
• Increase regulatory flexibility to incentivize residential infill, redevelopment, and repositioning of
office parks, shopping malls, and other underutilized properties.
• Provide financial incentives such as Payment in Lieu of Taxes to boost housing production for
market rate and affordable housing, especially near transit and in Complete Communities.
Thrive Montgomery 2050– Worksession 3 1/14/2021 23Plan for a wide range of housing types and sizes to meet diverse needs
• Facilitate the development of a variety of housing types in every part of the county but especially
in areas near transit, employment and educational opportunities.
• Support creative housing options including single-room occupancy units (SROs); “missing middle”
housing types such as tiny houses, cottages, duplexes, multiplexes, and small apartment buildings;
shared housing, co-housing, accessory dwelling units (ADUs), social housing and cooperative housing
to help meet housing needs and diversify housing options.
• Encourage provision of multi-bedroom units suitable for households with children in multifamily
housing.
• Integrate people with disabilities, people transitioning from homelessness, and older adults into
attainable housing with appropriate amenities and services.
Thrive Montgomery 2050– Worksession 3 1/14/2021 24Promote racial and economic diversity and equity in housing in every
neighborhood
• Develop targeted strategies to minimize gentrification and displacement while promoting integration and avoiding the
concentration of poverty.
• Refine regulatory tools and financial incentives with the goal of avoiding a net loss of market-rate and income-restricted
affordable housing stock without erecting disincentives for the construction of additional units.
• Calibrate the applicability of the Moderately Priced Dwelling Unit (MPDU) program and other affordable housing
programs to provide price-regulated units appropriate for income levels ranging from deeply affordable to workforce.
• Identify and allocate additional revenue for the Housing Initiative Fund (HIF) to meet the needs of low-income households.
• Expand existing programs designed to increase access to homeownership, especially among low-income residents, people
of color, and young adults; create new programs and entities such as community land trusts to maintain long term affordable
home ownership opportunities.
• Improve collection of data on neighborhood change to monitor and address involuntary displacement, disinvestment, and
related phenomena.
Thrive Montgomery 2050– Worksession 3 1/14/2021 25Affordable and attainable housing: more of
everything
PART 3: The rationale for how these policies and actions will
further the key objectives of Thrive Montgomery 2050.
1. Increasing the supply of new housing near transit, jobs and amenities will improve the
quality of life for everyone and help attract and retain a broadly skilled workforce that
employers need, making the county more economically competitive.
2. A wider variety of housing and a focus on affordability and attainability will diversify
the mix of incomes in neighborhoods across the county and improve access to
services, amenities and infrastructure for low- and moderate-income residents, who
are disproportionately people of color.
3. A broader range of housing types – particularly the inclusion of multifamily buildings –
will reinforce the benefits of Complete Communities.
Thrive Montgomery 2050– Worksession 3 1/14/2021 26Affordable and attainable housing: more of everything PART 4: How will we know we are making progress? Relevant measures to assess new housing developments and measure the success or failure of the approaches recommended in this plan. Thrive Montgomery 2050– Worksession 3 1/14/2021 27
Relevant measures to assess new housing developments and measure the
      success or failure of the approaches recommended in this plan.

• Number of residential units issued building permits,   • Number of low-income households lost in a census
  overall and by area of county                            tract over a period of time (displacement)
• Number of affordable units by type, overall and by     • Proportion of missing middle housing units and
  area of county                                           units in multifamily buildings
• Rates of home ownership by race, income and area       • Greenhouse gas emissions from residential
• Number of and Proportion of cost-burdened                buildings and transportation per capita
  households                                             • Proportion of housing units proximate to transit
• Number of homeless residents                             routes and job centers
• Rent and mortgage payments as a fraction of the        • Range of home prices
  cost of living                                         • Racial and income diversity within neighborhoods
• Combined housing and transportation costs
• Naturally Occurring Affordable Housing preserved,
  overall and by area of county
• Number of low-income households in a census tract
  (concentration of poverty)

     Thrive Montgomery 2050– Worksession 3                                                           1/14/2021 28
Preview of Worksession 4
on January 21, 2021
Thrive Montgomery 2050– Worksession 3 1/14/2021 29Summary of
Transportation Analysis Report
Thrive Montgomery 2050– Worksession 3 1/14/2021 30Key Questions • How could the County be impacted by ongoing trends related to the economy, climate change, demographics, technology, and lifestyle choices? • Do these trends support the County’s vision for the future, or are policy interventions needed to achieve the County’s vision? Thrive Montgomery 2050– Worksession 3 1/14/2021 31
Analytical Approach

• Evaluate Impact of External Factors
• Evaluate Impact of Thrive Montgomery Policies

   Thrive Montgomery 2050– Worksession 3             1/14/2021 32
Metrics Evaluated

•   General Metrics: Person Trips, Vehicle Trips
•   Non-Auto Driver Mode Share (NADMS)
•   Vehicle Miles Traveled (VMT)
•   Travel Time
•   Job Access

     Thrive Montgomery 2050– Worksession 3             1/14/2021 33
Policies Evaluated
• Land use changes
• Complete communities
• Concentration of growth in transit areas
• Transportation changes
• Converting traffic lanes to transit lanes on BRT corridors
• Implementation of premium transit (BRT, MARC)
• Improving local bus service (frequency)
• Reducing parking capacity and increasing parking pricing
• Increase auto travel pricing and affordability
• Improve street network/block
Thrive Montgomery 2050– Worksession 3 1/14/2021 34Results Thrive Montgomery 2050– Worksession 3 1/14/2021 35
Outline of Revised Transportation Chapter

  • PART 1: What is the problem / existing conditions that
    fall short?
  • PART 2: Therefore, Thrive Montgomery 2050 proposes
    the following policies and actions.
  • PART 3: The rationale for how these policies and
    actions will further the key objectives of Thrive
    Montgomery 2050.
  • PART 4: How will we know we are making progress?

Thrive Montgomery 2050– Worksession 3                        1/14/2021 36
Part 1: What is the problem?
Montgomery County built an auto-oriented transportation system
that funnels traffic to a limited number of high-speed roads
Thrive Montgomery 2050– Worksession 3 1/14/2021 37Part 2: Proposed policies and actions
• Develop a safe, comfortable and irresistible walking and bicycling network.
• Build a world-class transit system.
• Adapt policies to reflect the economic and environmental costs of driving alone.
• Develop and extend advanced communications networks.
Thrive Montgomery 2050– Worksession 3 1/14/2021 38Part 3: How policies / actions will further key objectives of Thrive Montgomery
Reverse decades of auto-focused design and dependence by
making walking, bicycling and transit irresistible
Thrive Montgomery 2050– Worksession 3 1/14/2021 39Part 4: How will we know we are making progress? Relevant measures to assess progress in implementing the vision of the plan Thrive Montgomery 2050– Worksession 3 1/14/2021 40
You can also read