An Data Brief on Congressional Districts and Alzheimer's Prevalence among Communities of Color - Place & Brain Health Equity
←
→
Page content transcription
If your browser does not render page correctly, please read the page content below
Place & Brain Health Equity
An Data Brief on Congressional
Districts and Alzheimer’s
Prevalence among
Communities of Color

An Data Brief on Congressional Districts and Alzheimer’s Prevalence among Communities of Color   1
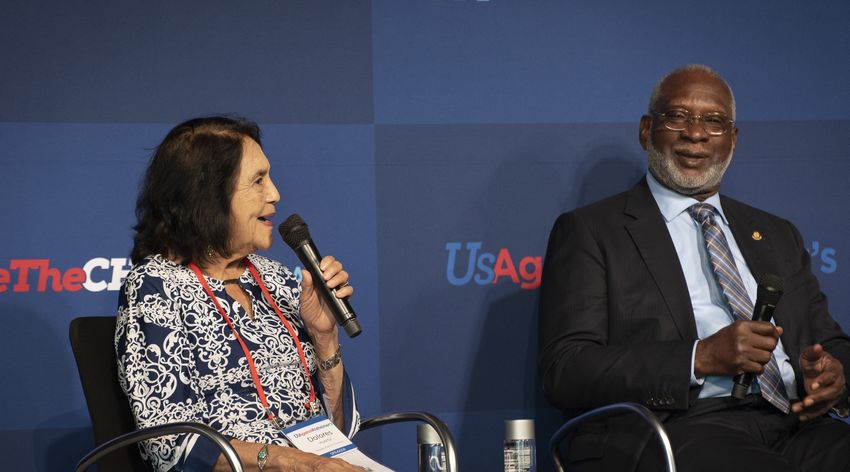
“We know first-hand the toll Alzheimer’s takes on
 individuals, families, and communities. This shared
 experience underscores our call for empathy, unity, and
 urgent action. The stakes are too high and the wait too
 long for millions of our families.”

                                                                The Honorable Dr. David Satcher,
                                                                Former United States Surgeon General;
                                                                 Ms. Dolores Huerta, Founder of the Dolores
                                                                 Huerta Foundation and Member of the
                                                                 UsAgainstAlzheimer’s Brain Trust

Table of Contents
3    Executive Summary
5    The Changing Face of Alzheimer’s: Disparities in Alzheimer’s Disease
7    A Brain Health Equity Agenda for Alzheimer’s Disease
10   The Congressional Districts
13   Sources
13   Acknowledgments

An Data Brief on Congressional Districts and Alzheimer’s Prevalence among Communities of Color          2
Executive Summary
Social determinants of health (SDOH) have long-term, far-reaching, and not always obvious
ramifications in people’s lives—including their risk for Alzheimer’s disease and related
dementias (ADRD).1 This is clear from a close look at the counties most impacted by
Alzheimer’s among communities of color.
This data brief identifies the congressional districts that overlap with the 25 counties with the
highest prevalence of Alzheimer’s among Black and Latino Americans across the United States.
It highlights the systemic inequities prevalent in these counties and makes recommendations
for policymakers to advance brain health equity in hard-hit communities.
Whether in an urban area such as Miami-Dade County, Florida, or thousands of miles away in
more rural places such as Humphreys County, Tennessee, families living in the counties most
impacted by Alzheimer’s among Blacks and Latinos are connected by systemic inequities that
deserve urgent action.
These families are less likely to have health insurance, less likely to have access to exercise
opportunities, and less likely to have a bachelor’s degree or higher. At the same time, they are
more likely to have lower incomes and more likely to report poor health than families living in
counties with lower levels of Alzheimer’s disease.2
Public policy and public health have been slow to address the effects of place on overall
health, especially on brain health. Brian health is the ability to clearly think, learn, remember, it
also includes your motor and emotional functioning –all important components of performing
everyday activities.
Four policy actions can better target research investment, improve access to healthcare, and
promote public health interventions for under-resourced communities.
1. Invest in public health, treatment, 3. Establish an ambitious national goal to
and research infrastructure in prevent Alzheimer’s disease and related
communities hard-hit by Alzheimer’s dementias and address disparities in
and related dementias. early intervention and diagnosis.
2. Invest in educational and 4. Collect better data to identify and
economic opportunity to reduce address gaps in access to Alzheimer’s
social inequities. health services and research for
underserved communities.
An Data Brief on Congressional Districts and Alzheimer’s Prevalence among Communities of Color 3Executive Summary
THE CONGRESSIONAL DISTRICTS
Districts that Represent the Top 25 Counties with the Highest ADRD
16%
Prevelance Among Black Americans in Medicare Fee for Service
12%
District Prevalence of ADRD
10.55%
10.25% 10.27% 10.32% 10.39% 10.39%
10.03%
9.47% 9.52% 9.62% 9.68%
9.00% 9.03% 9.10% 9.16% 9.16%
8.84% 8.93% 8.94%
8.50%
7.94% 8.12%
8%
6.83%
4%
0%
NV 4th
IA 1st
KY 2nd
GA 12th
MO 8th
IN 6th
TX 3rd
NC 1st
TN 7th
TN 4th
KY 6th
TX 21st
IL 15th
MO 3rd
TX 10th
TN 8th
FL 2nd
LA 5th
TX 19th
TX 1st
TX 4th
MO 2nd
TX 27th
Districts that Represent the Top 25 Counties with the Highest ADRD
Prevelance Among Latinos in Medicare Fee for Service
16%
14.95%
District Prevalence of ADRD
11.91% 12.07%
12% 11.57%
11.40%
10.64% 10.78%
10.51%
10.20% 10.25%
9.95%
9.38%
9.16%
8.74% 8.81%
7.78% 7.92%
8% 7.44%
7.68%
6.28%
4%
0%
NM 3rd
LA 2nd
WA 4th
OH 10th
PA 12th
TX 23rd
LA 6th
TX 21st
GA 2nd
KS 1st
TX 13th
LA 5th
FL 23rd
FL 24th
TX 28th
TX 15th
FL 25th
TX 34th
FL 26th
FL 27th
An Data Brief on Congressional Districts and Alzheimer’s Prevalence among Communities of Color 4The Changing Face of Alzheimer’s
DISPARITIES IN ALZHEIMER’S DISEASE
Black Americans are approximately two times more likely,
and Latinos are 1.5 times more likely to develop Alzheimer’s
than non-Latino Whites.3 There has never been a more
urgent time to reduce Alzheimer’s in communities of color. If
nothing is done, by 2030 nearly 40 percent of all Americans
living with Alzheimer’s will be Latino or Black.
Unfortunately, despite higher risk, Black and Latino Americans living with
dementia are:
Less likely than White In a recent study of Medicare
beneficiaries, Black Americans (18.2%)
patients to receive a
and Latinos (15.8%) were less likely
timely diagnosis; to receive a timely diagnosis when
compared to Whites (23.3%).4
More likely to report Half of Black Americans (50%) and
experiencing racial one in three Latino Americans (33%)
report they have experienced
discrimination along healthcare discrimination.5
their patient and
caregiver journeys;
Less likely to be Latino and Black Americans make up
less than 10% of all clinical trial
enrolled in cutting-
participants in active ADRD research.6
edge Alzheimer’s and
brain health research.
An Data Brief on Congressional Districts and Alzheimer’s Prevalence among Communities of Color 5The Changing Face of Alzheimer’s
DISPARITIES IN ALZHEIMER’S DISEASE
PERCENTAGE OF FAMILIES LIVING IN POVERTY
9% 12%
15% 17%
UNDERSTANDING THE COUNTY-LEVEL IMPACTS Black
OF ALZHEIMER’S
Counties DISEASE
Latino Counties
The effects of where people live and other to SDOH among these
MEDIAN HOUSEHOLD highly impacted
INCOME
SDOH remain under-recognized and under- communities. $64,348.00 $62,656.00
studied in our national response to effectively $45,580 $46,456
target, treat, and prevent Alzheimer’s TheBlack Counties
report found Latino
significant Counties
social inequities
disease. To better understand which SDOH in counties highly impacted by Alzheimer’s
INDIVIDUALS UNDER THE AGE OF 65 WITHOUT HEALTH INSURANCE
intersect with Alzheimer’s in communities, among Latino and Black Americans compared
UsAgainstAlzheimer’s and the Urban Institute, to counties 7% with the lowest prevalence of 11%
the
14% 18%
with support from the National Minority disease among
Black Counties
Latino and Black Americans.
Latino Counties
Quality Forum, analyzed Medicare data to Counties with the highest prevalence of
identify the counties with the highest and Alzheimer’s among
INDIVIDUALS Blacks
WITH ACCESS TOand Latinos
EXERCISE are more
OPPORTUNITIES
lowest prevalence of Alzheimer’s by race likely to have worse SDOH83% outcomes than 77%
and ethnicity and identified trends related counties with the55% lowest prevalence of Alzheimer’s.
52%
Black Counties Latino Counties
Key findings on SDOH indicators include: Highest ADRD Prevalence Lowest Prevalence
PERCENTAGE OF FAMILIES LIVING IN POVERTY INDIVIDUALS UNDER THE AGE OF 65 WITHOUT HEALTH INSURANCE
PERCENTAGE OF FAMILIES LIVING IN POVERTY INDIVIDUALS UNDER THE AGE OF 65 WITHOUT HEALTH INSURANCE
9% 12% 7% 11%
9% 12% 7% 11%
15% 17% 14% 18%
Black Counties 15% Latino Counties 17% Black Counties 14% Latino Counties 18%
Black Counties Latino Counties Black Counties Latino Counties
MEDIAN HOUSEHOLD INCOME INDIVIDUALS WITH ACCESS TO EXERCISE OPPORTUNITIES
MEDIAN HOUSEHOLD INCOME INDIVIDUALS WITH ACCESS TO EXERCISE OPPORTUNITIES
$64,348.00 $62,656.00 83% 77%
$64,348.00 $62,656.00 83% 77%
$45,580 $46,456 55% 52%
Black Counties $45,580 Latino Counties$46,456 Black Counties 55% Latino Counties52%
Black Counties Latino Counties Black Counties Latino Counties
WHY SOCIAL DETERMINANTS OF HEALTH MATTER TO BRAIN HEALTH
Growing evidence suggests that dementia Under-resourced communities are at a
risk can be modified by brain healthy disadvantage in managing these risk factors,
behaviors, including effective management however, due to systemic inequities in
of hypertension, diabetes, and obesity. In education, access to exercise opportunities,
fact, the Lancet Commission released new and access to nutritious food. SDOH—and
research showing that managing a dozen risk policies that address them—must be part of
factors could prevent or delay approximately the solution to ensuring better brain health
40 percent of worldwide dementia cases.7 for all American families.
An Data Brief on Congressional Districts and Alzheimer’s Prevalence among Communities of Color 6A Brain Health Equity Agenda for Alzheimer’s Disease
A greater understanding of Alzheimer’s and the ways to
treat, delay or prevent the disease is creating new hope for
millions of individuals and families. But ensuring that hope
reaches all families regardless of zip code, income, race,
or ethnicity will take greater commitment, investment, and
policy change centered in health equity and social change.
POLICY RECOMMENDATIONS
1 Invest in Public Health, Treatment, ACTION STEP: For FY 2022, triple funding to $60
million for public health infrastructure for responding
and Research Infrastructure in to ADRD in communities through the Centers for
Communities Hard-Hit by Alzheimer’s Disease Control and Prevention’s Healthy Brain
Initiative, BOLD National Center of Public Health
and Related Dementias Excellence, and BOLD Public Health Programs. These
programs should be fully funded as part of efforts
There is limited public health and research to disseminate best-practices and translate research
infrastructure in underserved communities into communities and public health systems. Specific
aimed at improving early detection of ADRD funding should be dedicated to support programs
and strategies in communities and geographies with
and broadening access to treatments, care,
a high burden of ADRD.
and cutting-edge research for high-risk
communities. In fact, an analysis conducted ACTION STEP: For FY 2022, support a $289
by UsAgainstAlzheimer’s found extremely million in additional Alzheimer’s research funding
limited access to federally funded Alzheimer’s for the National Institute on Aging.
Research Centers in the U.S. counties most
ACTION STEP: Require an assessment of the
impacted by ADRD among patients of color.8
National Institute on Aging’s internal infrastructure
needs related to research operations, recruitment,
ACTION STEP: Dedicate funding, through the and engagement, with an emphasis on under-
FY 2022 appropriations process, for increasing represented communities. This review should (a)
the capacity of safety-net providers, including assess gaps related to the infrastructure needed
Federally Qualified Health Centers (FQHCs), to to ensure its federally funded clinical trials are
train staff to address disparities in access to ADRD successful and accessible to underrepresented
diagnosis, treatments, prevention, and care for communities at greatest risk of ADRD and (b)
underrepresented communities. Funding of safety- outline the resources needed to address identified
net providers should be dedicated to evaluating gaps, including the appropriate staffing levels
and increasing access to low-cost diagnostics needed to support research optimization, grant
for ADRD, including blood-based and electronic oversight, and compliance with federal regulations
biomarkers, and increasing access to available on diversity and inclusion.
treatments and care services.
An Data Brief on Congressional Districts and Alzheimer’s Prevalence among Communities of Color 7A Brain Health Equity Agenda for Alzheimer’s Disease
POLICY RECOMMENDATIONS
2 Invest in Educational and ACTION STEP: Promote policies to address
the social determinants of health and increase
Economic Opportunity to Promote opportunities for brain health across the life span,
Brain Health Equity including the following areas:
Education: Invest in a better understanding of
Advancing coordinated policies to overcome
how different education pathways (e.g., school
SDOH barriers to brain health could quality) affect brain health and how these
improve outcomes in later life for high-risk impacts vary across race and ethnicity. Invest in
communities. SDOH affects multiple health programs and policies that promote access to
issues, including brain health, and policy high-quality early childhood education.
solutions that target these factors—from
The Built Environment: Improve access to well-
economic opportunity to educational quality—
maintained parks and recreation facilities and
can improve health overall simultaneously catalyze community partnerships to improve
neighborhood walkability and livability.
ACTION STEP: Establish a paid family and medical
leave policy that covers family caregivers of older Food Security and Quality: Incentivize
adults and of people living with serious medical healthy food purchases among low-income
conditions such as ADRD. Expanding paid family Supplemental Nutrition Assistance Program
and medical leave policies for dementia caregivers (SNAP) beneficiaries. For example, explore
will have an outsized impact on people of color, public-private partnerships to bring healthy
who are more likely to provide care while working foods to low-income neighborhoods.
and are less likely to utilize formal care supports
when compared to White Americans.
3 Establish an Ambitious National Goal ACTION STEP: Update the National Alzheimer’s
Project Act to articulate a prevention goal and
to Prevent Alzheimer’s Disease and Re- identify the strategies for ensuring this goal is
lated Dementias and Address Disparities achieved equitably.
in Early Intervention and Diagnosis ACTION STEP: Incentivize and equip providers
with the tools they need to accurately detect
The U.S. should set a national prevention and diagnose Alzheimer’s at its earliest stages by
goal for Alzheimer’s and related dementias directing the Centers for Medicare and Medicaid
that is ambitious and achievable and ensures Services (CMS) to require the use of culturally
sensitive cognitive detection tools identified by
access to an early and timely diagnosis for
the National Institutes of Health.
high-risk communities. This goal must include
dates to strive for, a roadmap to guide the
efforts, metrics to measure progress along
the way, and a focus on healthcare equity that
recognizes the disproportionate impact of this
disease on communities of color and women.
An Data Brief on Congressional Districts and Alzheimer’s Prevalence among Communities of Color 8A Brain Health Equity Agenda for Alzheimer’s Disease
POLICY RECOMMENDATIONS
4 Collect Better Data to Identify and ACTION STEP: The Health Resources and Services
Administration (HRSA) should develop measures
Address Gaps in Access to Alzheimer’s and data collection strategies as part of the
Health Services and Research for Uniform Data System (UDS) to improve access
to Alzheimer’s and brain health–related services
Underserved Communities provided by federally qualified health centers.
To address disparities and promote equity, ACTION STEP: Require the National Institute of
we must ensure that health systems, Aging to report the recruitment and retention
researchers, and advocates have access levels of underrepresented communities across
federally funded ADRD research trials and sites,
to accurate and representative data on
releasing disaggregated recruitment data in real
Alzheimer’s and related dementias. For time. Funding decisions should consider the plans
example, federally qualified health centers of each applicant to engage, recruit, and retain
(FQHCs) are bedrock healthcare institutions underrepresented communities that reflect the
serving an extremely diverse, vulnerable, diversity of the site’s local community.
and rapidly aging population. However,
these health centers collect limited data on
Alzheimer’s and brain health–related services.
Moreover, despite deep disparities in ADRD
risk and clinical trial participation among
communities of color, disaggregated clinical
trial data are not regularly made accessible to
the public.
An Data Brief on Congressional Districts and Alzheimer’s Prevalence among Communities of Color 9The Congressional Districts
UsAgainstAlzheimer’s, with support from the National Minority Quality Forum,
identified the congressional districts that overlap with the 25 counties with the highest
ADRD prevalence among Black and Latino Americans.
Congressional Hot Spots by the Numbers
Number of Districts* 41
Total Number of 347,610
People Living with ADRD**
Total Medicare FFS Costs Spent on $8.5 billion
Beneficiaries living with ADRD in 2016**
Average ADRD District 9.50%
Prevalence in 2016**
Average Percentage of District Medicare FFS Dollars 26%
Medicare Dollars Spent on ADRD in 2016**
*Number of Districts That Represent the 25 Counties with the Highest Rates of ADRD Among Blacks and
Latinos, Medicare Fee for Service, 2016
**Medicare Fee for Service, 2016
District Calculation Methodology: The alignment of beneficiaries to Congressional
Districts is not directly defined in the Medicare data set. Because of this, the National
Minority Quality Forum – our platform developer – developed a crosswalk methodology
to allow the NADEX to make the best association based on known information about
the beneficiary and zip codes associated with U.S. Congressional Districts. A document
detailing the crosswalk methodology is available from NMQF upon request.
An Data Brief on Congressional Districts and Alzheimer’s Prevalence among Communities of Color 10The Congressional Districts
Congressional Districts that Represent the Top 25 Counties
with the Highest ADRD Prevelance Among Black Americans
(Medicare Fee for Service, 2016)
Percentage of All
All Medicare FFS
Congressional Total ADRD patient District Total AD Medicare FFS Costs
State Costs Spent on ADRD
District population in District Prevalence Spent on ADRD
Beneficiaries in District
Beneficiaries in District
TX 27th 8,862 10.55% $246,792,772 30%
MO 2nd 10,239 10.39% $213,058,930 27%
TX 4th 12,122 10.39% $344,299,941 29%
TX 1st 10,634 10.32% $278,056,622 28%
TX 19th 8,803 10.27% $219,127,927 27%
LA 5th 11,612 10.25% $345,387,551 30%
FL 2nd 8,742 10.03% $201,645,769 26%
TN 8th 11,378 9.68% $246,407,722 25%
TX 10th 7,478 9.62% $211,663,005 29%
MO 3rd 9,616 9.52% $197,941,385 24%
IL 15th 12,120 9.47% $255,962,631 23%
TX 21st 9,419 9.16% $234,362,061 29%
KY 6th 8,387 9.16% 187,889,421 26%
TN 4th 9,004 9.10% $198,849,695 24%
TN 7th 9,476 9.03% $207,567,222 24%
NC 1st 8,761 9.00% $194,371,689 22%
TX 3rd 6,120 8.94% $175,671,164 28%
IN 6th 11,176 8.93% $260,545,244 24%
MO 8th 12,686 8.84% $262,669,349 22%
GA 12th 7,167 8.50% $157,189,485 22%
KY 2nd 9,431 8.12% $199,589,874 21%
IA 1st 8,958 7.94% $143,209,905 17%
NV 4th 5,135 6.83% $197,198,148 27%
An Data Brief on Congressional Districts and Alzheimer’s Prevalence among Communities of Color 11The Congressional Districts
Congressional Districts that Represent the Top 25 Counties
with the Highest ADRD Prevelance Among Latinos
(Medicare Fee for Service, 2016)
Percentage of All
All Medicare FFS
Congressional Total ADRD patient District Total AD Medicare FFS Costs
State Costs Spent on ADRD
District population in District Prevalence Spent on ADRD
Beneficiaries in District
Beneficiaries in District
FL 27th 8,146 14.95% $248,038,515 36%
FL 26th 6,194 12.07% $183,608,784 33%
TX 34th 7,694 11.91% $204,905,937 31%
FL 25th 7,004 11.57% $193,476,893 30%
TX 15th 6,769 11.40% $183,267,851 30%
TX 28th 8,075 10.78% $228,499,488 32%
FL 24th 4,561 10.64% $159,632,401 29%
FL 23rd 5,896 10.51% $180,777,987 30%
LA 5th 11,612 10.25% $345,387,551 30%
TX 13th 10,535 10.20% $273,856,644 27%
KS 1st 12,661 9.95% $249,798,543 22%
GA 2nd 7,849 9.38% $169,734,333 24%
TX 21st 9,419 9.16% $234,362,061 29%
LA 6th 7,036 8.81% $173,875,996 25%
TX 23rd 7,163 8.74% $187,415,524 27%
PA 12th 5,553 7.92% $139,520,136 27%
OH 10th 6,385 7.78% $162,138,851 23%
WA 4th 7,901 7.68% $149,124,936 19%
LA 2nd 4,454 7.44% $119,464,347 22%
NM 3rd 6,408 6.28% $130,515,132 18%
An Data Brief on Congressional Districts and Alzheimer’s Prevalence among Communities of Color 12Sources
1. Social Determinants of Health and Alzheimer’s Disease and Related Dementias. (n.d.).
Alzheimer’s Disease and Healthy Aging. Retrieved 2021, from
https://www.cdc.gov/aging/disparities/social-determinants-alzheimers.html
2. Mudrazija, Stipica, Vega, William A., Resendez, Jason, Monroe, Stephanie. (2020).
Place and Brain Health Equity: Understanding the County-Level Impacts of Alzheimer’s.
UsAgainstAlzheimer’s and the Urban Institute.
3. Aranda, Maria P., Vega, William A., Richardson, Jason R., Resendez, Jason. (2019). Priorities
for Optimizing Brain Health Interventions Across the Life Course in Socially Disadvantaged
Groups. Florida International University and UsAgainstAlzheimer’s.
4. Tsoy E, Kiekhofer R.E., Guterman E.L., et al. (2021). Assessment of Racial/Ethnic Disparities
in Timeliness and Comprehensiveness of Dementia Diagnosis in California. JAMA Neurol.
Published online March 29, 2021.
https://doi.org/10.1001/jamaneurol.2021.0399
5. Alzheimer’s Association. (2021). Race, Ethnicity and Alzheimer’s in America.
https://www.alz.org/media/Documents/alzheimers-facts-and-figures-special-report.pdf
6. Development of an NIA Practice-Based Research Network to Conduct Alzheimer’s and
Related Dementias Clinical Research. (2021). National Institute on Aging.
7. Livingston, G., Huntley, J., Sommerlad, A., et al. (2020). Dementia Prevention, Intervention,
and Care: 2020 report of the Lancet Commission. The Lancet, 396(10248), 413–446.
https://doi.org/10.1016/s0140-6736(20)30367-6
8. Massett, H. (2021, January 12). An Update on the National Institute on Aging’s Clinical
Research Recruitment and Retention Initiatives [Slide 31]. Presented to the National
Advisory Council on Aging (NACA) Task Force for Minority Aging Research (TFMAR).
https://www.nia.nih.gov/about/naca
Acknowledgments
UsAgainstAlzheimer’s exists to conquer Alzheimer’s disease. We take on the toughest
problems; bring all of “Us” together to break down barriers; advocate for research
that will speed treatments to market; and drive changes that matter most to people
living with the disease. We will not rest until brain-span equals lifespan - for everyone.
UsAgainstAlzheimer’s is grateful for the technical support provided by the National
Minority Quality Forum and for the financial support of our philanthropic partners
who made this report possible, including the Zickler Family Foundation, Genentech,
Eli Lilly, Eisai, and Biogen. Funders do not determine research findings or the insights
and recommendations of UsAgainstAlzheimer’s. UsAgainstAlzheimer’s gratefully
acknowledges the members of the National Alzheimer’s Disease IndexTM (NADEX)
data
An Dataworking group for
Brief on Congressional theirand
Districts insights and
Alzheimer’s guidance.
Prevalence among Communities of Color 13You can also read