COVID-19 Updated look at US media implications
←
→
Page content transcription
If your browser does not render page correctly, please read the page content below

COVID-19
Updated look at US
 media implications

      ISSUE #3   |   APRIL 9, 2020
EXECUTIVE SUMMARY

Americans are optimistic     Ad spending is down,        The extreme growth in        More and more
    about economic          especially in traditional    TV viewing and video    advertisers now directly
 recovery, but uncertain   media, despite increased     streaming have slowed;    addressing the crisis in
  on timing – currently    usage on many platforms      audio streaming mostly     messaging, as brands
thinking we are months,       – leading to some            stable or up, while   look to secure long-term
    not weeks away           opportunistic pricing         podcasts are down           share of mind
Issue #3 agenda

   Consumer insights   Location data

   Industry outlook    Online traffic, sales

   Channel updates     Brand responses

Consumer
insights
Evolving behaviors,
habits, interests

Index of consumer sentiment

                                                                        Consumer confidence
                                                                        collapses in April

                                                                        US jobless claims
                                                                        now exceed 16 million

5   Source: University of Michigan; NYT / US Department of Labor
US optimistic about economic recovery
About 40% expect to see a                                                            Optimism highest for high-income
recovery within 2-3 months                                                           households, pessimism lowest for Gen Z

6   Source: McKinsey, Survey: US consumer sentiment during the coronavirus crisis, Apr 2020

Consumers continue to cut back spending
Most believe routines and finances                                                    Uncertainty is holding back purchases
will be impacted at least two months                                                  as consumers shop carefully

7   Source: McKinsey, Survey: US consumer sentiment during the coronavirus crisis, Apr 2020

About 40% expecting income reductions
Both income and spending expected                                                       Gen Z expects the most income
to decrease in the next two weeks                                                       reduction, but spending most resilient

8   Source: McKinsey, Survey: US consumer sentiment during the coronavirus crisis, Apr 2020
Lower spending affecting most categories
Spending expected to decline over                                                             Some categories seeing growth
the next two weeks across categories                                                          in online purchase intent

9   Source: McKinsey, Survey: US consumer sentiment during the coronavirus crisis, Apr 2020
Americans adopting new digital activities

10   Source: McKinsey, Survey: US consumer sentiment during the coronavirus crisis, Apr 2020
Most making limited trips outside the home
                                                     In the past week, how many
                                                     times have you left your home
                                                     to visit a store, restaurant, or
                                                     other retail establishment?

                                                               More than 20     0.4%

                                                                    10 to 20    1.8%

                                                                       4 to 9      15.9%

                                                                       1 to 3                  64.6%

                                                      Have not left my home
                                                                                       17.5%
                                                     for any of those reasons

11   Source: Resonate Flash Study, Mar 22-29, 2020
12 Source: visualcapitalist.com/media-consumption-covid-19, Global Web Index
13 Source: visualcapitalist.com/media-consumption-covid-19, Global Web Index
How our lives could change… permanently
 Evolving climate                                                  More working
 change debate                                                     from home
 Global pollution levels                                           Prolonged shift may
 falling due to shutdown                                           lead to full time moves

 More access to                                                    More local,
 broadband for all                                                 sustainable living
 Crisis showing internet                                           Less globally-produced
 crucial for infrastructure                                        food and less waste

14   Source: Goldman Sachs, Mar 30, 2020; MediaPost Mar 27, 2020
Industry
outlook
Latest on advertising
demand, pricing
Most advertisers cutting back spending

                                                                              Estimated
                                                                         spend change
                                                                       vs. original plan

16   Source: IAB Coronavirus Ad Spend Impact: Buy Side, Mar 27, 2020
Traditional media taking more of the hit 17 Source: IAB Coronavirus Ad Spend Impact: Buy Side, Mar 27, 2020
Political ad spending plummets in March
 National TV airings and estimated spend
      10,775                                  $76.8          Surge in Feb driven largely by
                                                             Bloomberg and Steyer campaigns

                       475                            $2.3   Dropoff in Mar largely expected as
                                                             candidates are settled, with next
             Airings                            Spend (M)    major peak typically stretching
            Feb       Mar                                    from Labor Day to Election Day

18   Source: MediaPost / iSpot, Apr 3, 2020
Digital ad rates down despite higher usage In a new report from IAC, Facebook CPMs fall to all-time low digital ad rates are down by 30% More impressions available on many sites and platforms given increased use, but lower ad demand pulling down costs 19 Source: Barron’s / IAC Apr 7, 2020; MediaPost / Gupta Media Apr 8, 2020
Channel updates
Updated reads on
video, audio, & more
TV viewing continues to climb, albeit slightly

21   Source: Simulmedia, data through Apr 3, 2020
Deeper dive on select networks
 News still up big, sports nets ailing

22   Source: Simulmedia, data through Apr 3, 2020
Changes in viewership by hour and daypart

23   Source: Alphonso, TV & The COVID-19 Pandemic, Apr 8, 2020
Major streaming players gaining share
 Video streaming share and volume                                                   Video streaming minutes per week
 weekly vs. year ago                                                                weekly vs. year ago

24   Source: Nielsen Streaming TV Update: Key Trends During COVID, Apr 1, 2020, based on P2+
Streaming nearly a quarter of total TV usage
 Streaming share of total TV usage                                               Top 10 SVOD programs: 3/9-3/15/20
 weekly vs. year ago, among capable HHs

                                                                                 Top 10 SVOD programs: 3/16-3/22/20

25   Source: Nielsen Streaming TV Update: Key Trends During COVID, Apr 1, 2020
Netflix’s Tiger King a unique phenomenon
Reach (persons 2+ in millions) 36.3
34.3
first 10 days following release
31.2
Series pulled in huge audiences
without pre-launch marketing or hype
10-day reach on par with other big hits
Tiger King Stranger Things S2 Stranger Things S3
11.4 11.2 11.1
10.3 10.7 10.4 10.4 10.4
9.0 8.7
7.4 7.5
6.4 6.9
6.0 5.6 5.4 5.5
4.8 4.8 5.0 5.1 5.2
4.2 4.3 4.4
3.3 3.5
0.7 2.2
Day 1 Day 2 Day 3 Day 4 Day 5 Day 6 Day 7 Day 8 Day 9 Day 10 Total 10 Days
26 Source: Nielsen Streaming Meter Insights on SVOD Viewing, Apr 9, 2020TV vs. streaming usage varies by market Increase in linear TV consumption Increase in OTT consumption by state by state 27 Source: Alphonso, TV & The COVID-19 Pandemic, Apr 8, 2020
Redefining “live” entertainment…
NASCAR
NASCAR               E-sports
                     Esports
“Virtual Bristol”    Madden
drew just 29% of     invitational
the audience from    tournament with
the 2019 live race   the pros on FS1

Wrestlemania
Wrestlemania         Live music
Empty sets still     International
bring in huge        livestream
captive audience:    performances
                     at a grand scale
967M video views
+20% YOY
COVID-19 changing how we internet
We are looking to connect and Virus update searches driving up
entertain ourselves, but are readership for local and established
turning away from our phones newspapers, but not partisan sites
Change in average monthly US traffic
30 Source: New York Times, Apr 7, 2020 (SimilarWeb, Apptopia data through Mar 24, 2020)Video chats and conferencing booming
We are seeking out new ways to We are suddenly reliant on services that
connect, mostly through video chat allow us to work and learn from home
Daily app sessions for popular apps
31 Source: New York Times (SimilarWeb, Apptopia), Apr 7, 2020C-19 drives short term app download boom Normalized downloads after C-19 Download spike following C-19 App store and Google Play installs by Initial frenzy driven by new needs, e.g. country following 1,000th confirmed case video chat and grocery delivery apps 32 Source: Sensor Tower 2020-2024 Mobile Market Forecast, Apr 2020
Disney+ beating Netflix in US downloads
 Top 10 downloaded streaming apps                    Top 10 streaming apps by IAP revenue
 Jan-Mar 2020                                        Jan-Mar 2020

33   Source: Apptopia, 2020: The Year of Streaming
Unique apps emerge amid a new reality
 Quibi launched 4/6, pushing ahead            Quarantine Together launched 3/15,
 with short-form premium video                looking to help the isolated find love
 App designed for short attention spans now   #FlattenTheCurveTogether
 finds an audience with plenty of free time

34
Audio streaming use mostly flat or up
 Changes in listening to streaming
 music, radio, or podcasts since C-19
                                             69%
                                                                                                        • Midday consumption up
                                                                 23% using more
                                                                                                        • Weekday use of connected devices now on par with weekend use
                                                                13%         7%
     2%          2%            4%                                                          3%           • Rap and Pop still top genres, but more local subgenres on the rise
Decreased to Decreased to Decreased to
a large extent a moderate a small extent
                                           Stayed the
                                             same
                                                         Increased to a Increased to a Increased to a
                                                          small extent    moderate      large extent
                                                                                                        • Playlist sharing increasing, first quarantine related, now more chill
                 extent                                                     extent

 Which streaming music / radio
 services are you now using more?                                                                       • Majority (>50%) spending the same amount of time per device
     29%                                                                                                • 42% of listeners spending more time with audio
                    23%
                                    19%
                                                        13%
                                                                                                        • 59% spending more time listening alone
                                                                         9%               7%
                                                                                                        • 34% spending more time co-listening
     Spotify       Pandora      Amazon Prime            Other         iHeartRadio     Apple Music       • 18% spending more time with podcasts
                                   Music

35     Source: Resonate, Mar 2020; Pandora Soundboard Study, Mar 2020; Spotify
Podcast audiences drop as fewer commute US weekly downloads down 10%, Behavior shifting to more unique listeners down 20% in March constant usage throughout the day YTD weekly growth rate 36 Source: Podtrac Apr 5, 2020; Megaphone Mar 25, 2020
News podcasts hanging on, sports down big
 US weekly downloads: top categories   US weekly downloads: all categories
 YTD growth                            YTD growth

37   Source: Podtrac Apr 5, 2020
Consumers worried about safety of print

 70% are concerned about
 safety of reading a delivered
 print magazine, journal,
 catalog, or newspaper

 54% are more likely to
 consume digital content over
 print while social distancing

 Several weekly, some daily
 newspapers have either
 reduced or suspended printing

38   Source: MediaPost, Apr 3, 2020 (Changing Magazine Habits Due to COVID-19, BlueToad)
Location data
Recent trends for
select categories
Google mobility tracker regional trends
                                                                                       Manhattan
 Grocery & pharmacy visitation change
 by state, week ending 3/29

                                                                                       LA County

40   Source: Geopath / Intermx COVID-19 Data Update, Apr 06, 2020; Google Mobility Tracker
NinthDecimal: weekly changes in foot traffic 41 Source: NinthDecimal COVID-19 Impact 2020, Apr 7, 2020
Placer.ai: Retail Impact Tracker
 Select grocery

42   Source: Placer.ai Retail Impact Tracker, through Apr 4, 2020
Online traffic,
ecom sales
Insights from
Morgan Stanley, plus
SimilarWeb, Stackline,
and Criteo updates
Morgan Stanley: outlook for select brands
 Stronger post downturn                                                             Cautious short term

                                  Major shifts to ecommerce                                         Greater instability in competition

                                  More utility-like model                                           Higher pipeline uncertainty

                                  More gaming at home                               Weaker post downturn

                                                                                                    High local / SMB exposure
                                  First platforms where
                                  ad dollars should return
                                                                                                    Large ticket item, storefronts

                                  Heightened focus on health
                                                                                                    Long term uncertainty,
                                                                                                    restructuring, liquidity constraints
                                  Stocking up on pet supplies

44   Source: Morgan Stanley, Who Will Be Stronger After the Storm…and Why, Mar 30, 2020
SimilarWeb online traffic by sector 45 Source: SimilarWeb, data through Apr 7, 2020
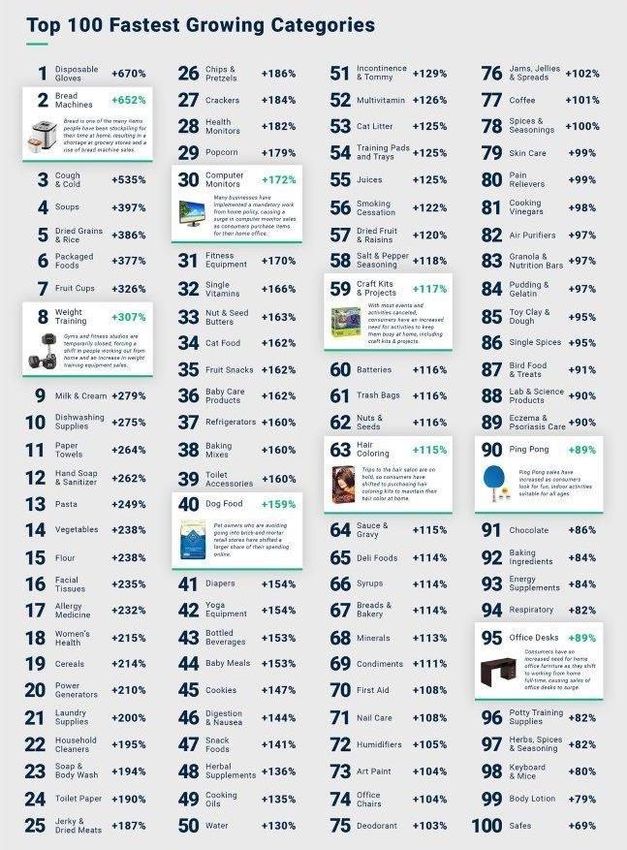
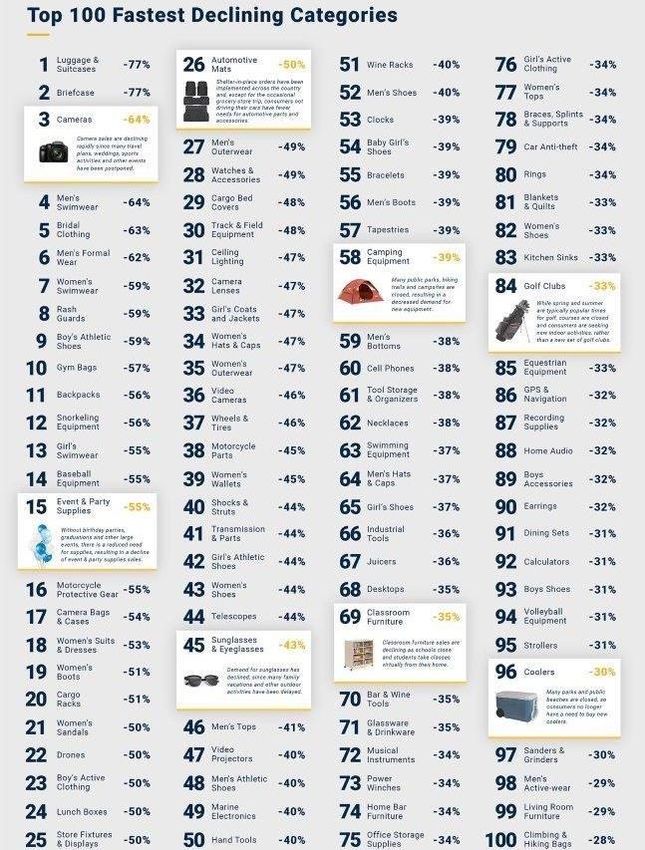
Fastest growing / declining e-com categories

46
Criteo indexed weekly online sales

47   Source: Criteo, based on verified client sales trackers, indices compared to average of 1/1/19-1/28/19
Criteo indexed weekly online sales

48   Source: Criteo, based on verified client sales trackers, indices compared to average of 1/1/19-1/28/19
Criteo indexed weekly online sales

49   Source: Criteo, based on verified client sales trackers, indices compared to average of 1/1/19-1/28/19
Criteo indexed weekly online sales

50   Source: Criteo, based on verified client sales trackers, indices compared to average of 1/1/19-1/28/19
Brand responses
How marketers are
reacting to the crisis
Most brands shifting messaging, strategy
 ANA: 92% have adjusted creative                                                     IAB: Mar-June messaging strategy
 messaging since mid-March                                                           shifting away from performance

     • Refocused to reflect empathy

     • Pulled price-item for “we’re here for you”

     • Favored emotional messaging around
       social distancing over hard selling

52     Source: ANA survey, Mar 30-31, 2020; IAB Coronavirus Ad Spend Impact: Buy Side, Mar 27, 2020
McKinsey: think and act across 5 horizons 53 Source: McKinsey COVID-19: Implications for business
Edelman Trust Barometer guidance

54   Source: Adweek, Mar 31, 2020
Common themes across select cateogories

55   Source: Alphonso, The Coronavirus Effect: TV Genres, OTT & Streaming Trends
Retailers offer stay at home apparel deals
 Nordstrom                                   Macy’s          Gap              Saks

 J Crew                                      Anthropologie   American Eagle   Revolve

56   Source: Business Insider, Apr 5, 2020
Leveraging the
Marketing Team
for agile creative
58
You can also read