New Build Homes Resident Survey 2021 - Mid Devon District ...
←
→
Page content transcription
If your browser does not render page correctly, please read the page content below
New Build Homes
Resident Survey 2021

                   i
Executive Summary
Moves
63% of moves to New Build Homes in Mid Devon are from within the District. 88% of moves
are from either within the District or from Local Authority areas adjoining Mid Devon.
Tenure
Majority of tenure in new build homes rests in home ownership (91%). In comparison the
households’ previous situation whereby 57% were in home ownership.
Shared ownership amounted to 16%, in contrast with 0% in households’ previous situation.
Majority of movement in tenure was from private rent to own with a mortgage.
Demographics
Average household size in new build homes is 2.54. 40% were made up of two person
households. Households greater than two persons made up 42%, with the majority of these
households including individuals in education or under school age.
Homeworking
57% have some form of homeworking with 88% identifying there was enough flexibility in
their home to accommodate their working from home needs permanently.
Travel
At the time of the survey 46% did not commute to work.
The motor vehicle is the dominant form of travel for all distances. Walking however made up
43% of journeys where destinations were 1 mile or less.
Quality of pedestrian and cycle routes and proximity to employment are the top two reasons
that would encourage people to use their car less.
Home satisfaction
The attraction of a new build home and opportunity to own their own home were the top
two reasons people chose to move to a new build home.
40% of those that have access to a garage use it for their car. 90% use it for storage.
Overall there is a good level of satisfaction from residents in their new build homes with an
average of over 3.4 out of 5 for every feature listed in the survey.
Privacy and noise insulation are the top two areas that people would like improved in their
new build home.
Neighbourhood Satisfaction
Overall there is a moderate level of satisfaction of their neighbourhood from residents in
new build homes with an average of over 2.7 out of 5 for every feature listed in the survey.
The top features in a neighbourhood residents are happy with are schools, safety, character
and appearance and noise.
The lowest rated feature and the only item that scored less that 3 out of 5 was pedestrian
and cycle routes. This was also the top area that people would like improved in their
neighbourhood both in quantity and quality.
ii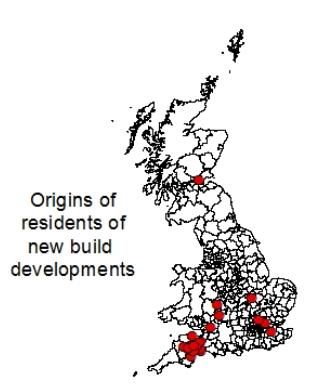
Contents
 Chapter                                   Page
 1. Introduction                           1
 2. Methodology                            2
 3. Migration, tenure and demographics     3
 4. Homeworking, transport and commuting   8
 5. Home satisfaction                      13
 6. Neighbourhood satisfaction             18
 7. Summary of Findings                    21
 8. Annex 1                                22
 9. Annex 2                                25

                                                  iii
1. Introduction
1.1. Mid Devon District Council (MDDC) launched its first New Build Homes Resident Survey in
2021. The goal of the survey is to understand how successful a new build development is
from a resident’s perspective in Mid Devon. The findings will help inform our understanding
of what makes a great place for people to live, work and enjoy, and we can use this
information to help us shape the future of our local area through the Council’s work. Over
time, the annual survey will help us build a picture across the District and identify trends.
1.2. The Council adopted its Corporate Plan in January 2020 covering a four-year period of 2020-
2024. Our Corporate Plan is a document that sets out what we want to achieve in the
district to support and enrich our communities, businesses and the environment we live in.
The Corporate Plan identified four key priority areas to ensure which are the focus of our
work. They are:
1. Homes
2. Environment
3. Community
4. Economy
1.3. The New Build Homes Resident Survey particularly supports the Homes and Community
priorities in the Corporate Plan. It also provides some insight and support to the
environment and economy priorities through the relationship between home, work and the
environment. The findings from the survey will help support decision making, including data
useful in the development of plan-making such as the Local Plan.
1.4. The topic areas covered in this annual survey are set out below and are reported in the
following chapters within this document.
Migration, tenure and demographics
Homeworking, transport and commuting
Home satisfaction
Neighbourhood satisfaction
12. Methodology
2.1. The survey provided at Annex 1 of this report in 2021 was sent to 315 households in
Tiverton, Cullompton, Crediton, Bampton, Copplestone, Cheriton Fitzpaine, Hemyock,
Newton St Cyres, Uffculme and Willand. Only major new build developments (10+) were
included in the survey sample so that the new build neighbourhood context would be
relevant for all recipients. The households were identified using MDDC’s monitoring of
housing completions for the previous monitoring year 2019/2020 (excluding Dartmoor
National Park which is administered by Dartmoor National Park Authority). As such, by the
time a household received the survey they may have been in their new home for just a few
months to up to approximately 2 years.
2.2. The survey was sent out to the above households early February 2021 along with a postage
paid return envelope. A covering letter explained the purpose of the survey and provided
the opportunity to respond online. All completed surveys in this report were returned by
mid May 2021. Of those that received the survey 65 responses were received which
represents a 20.6% response rate. A response rate of between 20-30% is considered to be
highly successful1.
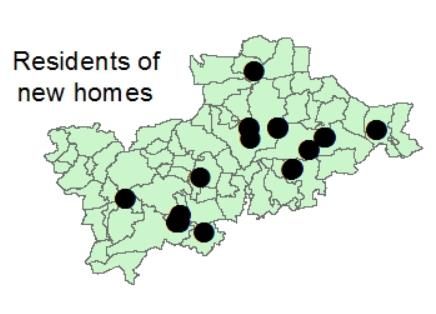
2.3. Individual responses provide a unique and irreplaceable insight into residents’ views of their
new build home and neighbourhood. This report presents the qualitative survey results and
provides statistical illustrations through graphs and analysis.
MAP 1: Locations of returned surveys
1
https://www.surveymonkey.com/mp/sample-size/
23. Migration, tenure and demographics
Migration
3.1. The following question was included in the survey to help us understand the local housing
market for new build development in Mid Devon. The data helps us attune assumptions in
housing demand, migration patterns and helps to answer a frequently asked question of
‘Where have residents living in new homes come from?’
3.2. Fifty-nine of the sixty-five respondents provided both their current and previous postcodes.
A summary of findings is provided in Table 1 below. This identifies that the majority of
moves are within the District at 63%. When considering those further afield, 25% are from
adjoining Local Authority Areas, 3% are from the South West and 9% are from the rest of
the UK. When combining these figures, 88% of moves are either from within the District or
from adjoining Local Authority areas and 91% are from the South West area. A full
breakdown by Parish is provided at Annex 2.
Moves into new developments from: Total
Within the District 37 moves
63%
Adjoining Local Authority Areas 15 moves
25%
South West 2 moves
3%
Rest of UK 5 moves
9%
Table 1: Moves into new developments
3.3. The median distance moved by those that responded to this survey was an average of 6
miles. In comparison to national data2 the median distance moved by UK movers was 9
miles.
3.4. Nationally 40% moved within 5-miles of their previous home with 51% of moves measuring
under 10 miles and nearly two thirds under 20 miles. Comparably, the Mid Devon New
Build Homes Survey demonstrates that these moves are more local than the statistics
identified nationally with 44% of moves within 5 miles, 63% under 10 miles and 84% within
20 miles.
2
https://www.propertyreporter.co.uk/property/op-ten-home-moving-statistics-of-2019.html
https://www.reallymoving.com/help-and-advice/guides/uk-moving-distance-map
3Distance of move No. of moves Percentage
5 miles or less 27 44%
6-10 miles 12 19%
11-20 miles 13 21%
21-40 miles 2 3%
Long distance moves (+80 miles) 8 13%
Table 2: Distance of moves by miles
Distance of move Total moves Percentage
5 miles or less 27 44%
10 miles or less 39 63%
20 miles or less 52 84%
40 miles or less 54 87%
All moves 62 100%
Table 3: Distance of move by miles combined
MAP 2 : Origins of residents of new build developments
4Tenure
3.5. Two questions were included the Survey to help understand the tenure of new homes and
how this may have changed from a homeowners previous situation. As this survey
continues annually these two questions will help us identify trends in Mid Devon that may
change over time.
3.6. Sixty-four of the returned surveys completed the questions on tenure. The following Charts
1 and 2 demonstrates that the majority of tenure in new build homes rests in home
ownership either with mortgage, owned outright or shared ownership. One respondent
opted ‘other’ in the survey and specified that they owned shared ownership with a
mortgage. As such in totalling those in home ownership this amounts of 91% of those that
responded to this survey in new build homes. This in comparison to the households’
previous situation, whereby only 57% were home ownership. What is striking in the findings
is the opportunity that new build homes provide in a share ownership product, which
amounted to 16% (when including 2% of those that responded ‘other’ as explained above),
in contrast to 0% in the households previous situation. The majority of movement in tenure
was from those previously in private rent to own with a mortgage.
3.7. Question 16 of the survey provided the opportunity for any other comments about the
residents’ home and neighbourhood. One person did question the benefits of shared
ownership in comparison to other home ownership opportunities, given the mechanism of
shared ownership requires rent on the proportion of the home not owned.
5Chart 1: Q3 Do you own or rent your new build home? Chart 2: Q4 At your previous address what was your situation?
6Demographics
3.8. The following question was included in the survey to help understand the general
demographics of new build homes.
3.9. Findings show that the average sized household is 2.54 in our sample. This is higher than
the average household size for Mid Devon at 2.35 as of Census 2011 and the 2.24 average
household size for the South West (2019 ONS). Of those surveyed, the largest proportion of
household type was made up of two persons 40%. This is similar to the proportion of two
person households in the South West of 39% (2019 ONS) and that of Census 2011 in Mid
Devon (38%). Of the two person households 60% of people were working. Households
greater than two persons make up 42%, and of these households, all but one household
included individuals in education or were under school age. The greatest difference
between the findings of the demographics of this survey in comparison to the Mid Devon
Census 2011 data is a higher proportion of four person households at 25% in comparison to
13% in Census 2011 and a smaller proportion of single person households at 18% in
comparison to 27% in Census 2011.
Household Size
3%
18%
25%
14%
40%
1 2 3 4 5
Chart 3: How many people are at your household?
74. Homeworking, transport and commuting
Homeworking
4.1. During the time of the survey in Spring 2021, the UK and the world were in the midst of the
Covid-19 pandemic. Covid-19 is a contagious disease caused by severe acute respiratory
syndrome coronavirus 2 (SARS-CoV-2). It was first declared by the World Health
Organisation as a pandemic 11 March 2020. Various measures were introduced in England
during the pandemic to minimise social contact. At the time of the New Build Homes
Resident Survey 2021, homeworking was encouraged by National Government. For those
unable to work due measures introduced to minimise social contract, a Furlough scheme
was in place. For clarity, participants were asked to answer questions on homeworking,
transport and commuting as their situation was ‘at the time of answering this survey’. The
data provided from these questions will help understand the capacity of homeworking in
our existing new build developments, travel habits and views on reducing car usage.
.
812%
88%
Yes No
Chart 4: Q6 At the time of answering this survey, do you work from Chart 5: Q7 Is there enough flexibility in your home to accommodate your
home? working from home needs permanently?
4.2. Findings show that just over half (57%) of those that responded have some level of homeworking with 31% currently always working from home. For those
working from home 88% identified that they have enough flexibility in their home to accommodate their working from home needs permanently. Those that
identified that there was not enough flexibility, key reasons included lack of space and broadband speed.
9Transport and commuting
4.3. At the time of the survey almost half (46%) of all those that responded did not commute to
work. The remainder commuted a varying number of days. The survey question on
commuting will allow us to identify trends in commuting patterns over time as the survey is
launched annually. For 2021 it should be noted the level of those commuting to work is
likely to be lower than that which may be typical, given the National Government
Restrictions and advice at the time of the survey which encouraged homeworking where
possible, and the Furlough Scheme that was in place.
Number of days commuting per week
50%
45%
40%
35%
30%
25%
20%
15%
10%
5%
0%
0 1 2 3 4 5 6 7
Chart 6: Q8 At the time of answering this survey how often do you commute to work?
4.4. Following this question, participants were asked how they and others in their household
travelled to work or education. One hundred entries were submitted specifying the purpose
of their travel (school/work), their destination and their form of travel. Analysis of this
question identifies that of those that commute to work or travel for education the majority
use a motor vehicle. A breakdown of findings is provided below:
1. 78 motor vehicle
2. 12 walk
3. 7 bus
4. 1 cycle
5. 2 train
4.5. Table 4 and Chart 7 demonstrates a breakdown of mode of transport by distance. This
analysis provides a detailed breakdown of 1-3 miles, given that up to 3 miles is considered
by the Department for Education as reasonable walking distances from schools3. Findings
from this study however indicates that walking is used a mode of transport only where
journeys are 1 mile or less, but within this distance walking makes up 43% of all journeys.
Bus journeys featured where journeys were between 3 and 20 miles. Only 1 person cycled
3
https://www.gov.uk/government/publications/home-to-school-travel-and-transport-guidance
10to work and only 2 used the train. In all distances, the motor vehicle remained the
dominant form of travel.
4.6. When comparing the reason for the journey i.e. school or work, school journeys made up
30% of responses and work 70%. For school journeys 5 walked, 20 travelled by motor
vehicle and 5 used the bus. For work journeys 3 walked, 58 travelled by motor vehicle, 2
used the bus, 1 cycled and 2 used the train. This largely follows the trend demonstrated in
the 2011 Census data for Mid Devon, although the greatest difference in comparison is a
greater use of the motor vehicle and less travel by foot by those that responded to this
2021 survey. With 69% in Census 2011 travelling to work by motor vehicle and 25% by foot,
whereas this survey has identified for journeys to work 82% travelled by motor vehicle and
only 4% by foot.
Mode of transport Walk Vehicle Bus Cycle Trainthat featured the least as a reason to use their car less was access to car club/sharing. The
features are listed below in order of the most likely feature that would make people use
their car less.
1. Quality of pedestrian and cycle routes. Proximity to employment.
2. Frequency of public transport.
3. Continuous pedestrian and cycle links.
4. Cost of public transport.
5. Access to public transport. Ability to work from home.
6. Access to car club/sharing.
Chart 8: Q10 What would make you use your car less?
4.8. Of the ‘other’ reasons provided by participants which would make them use their car less,
the majority of participants gave reasons why they would not use their car less. The reasons
provided included:
1. Rural nature of the area.
2. Public transport routes are indirect and therefore too slow.
3. Car required for work.
4. The time required as an alternative to the car takes too long e.g. school drop off then
work.
5. Already have a good working from home balance.
125. Home satisfaction
5.1. The following questions were included in the survey to help understand the reasons why
people moved home, their level of satisfaction of their new home and if they had access to
a garage, what they used that space for.
Reason for move
5.2. Participants were able to opt for more than one answer to question 2 ‘Why did you move to
your new build home?’, and as such the percentages shown in Chart 9 show the percentage
of the total number of participants for each option. Findings show the top reason people
move to their new home is their general attraction of a ‘new build home’ at 55% of
respondents. Second to that was the opportunity of home ownership which amounts to
32%. The lowermost reasons for their move was for school(s) in the area or that it was
within a town. The reasons are ordered below with 1 being the highest rated reason people
moved to their new build home:
131. Attracted to a new home
2. To own a home
3. In a rural area
4. The neighbourhood
5. To upsize. Close to family & friends
6. For work
7. To downsize
8. School(s) in the area. In a town.
Chart 9: Q2 Why did you move to your new build home?
Use of garage
5.3. Question 11 asks residents if they have a garage at their property and what they use it for.
Forty participants identified that they have a garage as part of their property. Participants
were able to provide more than one answer and of those that have access to a garage as
part of their property 40% use their garage for their car, 90% use their garage for storage,
10% for a Gym and 15% for a workshop.
5.4. This is largely reflective of other studies available, such as that from RAC Foundation4
whereby 48% of households that have access to garage use it for the storage of their car.
This is also supportive of the position of Mid Devon’s ‘The Provision of Car Parking in New
Development SPD’ (2013), whereby to ensure suitable parking provision in new
development garages are not counted as car parking spaces when calculating the car
parking standard.
4
https://www.racfoundation.org/media-centre/cars-out-in-cold
14GARAGE USE
90%
40%
15%
10%
CAR STORAGE GYM WORKSHOP
Chart 10: Garage use
Home Satisfaction
5.5. Question 12 identifies a number of features in a new home and participants were asked to
rate their satisfaction from 1-5 with a score of one equating to very unsatisfied and five
equating to very satisfied. Chart 11 displays the average satisfaction level graphically. Table
5 below demonstrates the average satisfaction level and the number of responses received
for each feature. These findings show that on average there was a good level of satisfaction
from residents in new build homes with all satisfaction levels scoring higher than 3.4. The
highest level of satisfaction was the internal space and layout of new build homes. The
lowest rated satisfaction level was cycle storage, which also had the lowest number of
responses. This may be indicative that space for cycle storage is not apparent in new build
homes and/or it is unclear what is considered as cycle storage, for example, the Mid Devon
Parking SPD (2013) sets out that garages that meet the dimensions set out in the SPD would
negate the need for separate cycle storage space.
Satisfaction Level
INTERNAL SPACE & LAYOUT 4.22
DESIGN & VISUAL APPEARANCE 4.14
CAR PARKING (ALLOCATED) 4.10
ENERGY EFFICIENCY 3.94
BROADBAND CONNECTION 3.82
SECURITY 3.80
GARDEN & PRIVATE OUTDOOR SPACE 3.78
NOISE INSULATION 3.68
PRIVACY 3.57
WASTE STORAGE/COLLECTION 3.51
CYCLE STORAGE 3.44
0.00 0.50 1.00 1.50 2.00 2.50 3.00 3.50 4.00 4.50
Chart 11: Satisfaction of home
15Features in new home Satisfaction Level Number of responses
Internal space & layout 4.22 65
Design & visual appearance 4.14 64
Car Parking (allocated) 4.10 63
Energy efficiency 3.94 65
Broadband connection 3.82 61
Security 3.80 65
Garden & private outdoor space 3.78 65
Noise insulation 3.68 65
Privacy 3.57 65
Waste storage/collection 3.51 65
Cycle storage 3.44 54
Table 5: Satisfaction of home
5.6. Question 13 of the survey provided the opportunity for individuals to identify what would
increase their satisfaction of their home. The findings from this question as demonstrated
by Table 6 indicates that Noise insulation and Privacy are two areas that received the
greatest number of responses. These items also featured in the bottom half of the
satisfaction ranking as indicated by Chart 11. Of the responses regarding noise insulation
frequently respondents referred to the noise insulation internal to their home as well as
adjoining properties. Where participants commented on privacy this often related to
privacy in gardens where overlooking was an issue.
5.7. The third and fourth items that ranked highest as increasing the level of satisfaction of
residents in their new build homes was in relation to new build warranty call outs and the
site in which they were living in was incomplete, particularly roads.
5.8. Although cycle storage featured as the lowest level of satisfaction under question 12, no
participants noted this as a feature that would increase their level of satisfaction of their
home. Waste storage/collection also featured second to lowest in the ranking as
demonstrated by Chart 11 but only received 2 individual responses where improvements to
this feature would increase the level of satisfaction of their home.
16What would increase your level of satisfaction about your home? Number of responses
Noise Insulation 15
Privacy 9
New Build Warranty Call outs 7
Completed building site 5
Garden Quality 5
Off Road Parking 5
Better walking routes 4
Quality of finish 4
Waste and Recycling storage 2
Garden size 2
Renewables 2
Broadband 1
Bus Route 1
Garage 1
General Storage 1
Improved children's play area 1
Insulation 1
Lower Council tax to off-set service charge 1
Room size 1
Table 6: Q13 What would increase your level of satisfaction of your home?
5.9. Question 16 of the survey provided the opportunity to provide any other comments about
the residents’ home and neighbourhood. With regard to the residents’ home there were
only a handful of comments. Most provided general positive comments on the design of
their home, other comments referred to the need for repairs to the fixtures and fittings of
their new home.
176. Neighbourhood satisfaction
6.1. The following question was included in the survey to help understand residents’ satisfaction
of their neighbourhood.
6.2. Question 14 identifies a number of features in a neighbourhood, and participants were
asked to rate their satisfaction with a score of 1-5 with one equating to very unsatisfied and
five equating very satisfied. Chart 12 displays the average satisfaction level graphically.
Table 7 below demonstrates the average satisfaction level and the number of responses
received for each feature.
6.3. These findings show that on average there was a moderate level of satisfaction from
residents of their neighbourhood with the majority of satisfaction levels scoring higher than
3. The highest level of satisfaction was for schools in the area. This in contrast also had the
lowest number of responses, the reason for this may be due to the satisfaction of schools in
the area was not applicable to all participants. The next highest rated features of the
neighbourhood of new build developments was the safety in the neighbourhood, character
and appearance and noise.
6.4. The lowest rated satisfaction level was pedestrian and cycle routes which scored an average
of 2.57. This indicates some level of dissatisfaction with this feature within new build
neighbourhoods.
18Satisfaction Level
SCHOOLS 4.00
SAFETY IN NEIGHBOURHOOD 3.91
CHARACTER & APPEARANCE 3.89
NOISE 3.88
OPEN SPACE & PLAY AREAS 3.56
TRAFFIC IN NEIGHBOURHOOD 3.51
CAR PARKING (GENERAL) 3.35
LOCAL SHOPS 3.27
COMMUNITY FACILITIES 3.15
PUBLIC TRANSPORT 3.09
PEDESTRIAN & CYCLE ROUTES 2.71
0.00 0.50 1.00 1.50 2.00 2.50 3.00 3.50 4.00 4.50
Chart 12: Satisfaction of Neighbourhood
Features in Neighbourhood Satisfaction Level Number of responses
Schools 4.00 52
Safety in neighbourhood 3.91 64
Character & appearance 3.89 64
Noise 3.88 61
Open space & play areas 3.56 63
Traffic in neighbourhood 3.51 65
Car parking (general) 3.35 62
Local shops 3.27 63
Community facilities 3.15 62
Public transport 3.09 64
Pedestrian & cycle routes 2.71 62
Table 7: Satisfaction of Neighbourhood
6.5. Question 15 of this survey provided the opportunity for individuals to identify what would
increase their satisfaction of their neighbourhood. The findings from this question indicate
that the top two features that would increase residents’ level of satisfaction of their
neighbourhood would be to increase the quantity and quality of footways and cycle routes.
This correlates with the findings of question 14, in which, pedestrian and cycle routes
scored the lowest in all neighbourhood features. With regard to the quantity of footways
and cycle routes residents frequently identified routes to destinations such as the towns or
village centres that would be beneficial. With regard to the quality of footways the most
common issues raised were width of pavements to allow for pushchair and/or wheelchair,
structure of the route e.g. waterlogged, and cars parking on pavements being an issue.
6.6. Traffic was identified as the next feature which had the highest level of responses whereby
respondents noted the speed of traffic as a deterrent for walking and cycling and noise
19from traffic as an issue. Community facilities was the next feature identified, those that
commented on this noted there was no appropriate facility available within the immediate
locality.
What would increase your level of satisfaction about your Number of
neighbourhood? responses
Quantity of footways and cycle routes 15
Quality of footways and cycle routes 11
Slower/less traffic 9
Community facilities 7
Visual appearance/Cleanliness 5
Quality of play area 4
More public transport 3
Quality of roads 3
Shops 3
More play areas/parks 3
More off road parking 2
Completion of development 2
Noise mitigation of traffic 2
Less on-street parking 1
Better street lighting 1
Visitor Parking 1
Security and safety 1
Table 8: Q15 What would increase your level of satisfaction about your neighbourhood?
6.7. Question 16 of the survey provided the opportunity for any other comments about the
residents’ home and neighbourhood. With regard to the neighbourhood there were a
number of general positive comments of overall satisfaction. There were also a handful of
general negative comments and specific comments referring to the unfinished development
including roads, footpaths and cycle routes, community facilities and play areas. Other
comments referred to the need for improved cleanliness of neighbourhood, lack of rubbish
bins, issues around traffic and car parking
207. Summary of Findings
7.1. The findings from this survey provide us with primary data on those that are living in new
build homes in 2021 and an invaluable insight into residents’ views of their new homes and
neighbourhood. The findings demonstrate that most moves into New Build Homes are from
existing residents in Mid Devon and comparably to National statistics, moves in Mid Devon
to New Build Homes are more local, with an average of 6 miles in comparison to an average
of 9 miles across England.
7.2. The attraction of a new build home and the opportunity to own their own home were the
top two reasons people chose to move to a new build home. This is reflective in the tenure
whereby the majority of tenure was in home ownership at 91% of New Build Homes in
comparison to the households’ previous situation whereby 57% were in home ownership.
Most moves in tenure were from private rent to ownership with a mortgage.
7.3. Of household size, the largest proportion was made up of two person households at 40%
which is similar to that in the South West. During the time of the survey over half had some
form of homeworking, with the majority of those homeworking identifying that there was
enough flexibility in their home to accommodate their working from home needs
permanently. For journeys to work or school the motor vehicle is the dominant form of
travel. Walking however made up 43% of journeys where destinations were 1 mile or less.
The quality of pedestrian and cycle routes and proximity to employment were the top two
reasons that would encourage people to use their car less.
7.4. The majority of residents of new build homes are on the whole happy with their new homes
and their surroundings locally. Privacy and noise insulation were areas that people would
like improved in their new build homes.
7.5. On the whole residents were moderately happy with their neighbourhood. The features in a
neighbourhood that residents were most happy with were schools, safety, character and
appearance and noise. The feature that residents were least happy with were pedestrian
and cycle routes. This was also the area that people would most like improved in their
neighbourhood both in quantity and quality.
7.6. This New build homes resident satisfaction survey has given us some valuable primary data
on the people that live in new build homes and their views on what they like and dislike
about their home and neighbourhood. The findings in this survey alone and in combination
with future surveys as this is launched annually, can help attune our understanding of
residents in new build homes and the success of new build developments, which can help
the Council shape the future of our local area through the Council’s work.
21Annex 1 –
Copy of New Build Homes Survey 2021
22New Build Homes Resident
Survey 2021
Please attach separate sheet if necessary
1. Tell us about your move?
Current Postcode Previous Postcode
2. Why did you move to your new build home? (please tick all that apply)
Attracted to a new home Close to family and friends
To own a home School(s) in the area
To upsize In a rural area
To downsize In a town
The neighbourhood Other (please state)
For work _____________________________________________
3. Do you own or rent your new build home?
Own outright Rent from private landlord
Own with mortgage Rent from housing association/Council
Own shared ownership Other (please state)
_____________________________________________
4. At your previous address what was your situation?
Own outright Rent from housing association/Council
Own with mortgage Living with Friends or Family
Own shared ownership Other (please state)
Rent from private landlord _____________________________________________
5. How many people are at your household? Please enter number in each relevant box
Working Under school age
Retired Primary school
Home maker/carer Secondary school
Unemployed College/University
Other (please state)
_______________________________________________________________________________________________
6. At the time of answering this survey, do you work from home?
Always Occasionally
Regularly Never
7. Is there enough flexibility in your home to accommodate your working from home needs permanently?
Yes No Not applicable
If No, what would help accommodate your needs?_____________________________________________________
8. At the time of answering this survey, how often do you commute to work? (Number of days a week)
_________________________________________________________________________________________
9. Please tell us the locations of each of your workplaces and schools, and the type of transport you use for
each person in the household? e.g. Person 1. School, Tiverton, Cycle10. What would make you use your car less? (please tick all that apply)
Frequency of public transport Quality of pedestrian and cycle routes
Access to public transport Continuous pedestrian & cycle links to my destination
Cost of public transport Proximity to employment
Access car club/car sharing vehicle Ability to work from home
Other_____________________________________________________________________________________
11. Do you have a garage? If yes used for:
Yes Car Storage
No Workshop Other Please State
____________________
12. About your new home. On a scale of 1-5 how satisfied are you with the following?
1=Very Dissatisfied 5=Very Satisfied 1 2 3 4 5
a. Internal space & layout
b. Garden & private outdoor space
c. Car Parking (allocated)
d. Cycle storage
e. Waste storage/collection
f. Energy efficiency
g. Design & visual appearance
h. Privacy
i. Noise insulation
j. Security
k. Broadband connection
Other (please specify)
13. What would increase your level of
satisfaction about your home?
14. About your neighbourhood. On a scale of 1-5 how satisfied are you with the following?
1=Very Dissatisfied 5=Very Satisfied 1 2 3 4 5
a. Open space & play areas
b. Character & appearance
c. Traffic in Neighbourhood
d. Safety in Neighbourhood
e. Car Parking (general)
f. Pedestrian & cycle routes
g. Community facilities
h. Local shops
i. Public transport
j. Schools
k. Noise
Other (please specify)
15. What would increase your level of
satisfaction about your neighbourhood?
16. Is there anything else you would like to say about your new home and/or neighbourhood?
____________________________________________________________________________________________
Thank you for taking the time to complete this survey.Annex 2: Previous postcode to current postcode by parish
Cheriton Fitzpaine
Newton St. Cyres
Current parish
Copplestone
Cullompton
Halberton
Hemyock
Bampton
Crediton
Tiverton
Willand
Previous parish
Butterleigh 1
Cheriton Fitzpaine 1
Copplestone 1
Crediton 4
Crediton Hamlets 1
Cruwys Morchard 1
Cullompton 1 2 1
Hemyock 1 2
Newton St. Cyres 1
Silverton 1
Thorverton 1
Tiverton 1 9 1
Uffculme 3
Upton Hellions 1
Willand 2
Zeal Monachorum 1
BRISTOL, CITY OF 1
EAST DEVON 2 1
EXETER 1 3 2
GLOUCESTER 1
SOMERSET WEST AND TAUNTON 1 3
TEIGNBRIDGE 2 1
TORRIDGE 1
EAST NORTHAMPTONSHIRE 1
FIFE 1
HERTSMERE 1
REDBRIDGE 1
TONBRIDGE AND MALLING 1
WORCESTER 1
25You can also read