Effect of Inflation Pressure loss Rates on Tire Rolling Restistance, Vehicle fuel Economy, and CO2 Emissions - Global Aanalysis
←
→
Page content transcription
If your browser does not render page correctly, please read the page content below
ROHSTOFFE UND ANWENDUNGEN
                                                                                                  RAW MATERIALS AND APPLICATIONS

 Innerliner · Halobutyl Rubber · Tire
 Performance · Inflation Pressure Loss
                                            Effect of Inflation Pressure loss
 Rates · IPLR · %-Loss/Month · Rolling
 Resistance Force · SAE J1269 · Fuel
 Economy · CO2 Emissions
                                            Rates on Tire Rolling Restistance,
 Using data for the United States, a
 method was previously developed to
 calculate the additional fuel consumed
                                            Vehicle fuel Economy, and CO2
 and corresponding increase in CO2
 emissions generated upon switching
 from the original equipment to replace-
                                            Emissions - Global Aanalysis
 ment tires for small passenger cars and
 for SUV/light trucks. Since pneumatic
 tires continuously lose pressure due to
 permeation of gas through the rubber,
 tire inflation pressure loss rates (IPLR)
 were used to calculate the additional      Based on the low permeability1 to small-          ·   Measure the inflation pressure loss rates
 fuel consumed by the vehicle as a          molecule diffusants as a result of efficient           (IPLR) of tires following the ASTM F1112
 function of the increased tire rolling
                                            intermolecular packing2, butyl rubber has             protocol9.
 resistance resulting from tire under-
                                            contributed significantly to the improve-          · Determine tire IPLR values at a typical op-
 inflation. Results are estimated for the
 fuel consumed as a function of tire IPLR   ment in the performance and safety of tires.          erating temperature in use on vehicles.
 for countries in the Americas, Europe,     Halogenated butyl rubbers provide higher          · Measure the changes in tire RRF values
 and Asia.                                  vulcanization rates and improve the com-              as a function of inflation pressure from
                                            patibility with unsaturated rubbers, ena-             221 to 165 kPa when the tire pressure
                                            bling the production of tubeless tires3. Ex-          monitoring system must be activated in
 Einfluss des Reifendruckverlusts            perimental 205/60 HR15 tires made with a              the U.S. (25 % underinflation)15.
 auf den Rollwiderstand, Kraft-             change only in the innerliner Bromobutyl/         · Calculate the increase in tire RRF values
 stoffverbrauch und CO2 Emmissi-            NR polymer ratio showed direct relation-              as a result of tire underinflation assum-
 onen - eine globale Analyse                ships to tire performance4-8. Quantitative            ing an average tire re-inflation time pe-
                                            correlations (R2 > 0.99) of Bromobutyl rub-           riod of three months.
 Innerliner · Halobutylkautschuk ·          ber (BIIR) level to inflation pressure loss rate   · Determine the decrease in vehicle fuel
 Reifenleistung · Reifendruckvelustrate ·   (IPLR)9 values (Fig. 1), and to intracarcass          economy as a function of tire IPLR that
 % Verlust/Monat · Rollwiderstands-         pressure (ICP) were obtained. Durability,             result from the increased RRF values.
 kraft · SAE J1269 · Kraftstoffökonomie ·   measured in hours to failure on a 1.7-m lab       · Estimate the potential fuel savings if a
 CO2 Emissionen                             roadwheel, tested according to the National           tire IPLR specification were to exist by
 Aufgrund von Daten aus den Vereinig-       Highway Traffic Safety Administration’s                using the factor: a 10 % increase in tire
 ten Staaten wurde eine früher entwi-       Federal Motor Vehicle Safety Standards No.            rolling resistance increases light duty ve-
 ckelte Methode angewendet um den           13910, but modified by continuing until tire           hicle fuel consumption by 1.6 %16.
 zusätzlichen Kraftstoffverbrauch und       failure, showed a qualitative correlation to      · Estimate the potential yearly fuel sav-
 den entsprechenden Anstieg der CO2         tire IPLR, Figure 2. Oxidative aging of natural       ings as a function of tire IPLR for light
 Emissionen beim Übergang auf Ersatz-       rubber in the tire belt area is retarded by us-       duty vehicles in service in the Americas,
 reifen bei PKWs und leichten LKWs zu
                                            ing a liner that gives a low IPLR7,8.                 in Europe, and in Asia.
 berechnen. Da Luftreifen aufgrund der
 Gaspermeation kontinuierlich an Druck                                                        · Calculate the potential CO2 reductions
 verlieren, kann die Reifendruckverlust-    Experimental Technique                                obtained from these examples of esti-
 rate zur Berechnung des zusätzlichen        A multi-step process was developed11 in or-          mated fuel savings17.
 Kraftstoffverbrauchs als Funktion des       der to calculate the fuel consumed by light       Available tire rolling resistance force (RRF)
 steigenden Rollwiderstands herangezo-       duty vehicles (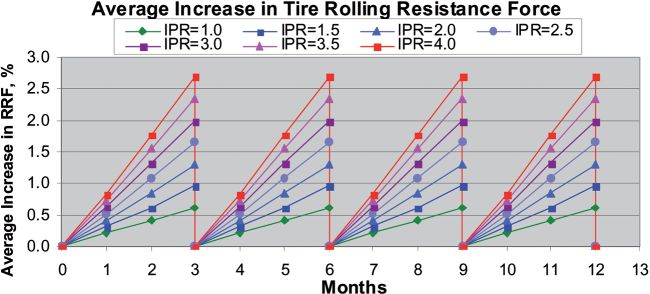
ROHSTOFFE UND ANWENDUNGEN
             RAW MATERIALS AND APPLICATIONS

  1                                                                        2

  1 Tire Inflation Pressure Loss Rates as a Function of the Bromobutyl      2 Durability by FMVSS 139 Endurance (to Failure) as a Function of
    Rubber / Natural Rubber Ratio Used in the Innerliner Compound7           Tire Inflation Pressure Loss Rate Values7

ed to travel 12,000 miles upon switching
from the original equipment to replace-            3
ment tires for six 2007 model year passen-
ger cars (Fig. 3) and for nine 2007 model
year SUV/light trucks.

Tire Inflation Pressure Loss Rates
Tire inflation pressure is important. “Find-
ings from safety checks conducted on
52,400 cars in 15 E.U. countries in 2009 show
that 81 % of motorists are driving on under-
inflated tyres. This habit is leading to the
annual equivalent of 4.0 billion litres of
wasted fuel, worth € 5.2 billion, and 9.3 mil-
lion tons of additional and unnecessary CO2
emissions - the equivalent of 3.47 g/km of
CO2 a year for every car on Europe’s roads.
                                                   3 Gasoline Consumed for 2007 Passenger Cars to Travel 12,000 Miles on the Original
Analysis of these test results show that
                                                     Equipment Tires (green), on Replacement Tires that have an Average Rolling Resistance
26.5 % of motorists are driving on seriously
                                                     Force Value (green + blue), and on Replacement Tires that have the Highest Rolling
under-inflated tyres (at least 0.5 bar below          Resistance Force Value (green + blue + red)11
vehicle constructor recommended pres-
sure) and 7.5 % are putting their safety at
high risk by driving on severely under-inflat-    month. In addition, IPLR values of tires           Since the average light duty vehicle is not
ed tyres (at least 0.75 bar below recom-         measured by the ASTM F1112 test protocol           operated on a 24-hour time basis, tire IPLR
mended pressure).” 18,19                         are reported in the literature20 with values       values for four different tire models were
Tire inflation pressure loss rates (IPLR) were    ranging from a low of 1.09 %-loss/month to         measured in the lab at 21oC according to
measured for tires manufactured during           4.44 %-loss/month. Figure 4 shows the per-         the ASTM F1112 test protocol and also
the last 12 years and assembled into a sin-      centage distribution of tire IPLR values of        were measured at ambient temperatures
gle database if the IPLR value was deter-        more than 250 tires. The average IPLR value        on different vehicles that were being used
mined according to ASTM F1112 test proto-        of tires manufactured worldwide is                 in service21. Results showed an average in-
col9. No experimental tires were included in     2.36 %-loss/month.                                 crease in the tire IPLR value by approxi-
this database. If the IPLR of one tire model     Tires lose inflation pressure more quickly          mately 75 % for tires measured on vehicles
was measured repeatedly or if the same tire      when loss rates are measured at higher             used in-service compared to the ASTM
had been tested in different labs, then the      temperatures as during in-service opera-           F1112 lab values. The increase in tire IPLR
average value of all measurements was            tions15,20,21. In addition, IPLR values for dif-   varied widely and depended on the tire
used to represent this tire model as a single    ferent tires change differently with tem-          model. For example, the IPLR of Tire A in-
IPLR value. However, if the same size and        perature changes. For example, two tire            creased by 50 %, while the IPLR for Tire C
model tire had been manufactured in dif-         models having the same value of IPLR =             increased by 225 %, Figure 6.
ferent plants, it would be considered a dif-     2.4 %-loss/month when measured accord-             Based on the average of 12,000 miles driven
ferent model and was included in this data-      ing to ASTM F1112 at 21oC, had different           yearly in the U.S., a vehicle is operated ap-
base. Over 230 different models and/or           loss rates when measured at 70oC. Signifi-          proximately 6 % of the time, depending
sizes of tires are included in this database     cantly higher tire IPLR values of 27.1 %-loss/     upon the average speed that is attained.
with tire IPLR values ranging from a low of      month for Tire C and 34.9 %-loss/month for         Thus, using 6 % of the tire IPLR value meas-
0.86 %-loss/month to a high of 3.53 %-loss/      Tire L20 are reported, Figure 5.                   ured at 70oC and adding it to 94 % of the

46    KGK · Januar/Februar 2012                                                                                              www.kgk-rubberpoint.de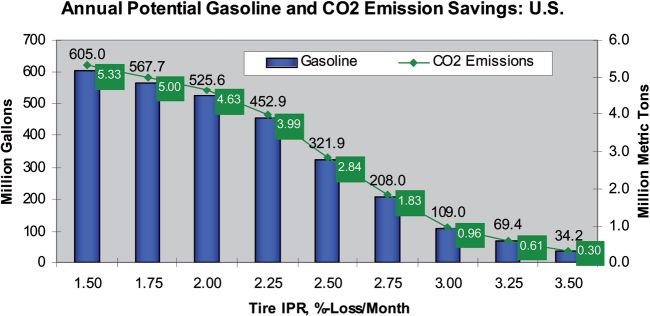
measured ASTM F1112 tire IPLR lab value          sistance using three test protocols: SAE           Results show that the average of the meas-
measured at 21oC, affords an adjusted tire       J1269 single-point, SAE J1269 multipoint,          ured rolling resistance force (RRF) values of
IPLR value that is increased by approximate-     and SAE J2452. Data was measured for               the three tires in each of the four sets in-
ly 72 %. This increase is approximately the      three tires each of the four sets at seven         creased with decreasing tire inflation pres-
same as the 75 % average increase in IPLR        specified tire inflation pressures: 260, 221,        sure, regardless of advertised as a low roll-
measured for tires at ambient temperatures       214, 207, 193, 179, and 165.5 kPa. In particu-     ing resistance tire. Tire RRF value range
on vehicles being used in service21.             lar, tire inflation pressures of 221 to 165.5       from 3.94 kg to 5.13 kg at 221 kPa inflation.
                                                 kPa were selected to cover that inflation           Figure 7 plots the RRF values as a function of
Effect of IPLR on Tire Rolling                   pressure range representing a properly in-         tire inflation pressure. The increase in RRF
Resistance                                       flated tire (selected to be 221 kPa) and a          with decreasing tire inflation pressure oc-
Four sets of tires were tested: an advertised    25 % underinflation situation (165.5 kPa)           curs regardless of the value measured at
low rolling resistance tire manufactured in      when the vehicle’s tire pressure monitoring        221 kPa. The average increase in tire rolling
Europe, and an advertised low rolling resist-    system (TPMS) should be activated to alert         resistance force is 16.5 %. Hence, the ability
ance tire manufactured in Japan. Smithers        the driver of low tire inflation pressure in        of the tire to maintain the proper inflation
Scientific Services measured tire rolling re-     accordance with FMVSS No. 13822.                   pressure is most important.
                                                                                                    The increase in tire RRF will also vary with
                                                                                                    the tire IPLR value. Even though the TPMS
  4                                                                      4 Distribution of          light may not be activated within a three-
                                                                           Inflation Pressure
                                                                                                    month time period, the approximate tire
                                                                           Loss Rates Values
                                                                           for 250 Tires Man-       re-inflation time period in the U.S.23, the tire
                                                                           ufactured Glo-           is still underinflated, the rolling resistance
                                                                           bally11                  force value is increased (see Figure 8), and
                                                                                                    thus the vehicle fuel economy is reduced.
                                                                                                    For a light-duty vehicle tire with an IPLR =
                                                                                                    1.5 %-loss/month, the RRF value calculated
                                                                                                    at the end of the three-month period has
                                                                                                    increased 2 % from the initial RRF value
                                                                                                    measured at 221 kPa. This corresponds an
                                                                                                    average increase of 1 % over the three
                                                                                                    month time period based on the area under
                                                                                                    the curve of the right triangle, Area =
                                                                                                    ½*(H*L). For a tire with an IPLR = 3.5 %-loss/
                                                                                                    month, the increase in the RRF value at the
  5                                                                      5 Tire IPLR Monthly
                                                                                                    end of the three month time period is calcu-
                                                                           Loss Rates Deter-
                                                                           mined According to       lated to increase 4.67 %, and the average
                                                                           ASTM F1112 at            increase in RRF over the entire three months
                                                                           21oC (blue) and at       is 2.33 %, Figure 8.
                                                                           70oC (purple)
                                                                                                    Potential Fuel Savings for the United
                                                                                                    States
                                                                                                    The potential yearly fuel savings for the
                                                                                                    United States can be estimated if the under-
                                                                                                    inflated tire issue can be resolved. Based on
                                                                                                    2006 data there were 234.5 million light
                                                                                                    duty vehicles registered with 57.7 % being

  6                                                                         7

  6 Tire IPLR Monthly Loss Values Measured According to ASTM F1112          7 Tire Rolling Resistance Force Values Shown as a Function of Tire
    in the Laboratory (blue), and on Vehicles Used In-service (purple)        Inflation Pressure

www.kgk-rubberpoint.de                                                                                                  KGK · Januar/Februar 2012   47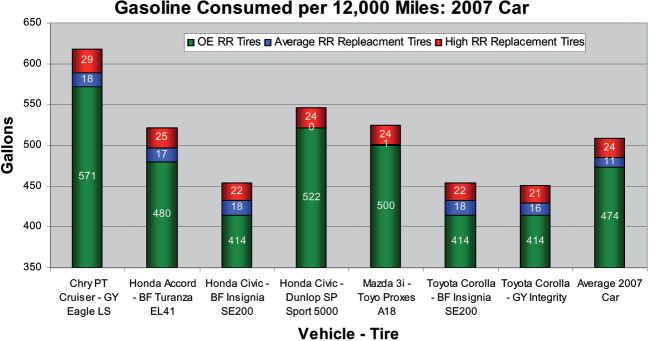
ROHSTOFFE UND ANWENDUNGEN
RAW MATERIALS AND APPLICATIONS
passenger cars and 42.3 % SUV/light trucks.
8
For the estimated average 12,000 miles
(19,300 km) driven per vehicle per year vehi-
cles consume about 600 gallons (2271 lit-
ers) of gasoline per vehicle per year, or ~20
mpg24.
A potential savings of 322 million gallons
(1.22 billion liters) of gasoline each year is
calculated if inflation pressure loss rates did
not exceed 2.5 %-loss/month for any pas-
senger car or SUV/LT tires11. Figure 9 is a
summary of potential savings as a function
of tire IPLR. A maximum IPLR=2.5 %-loss/
month is expected to affect about 42 % of
tires (see Figure 4). Potential CO2 savings
8 Average Increase in the Rolling Resistance Force Over the Three-month Time Period
would be 2.84 million metric tonnes per
Prior to Tire Re-inflation; the Increase in the RRF Value is Two Times that of the Average
year17. Use of lower tire IPLR values could Value Shown
generate additional savings.
The potential savings of 322 million gallons 9
(1.22 billion liters) of gasoline per year is
equivalent to not shipping three Ultra Large
Crude Carriers (tankers) which carry about
one million tonnes of crude oil, not refining
16.5 million barrels of crude, and not send-
ing 53,700 tanker trucks to deliver gasoline
to local service stations (5,000–7,000 gallon
tanks per truck). The corresponding savings
in CO2 emissions would be equivalent to
taking 537,000 light duty vehicles off of the
roads in the United States. Since the aver-
age tire lifetime is 3.6 years25, 1.16 billion
gallons (4.38 billion liters) of gasoline could
potentially be saved and over 10 metric mil-
9 Potential Annual Gasoline (blue) and CO2 Emissions (green) Savings as a Function of Tire
lion tonnes of CO2 emissions would not be-
Inflation Pressure Loss Rate11
ing generated, Figure 10. The use of lower
tire IPLR values could generate additional 10
potential savings.
RESULTS AND DISCUSSION
The effects that tire inflation pressure loss
rates have on vehicle fuel economy and CO2
emissions based on the number of light
duty vehicles in service in countries in the
Americas (excluding the United States), in
Europe and in Asia Pacific is calculated.
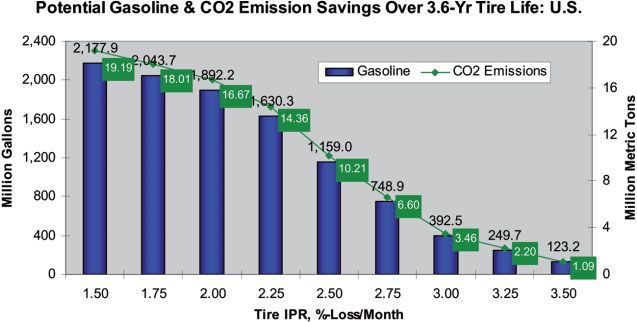
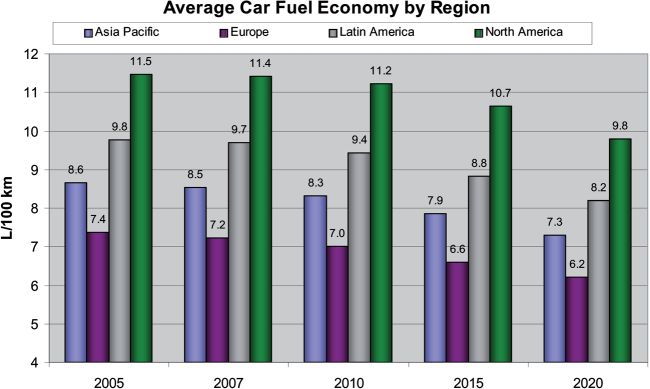
It is important to know that the fuel econo-
my of cars varies significantly in different
regions and different countries within a re-
gion in the world26, Figure 11. Differences
may arise from a number of factors and can
include the size and types of light duty ve- 10 Potential Savings over 3.6-Year Tire Lifetime of Gasoline (blue) and CO2 Emissions
(green) as a Function of Tire Inflation Pressure Loss Rate11
hicles driven, the road conditions and infra-
structure, climate conditions, and individu-
al driving habits. were in use, which included 92.6 million 1237 liters of fuel/year. The total number of
passenger vehicles and 15.9 million light medium and heavy commercial vehicles,
Americas commercial vehicles28, see Table 1. An aver- such as long-haul trucks and buses, are also
In 2008, countries in the Americas including age of 9.7 liters/100 km of fuel was con- listed in Table 1, but are not a part of this
Canada, but excluding the United States, sumed by each vehicle in 2007, and assum- analysis.
had an estimated total population of 722.5 ing that each light duty vehicle was driven Statistics for the individual countries within
million people27, see Table 1. An estimated an average of 12,000 km/year the average the Americas varies significantly. For exam-
total of 108.6 million light duty vehicles vehicle would have consumed a total of ple, the percentage of light commercial ve-
48 KGK · Januar/Februar 2012 www.kgk-rubberpoint.de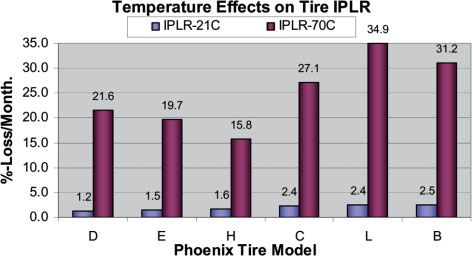
1 Selected Data for Canada, Mexico, Argentina, Brazil, and Other Countries in the Americas                    A yearly savings of 347 million liters of fuel
 Country                                   Canada       Mexico     Argentina            Brazil      Other     is calculated if tire inflation pressure loss
                                                                                                    Latin     rates did not exceed 2.5 %-loss/month for
                                                                                                   America
                                                                                                              any tires based on using the savings for
 Passenger Vehicles, Millions               21.76        24.02           7.11           24.68       15.09     passenger car values previously calculated
 Light Commercial Vehicles, Millions        3.83          4.66           1.07           2.85        3.50      (Figure 3) for the number of passenger ve-
 Commercial Vehicles, Millions              0.82          1.06           0.45           2.08        1.73      hicles listed in Table 1, and using the saving
 Total Vehicles, Millions                   26.41        29.73           8.63           29.61       20.32     for SUV/LT results previously generated11
 2008 Estimated Population, Millions        33.2         110.0           40.5           196.3       342.5     for the number of light commercial vehi-
 Passenger Vehicles/1000 People             655.1        218.4          175.5           125.7       44.1      cles listed in Table 1. In addition, the gen-
                                                                                                              eration of 0.79 million metric tonnes of
2 Potential Yearly Fuel and CO2 Emission Savings for the Americas, Excluding the United States                CO2 emissions may be prevented. These
   Tire IPLR,        Estimate of          Average Rolling         Potential Annual         Potential Annual   amounts are equivalent to taking approxi-
 %-Loss/Month         Number of        Resistance Increase at       Fuel Savings           Reduction in CO2   mately 280,000 light duty vehicles off the
                    Tires Affected         Three Months                                       Emissions       road in countries in the America, excluding
         1.5 %           98.2 %               2.10 %                599 MLiters             1.37 MMtonnes     the United States. Table 2 is a summary of
         2.0 %           77.8 %               3.60 %                543 MLiters             1.24 MMtonnes     potential savings of fuel and CO2 emissions
         2.5 %           40.8 %               4.40 %                347 MLiters             0.79 MMtonnes     as a function of tire IPLR. Use of lower tire
         3.0 %           16.7 %               5.10 %                190 MLiters             0.43 MMtonnes     IPLR values could generate additional po-
         3.5 %            7.4 %               5.90 %                64.5 MLiters            0.15 MMtonnes     tential savings.

3 Potential Yearly Fuel and CO2 Emission Savings for the 27 Countries in Europe
                                                                                                              Europe
                                                                                                              In 2008, the 27 countries in Europe had an
   Tire IPLR,        Estimate of          Average Rolling         Potential Annual         Potential Annual
 %-Loss/Month         Number of        Resistance Increase at       Fuel Savings           Reduction in CO2   estimated population of 731.7 million peo-
                    Tires Affected         Three Months                                       Emissions       ple27 and had an estimated total of 268.8
         1.5 %           98.2 %               2.10 %               3199 MLiters             7.29 MMtonnes     million light duty vehicles in use, which in-
         2.0 %           77.8 %               3.60 %                2531 MLiters            5.77 MMtonnes     cluded about 244.9 million passenger vehi-
         2.5 %           40.8 %               4.40 %               1153 MLiters             2.63 MMtonnes     cles and 23.9 million light commercial vehi-
         3.0 %           16.7 %               5.10 %                395 MLiters             0.90 MMtonnes     cles28. The total number of passenger vehi-
      >3.5 %              7.4 %               5.90 %                84.6 MLiters            0.19 MMtonnes     cles per 1000 people in Europe is 335; how-
                                                                                                              ever, greater than 78 % of these passenger
                                                                                                              vehicles were located in the western Euro-
4 Selected Data for China, India, Japan, South Korea and Taiwan, and Other Countries in the Asia-
   Pacific Region                                                                                              pean counties. An average of 7.2 liters of
                                                                                                              fuel is consumed in order to drive 100 km
 Country                                   China       India     Japan          South     Taiwan    Other
                                                                                Korea                Asia     each for light duty vehicle in 2007 (see Fig-
                                                                                                    Pacific    ure 11)26, and using an average of 15,000 km/
 Personal Vehicles, Millions               39.89       14.51     65.64          13.17       6.56     40.56    year driven for each light duty vehicle the
 Light Commercial Vehicles, Millions       13.78       1.44      9.99           3.82        0.49    11.44     average vehicle consumed a total of 1080
 Commercial Vehicles, Millions              7.51       3.74      0.83           0.31        0.21     3.64     liters of fuel/year. Medium and heavy com-
 Total                                     61.18       19.69     76.45          17.30       7.26     55.64    mercial vehicles are not a part of this analy-
 2008 Estimated Population, Millions      1330.0    1148.0       127.3          48.4        22.9    1375.4    sis.
 Passenger Vehicles/1000 People            30.0        12.6      515.6          272.2      286.2     29.5     A potential annual savings of 1.15 billion lit-
                                                                                                              ers of fuel is calculated if tire inflation pres-
                                                                                                              sure loss rates did not exceed 2.5 %-loss/
5 Potential Yearly Fuel and CO2 Emission Savings for the Asia-Pacific Region
                                                                                                              month for any light duty vehicle tire. The
   Tire IPLR,        Estimate of          Average Rolling         Potential Annual         Potential Annual   generation of 2.63 million metric tonnes of
 %-Loss/Month         Number of        Resistance Increase at       Fuel Savings           Reduction in CO2
                    Tires Affected         Three Months                                       Emissions       CO2 emissions could also be saved. These
                                                                                                              values are equivalent to taking approxi-
         1.5 %           100.0 %              2.10 %                1274 MLiters            2.90 MMtonnes
                                                                                                              mately one million light duty vehicles off
         2.0 %           93.4 %               3.60 %                1269 MLiters            2.89 MMtonnes
                                                                                                              the road in countries in Europe. Table 3 is a
         2.5 %           60.1 %               4.40 %                1053 MLiters            2.40 MMtonnes
                                                                                                              summary of potential fuel and CO2 emission
      2.75 %             37.9 %               4.75 %                559 MLiters             1.94 MMtonnes
                                                                                                              savings as a function of tire IPLR. Use of
         3.0 %           12.9 %               5.10 %                201 MLiters             0.46 MMtonnes
                                                                                                              lower tire IPLR values could generate addi-
         3.5 %              0.9 %             5.90 %                16.4 MLiters            0.04 MMtonnes
                                                                                                              tional potential savings.

hicles based on the total number of light              Latin American countries (18.8 %). However,            Asia-Pacific
duty vehicles (the total of passenger vehi-            the total number of passenger vehicles per             In 2008 there were an estimated four bil-
cles and light commercial vehicles) is similar         1000 people varies significantly: United                lion people living in countries within the
for countries in the Americas: United States           Sates (770), Canada (655), Mexico (218), Ar-           Asia-Pacific region27. An estimated 221.3
(21.2 %), Canada (15 %), Mexico (16.2 %), Ar-          gentina (176), Brazil (126) and other Latin            million light duty vehicles were in use in
gentina (13.1 %), Brazil (18.8 %), and other           American countries (44), Table 1.                      these countries, which included about

www.kgk-rubberpoint.de                                                                                                            KGK · Januar/Februar 2012   49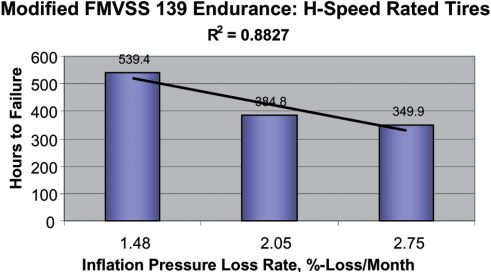
ROHSTOFFE UND ANWENDUNGEN
RAW MATERIALS AND APPLICATIONS
180.3 million passenger vehicles28. The to-
11
tal population and the total number of ve-
hicles used in-service varies widely by
country. For example, the total number of
passenger vehicles per 1000 people varies
significantly: Australia (561), Japan (516),
Taiwan (286), and South Korea (272) have
the highest ratios of passenger vehicles in
the Asia-Pacific region. However, the aver-
age for all countries in this region is only
0.045 passenger vehicles for every 1000
people. China (30 passenger vehicles/1000
people) and India (13) had a significantly
lower passenger car ratio, see Table 4;
however, in 2007 there were about 87.1
million motorized two-wheel vehicles in
China29, excluding electric bicycles and mo-
torcycles, and 64.7 million motorized two-
wheel vehicles in India30. 11 Average Car Fuel Economy in Liters Consumed per 100 km Driven by Region Estimated
The average fuel economy for cars in the Through 2020
Asia-Pacific region is 8.5 liters/100 km in
12
2007, but also varies widely26, see Figure 11.
Using an estimated 10,000 km/year driven
for each car, the average light duty vehicle
consumed 850 liters of fuel each year. Me-
dium/heavy commercial vehicles used in
the region are not a part of this analysis.
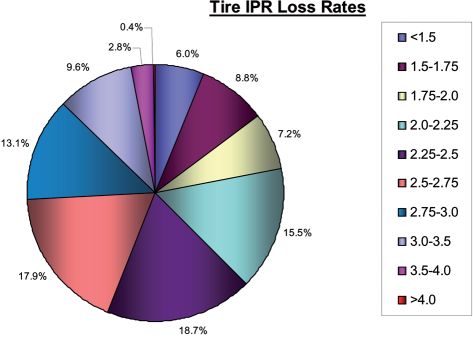
The average tire IPLR value worldwide is
2.36 %-loss/month; however, for over 100
tires that were manufactured in the Asia-
Pacific region a value of 2.61 %-loss/month
is obtained. Thus, for approximately 150
tires that were manufactured in plants in
the Americas and Europe the average IPLR
value is 2.2 %-loss/month. Figure 13 shows
the distribution of tire IPLR values. 12 Average Car Fuel Economy in Liters Consumed per 100 km Driven by Region Estimated
Using these values, a yearly savings of 1.05 Through 2020
billion liters of fuel is calculated if tire infla-
tion pressure loss rates did not exceed Area Billion liters of fuel Million metric tonnes of CO2
2.5 %-loss/month for any light duty vehicle United States 1.22 2.84
tire. In addition, 2.4 million metric tonnes of Americas 0.35 0.79
CO2 emissions could also be prevented. This Europe 1.15 2.63
is equivalent to taking approximately 1.24 Asia-Pacific 1.05 2.40
million light duty vehicles off the road in 3.77 8.66
Asia-Pacific countries. Table 5 is a summary
of potential fuel and CO2 emission savings
References
as a function of tire IPLR. Use of lower tire [1] G. J. van Amerongen, Rubber Chemistry Technol- [8] W.H.Waddell, R.C.Napier, D.F.Rouckhout, D.S.Tracey
IPLR values should generate additional po- ogy, Rubber Reviews 37 (1964) 1065. and U.Karmarkar, Rubber World 238 (6), (2008) 21.
[2] D. J. Plazek and K. L. Ngai, Macromolecules, 24 [9] Standard Test Method for Static Testing of Tube-
tential savings.
(1991) 1222. less Pneumatic Tires for Rate of Loss of Inflation
[3] E. N. Kresge and H.-C. Wang, “Butyl Rubber” in Pressure” ASTM F1112 - 06
SUMMARY “Kirk-Othmer Encyclopedia of Chemical Technol- [10] U.S. Department of Transportation, TP-139-01,
By requiring that all tires for light duty vehi- ogy”, Fourth Edition, M. Howe-Grant, Editor, May 26, (2005); TP-139-03, March (2007) 6.
cles worldwide, both original equipment John Wiley & Sons, New York 8, (1993) 934. [11] W. W. Waddell and R. C. Napier, “Rubber & Plas-
and replacement market, have a maximum [4] D. S. Tracey and W. H. Waddell, Rubber & Plastics tics News, 14. and July 12. (2010) 20.
tire inflation pressure loss rate of 2.5 %-loss/ News 34, 14, May (2005) 30. [12] B. Lambillotte, “Task 4 Rolling Resistance Testing:
[5] W. H. Waddell, S. W. Botfeld, R. C. Napier, California Energy Commission’s Fuel Efficient
month, it is calculated that significant po-
D. F. Rouckhout and D. S. Tracey, Rubber World Tire Program, presented at the Workshop on The
tential savings in fuel consumed can be ob- 233 (4), (2006) 33. Fuel Efficient Tire Program, December (2007).
tained thus preventing CO2 emissions. Every [6] W. H. Waddell, D. S. Tracey and D. F. Rouckhout, [13] www.fueleconomy.gov
year 3.75 billion liters of fuel can be saved Kautschuk Gummi Kunststoffe 59 (12) (2006) 659. [14] “OEM Tire Size Guide 1998-2007”, J. Garfield,
and 8.66 million metric tonnes of CO2 emis- [7] W. H. Waddell, R. C. Napier, D. F. Rouckhout and Chief Editor, A Bennett Garfield Publication,
sions prevented. D. S. Tracey, Rubber World 236 (2), 36, 40, (2007) 43. Copyright (2007), Tire Guides Inc.
50 KGK · Januar/Februar 2012 www.kgk-rubberpoint.de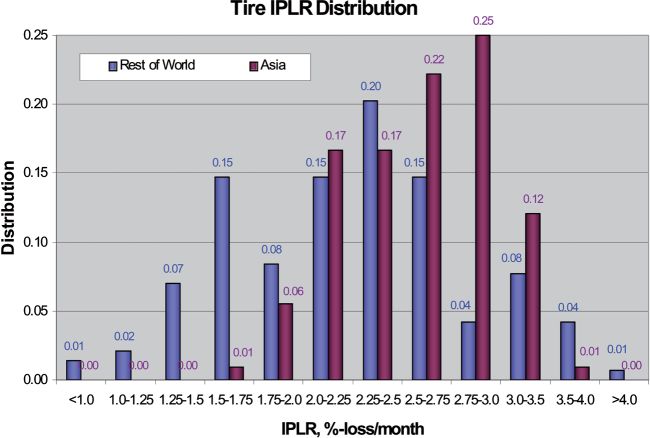
guy/2010/10/news-release-driving-on-under-
 13                                                                                                                                     inflated-tires.html, October (2010) 13.
                                                                                                                                   [20] J. D. MacIsaac Jr., L. R. Evans, J. Harris, and E. Ter-
                                                                                                                                        rill, “The Effects of Inflation Gas on Tire Labora-
                                                                                                                                        tory Test Performance”, International Tire Expo-
                                                                                                                                        sition & Conference, Akron, OH, September
                                                                                                                                        (2008).
                                                                                                                                   [21] R. C. Napier and W. H. Waddell, Rubber & Plastics
                                                                                                                                        News, 16. November (2009) 30.
                                                                                                                                   [22] Preliminary Regulatory Impact Analysis, NPRM
                                                                                                                                        on Tire Pressure Monitoring System, FMVSS No.
                                                                                                                                        138 (Docket No. 2004-19054-3) (9/16/04) (69FR
                                                                                                                                        55895); Final Regulatory Impact Analysis, Tire
                                                                                                                                        Pressure Monitoring System, FMVSS No. 138
                                                                                                                                        (Docket No. 2005-20586-2) (4/8/05) (70FR 18136).
                                                                                                                                   [23] “Tire Pressure Special Study: Interview Data”,
                                                                                                                                        DOT HS 809 316, August (2001).
                                                                                                                                   [24] “Tires and Passenger Vehicle Fuel Economy. In-
                                                                                                                                        forming Consumers, Improving Performance”,
                                                                                                                                        Transportation Research Board Special Report
                                                                                                                                        (2006) 286.
                                                                                                                                   [25] www.idavette.net/tire_wheel/tire_myths.htm
                                                                                                                                   [26] Exxon Mobil Corporation Information, Fleet Av-
                                                                                                                                        erage PC-Light Trucks LPKM (2007).
 13 Distribution of Inflation Pressure Monthly Loss Rates Values for Tires Manufactured in                                          [27] The World Factbook (2008) and (2009) CIA,
    the Asia-Pacific Region (purple), and Tires Manufactured in the Americas and Europe                                                  www.cia.gov/library/publications/the-world-
    (blue)                                                                                                                              factbook/geos/xx.html
                                                                                                                                   [28] ExxonMobil Chemical Information, Global Tire
[15] W. H. Waddell, R. C. Napier and D. S. Tracey, Rub-   [17] w w w. e p a . go v/OM S/clima te/420 f 050 0 4 .                        Trends (2010).
     ber Chemistry and Technology 82 (2009) 229.               htm#step1                                                           [29] Beijing Traffic Management Bureau, www.bjjtgl.
[16] C. Lerner, presented at the IQCP - 4th Intelligent   [18] Bridgestone Europe NV/SA, www.bridgestone.                               gov.cn/publish/portal1,tab165/info16307.htm
     Tire Technology Conference, Wiesbaden, Ger-               eu, March (2009) 10.                                                [30] w w w.transpor t.rajasthan.gov.in/PDF%20
     many, October (2008).                                [19] w w w. c h i c a g o n o w. c o m / b l o g s / t h e - t i r e -        Files/.../Table%209.1.pdf

www.kgk-rubberpoint.de                                                                                                                                      KGK · Januar/Februar 2012     51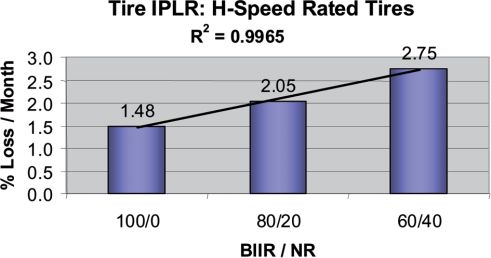
You can also read