Gas Market Report - Australian Energy ...
←
→
Page content transcription
If your browser does not render page correctly, please read the page content below
Gas Market Report

20 – 26 June 2021
Weekly Summary
Average prices increased above $10/GJ in all markets this week, continuing an upward trend
in market prices from the start of May. While demand was up in Adelaide by 10%, demand in
Brisbane dropped 10%, with Sydney and Victoria also falling slightly from the previous week.
The most notable trend however was the relative decrease in northern gas prices, sitting at
levels comparable to Victoria, which has until recently been well below STTM prices. Sydney
and Adelaide saw daily prices rising to around $13-15/GJ for most of the week.

Export pipeline flows reduced further this week, down 241 TJ/day following QCLNG planned
maintenance commencing from mid-June alongside slight reductions from the other
exporters over the week.

GPG gas usage was significantly lower this week, decreasing across all mainland regions
from quite high levels over the past fortnight. The largest decline occurred in Queensland,
with RBP auction activity related to GPG routes dropping off from quite high levels over
previous weeks. Lower GPG also coincided with Callide returning units to service from last
week, with another unit back online from 22 June. In South Australia, daily gas generation
remained relatively high during periods of low wind output, particularly for 19-21 June.

DAA participation remained strong with 1800 TJ of capacity won this week. Routes to move
gas north on the SWQP and MSP reduced, with more capacity won on routes delivering to
Wilton (Sydney) on the MSP.

Actual gas flows south increased markedly, with a significant increase in gas deliveries into
South Australia on the QSN link from 21 June and more gas flowing west from Wallumbilla
as Queensland gas prices reduced. Additional supply on the MSP from Moomba was the
main driver, with flows around 270-300 TJ over 21-23 June.

© Commonwealth of Australia                  1                AER reference: 39270 – #12,470,796

Long term statistics and explanatory material
The AER has published an explanatory note to assist with interpreting the data presented in
its weekly gas market reports. The AER also publish a range of longer term statistics on the
performance of the gas sector including gas prices, production, pipeline flows and consumer
demand.

Market overview
Figure 1 sets out the average daily prices ($/GJ) for the current week, and demand levels,
compared to historical averages. Regions shown include the Victorian Declared Wholesale
Market (VGM or Victorian gas market) and for the Sydney (SYD), Adelaide (ADL) and
Brisbane (BRI) Short Term Trading Market hubs (STTM).

Figure 1: Average daily prices and demand – all markets ($/GJ, TJ)1

                               Victoria                    Sydney             Adelaide                       Brisbane

                            Price       Demand         Price       Demand   Price         Demand      Price       Demand

20 Jun - 26 Jun 2021       10.87        1034           12.83        310     13.64          80        11.32         115

% change from
previous week
                             15           -2              16         -3      19            10            -3        -10

20-21 financial YTD         5.65         563           6.14         255     6.48           57        6.27          106

% change from
previous financial YTD
                            -14           -3              -6         5       -9             0            8         16

Figure 2 sets out price and demand information for the voluntary Wallumbilla and Moomba
Gas Supply Hubs (GSH).

Figure 2: Average prices and total quantity – Gas supply hub ($/GJ, TJ)2

                                      Moomba                   South East Queensland                  Wallumbilla

                              Price            Quantity            Price      Quantity             Price          Quantity

20 Jun - 26 Jun 2021            -                 -                11.27          120              10.42           483

% change from
previous week
                                -                 -                 7               -8              -2             226

20-21 financial YTD          3.04                338               6.17           6676             5.98           16588

% change from
previous financial YTD
                              -55                -37                8               -14             -2               9

1
         Average daily quantities are displayed for each region. The weighted average daily imbalance price applies for
         Victoria.
2
         The prices shown for the GSH in Moomba, South East Queensland and Wallumbilla are volume weighted average
         (VWA) prices for all products traded across the period. The total quantity contributing to the weighted price is
         displayed for these GSH. Reported values for Moomba are the aggregate of trades on the Moomba to Adelaide
         Pipeline (MAP) and the Moomba to Sydney Pipeline (MSP). Historic trades for RBP and SWQP are grouped under
         WAL, (including in-pipe trades on the RBP).

                                                               2
Figure 3 illustrates the daily prices in each gas market, as defined in figures 1 and 2.

Figure 3: Daily gas market prices ($/GJ)
  16

  14

  12

  10
$/GJ

       8

       6

       4

       2

       0
            20 Jun             21 Jun           22 Jun               23 Jun            24 Jun        25 Jun            26 Jun
                Sydney (Ex ante STTM)                        Adelaide (Ex ante STTM)              Brisbane (Ex ante STTM)
                Victoria (6am DWGM)                          Wallumbilla (VWA)                    Moomba (VWA)
                South East Queensland (VWA)

Figure 4 compares average ancillary market payments (VGM) and balancing gas service
payments (STTM) against historical averages.

Figure 4: Average daily ancillary payments ($000)

                                                  Victoria                   Sydney             Adelaide            Brisbane
                                              Ancillary Payments*              MOS                MOS                   MOS

20 Jun - 26 Jun 2021                                     -                    26.50               4.63                  0.83

% change from previous week                              -                      -16               -53                    -46

20-21 financial YTD                                                           19.93               7.67                  3.51

% change from previous financial
YTD
                                                                                 -5               80                    120

* Ancillary payments reflect the compensation costs for any additional injections offered at a price higher than the market price.
Note: only positive ancillary payments, reflecting system constraints will be shown here.

More detailed analysis on the VGM is provided in section 1.

                                                                     3
Figure 5 shows the quantity and volume weighted prices of products traded in the Gas
Supply Hub locations at Moomba, South East Queensland and Wallumbilla.
Figure 5: Gas supply hub products total traded for the current week ($/GJ, TJ)3
Moomba South East Queensland Wallumbilla*
VWA price Quantity VWA price Quantity VWA price Quantity
Balance of day - - 11.45 41.0 12.17 195.5
Daily - - 11.27 50.0 10.42 36.0
Day ahead - - 11.02 29.0 10.97 65.0
Weekly - - - - - -
Monthly - - - - 8.38 186.0
Total - - 11.27 120.0 10.42 482.5
* includes non-netted (off-market) trades.
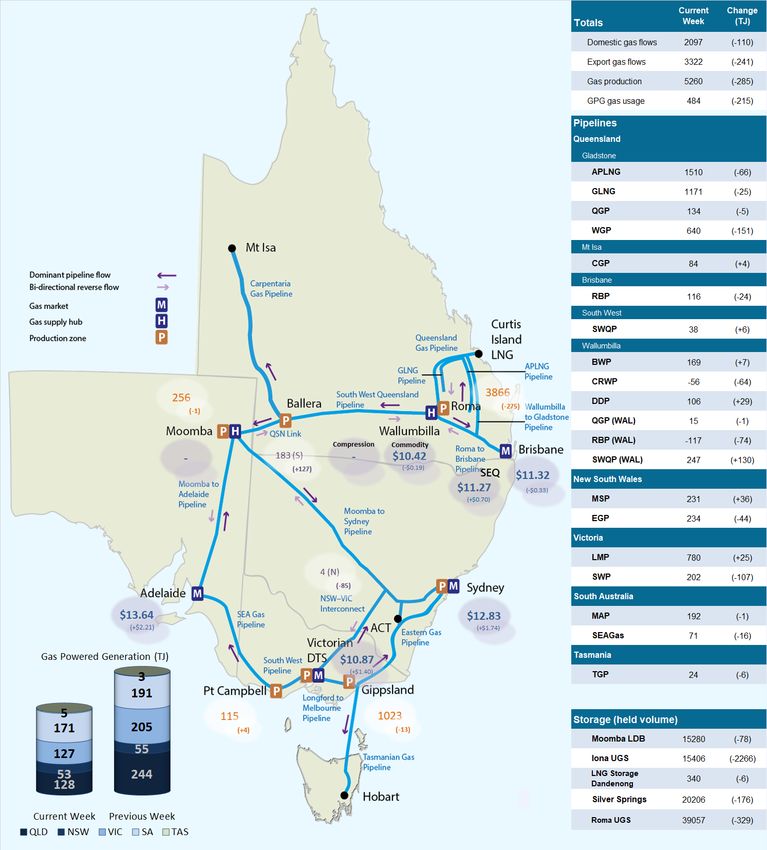
Figure 6 shows Bulletin Board pipeline flows for the three LNG export pipeline facilities and
the production output at related production facilities in the Roma region.
Figure 6: Average daily LNG export pipeline and production flows (TJ)*
APLNG GLNG QCLNG Total
Production 1513 996 1419 3928
Export Pipeline Flows 1510 1171 640 3322
% change from previous
week (pipeline flows)
-4 -2 -19 -7
20-21 financial YTD Flows 1470 1003 1298 3771
* Production quantities represent flows from facilities operated by APLNG, Santos and QGC. Gas from individual facilities may
also supply the domestic market, other LNG projects or storage facilities.
3
Further information about new product trading locations in Victoria (Culcairn) and Sydney (Wilton) is available in
section 6. Gas Supply Hub).
4Detailed market analysis
Gas market prices
With the price increases in Sydney and Adelaide reaching $13-$15/GJ, and Brisbane steady
or falling, the northern prices reduced below southern prices on average for June. In Victoria,
unplanned facility outages impacted supply across the week, however prices increased prior
to the outages commencing. The highest prices on 21 and 22 June coincided with high
demand, forecast above 1.2 PJ and 1.1 PJ respectively (figure 1.2).4
In Sydney, demand was up around 335 TJ over 21-23 June coinciding with higher prices.5
Higher levels of MSP supply to the hub were also complimented by 20-30 TJ of daily supply
from Newcastle over the same period.
Upstream demand for gas generation was relatively high in Adelaide as the week
commenced due to low wind output. GPG levels dropped from 22 June, but prices continued
to increase over the week with GPG gradually ramping back up. Increases to industrial
demand forecasts drove higher network demand later in the week. Prices reached a high of
$14.70/GJ on Friday.6
Supply outages in Victoria
On 21 June, supply reduced from the Longford production facility in Victoria due to the trip of
an offshore platform.7 This triggered a forecast pressure breach at the Dandenong and Sale
City Gates, leading to AEMO issuing a notice of a threat to system security, with a potential
requirement of an additional 40 TJ of supply being required from Dandenong LNG, VicHub
and/or TasHub injection points. Out-of-merit-order injections were not required on the day
due to lower than forecast demand and an increase in Longford output, resulting in no
market impact from the outage.
21 June was a day of high GPG demand in Victoria. Cold weather following an overnight
minimum temperature of 4 degrees in Melbourne also drove high residential demand for gas
heating. Following the unplanned outage at Longford, the facility was constrained to 701 TJ
for the gas day from the 2 pm scheduling interval (a 30 TJ supply reduction). A threat to
system security notice was subsequently issued at 2.48 pm, leading to VicHub and TasHub
connection points being constrained to profile net injections for the 6 pm and 10 pm
scheduling intervals. While net injections were profiled to increase in order to avoid pressure
breaches, this did not commence until 8 pm. Longford notified AEMO just prior to 9 pm of a
further 60 TJ reduction from previous supply restrictions, reducing daily supply to 634 TJ,
however higher production output and lower than expected demand over the day into the
4
Daily imbalance prices were $12.37/GJ and $12.59/GJ for the 21 and 22 June gas days respectively. On 21 June,
schedule price increases occurred following the beginning of day schedule ($14.50/GJ at 10 am, $17/GJ at 2 pm and
$13.48 at 6 pm) with AEMO applying overrides (21 TJ at 10 am and 25 TJ at 2 pm) following actual demand tracking
higher than forecast across the first scheduling interval. Subsequent measurements revealed actual demand had
tracked lower than the 10 am and 2 pm schedule forecasts, however the additional linepack from increased injections
helped avoid the need for market intervention in subsequent schedules.
5
There was a significant drop in cheaper capacity being offered into the ex ante schedules by exporter/producers from
22 June, particularly on the EGP following an outage at Longford on 21 June. Demand forecasts were 19.5 TJ and
39.4 TJ higher than D-2 provisional schedules on 22 and 23 June respectively (this was a contributing factor to higher
price forecasts mid-week, with a change in the trend of reduced ex ante prices that have been occurring in recent
weeks). The ex ante price exceeded the D-2 provisional forecast on 23 June, only the 2nd instance this June. This
coincided with backhaul bids being cleared, comprising 31.7 TJ of the 39.4 TJ increase in ex ante demand. The
majority of this was related to backhaul bids submitted at $20/GJ or higher on the EGP in the D-1 schedule (26 TJ).
6
The higher ex ante price on 25 June was also influenced by rebidding of capacity to higher price bands.
7
Just after midday, AEMO was notified of the offshore platform trip affecting supply to Longford.
5evening peak mitigated the requirement for market intervention.8 The threat to system
security was cancelled prior to 10 pm.
On the afternoon of 22 June, an industry conference was convened by AEMO for
participants in the Victorian DWGM, and Adelaide and Sydney STTMs, to advise of an
unplanned outage affecting the Iona underground storage facility. A short-notice urgent
repair was scheduled to commence from midday on 24 June to isolate a section of pipeline
affected by a gas leak resulting from corrosion. The plant was taken offline and returned to
service prior to the following gas day (see figure 1.5).9
Capacity reduction on the Roma to Brisbane Pipeline
Capacity on the Roma to Brisbane Pipeline reduced to 128.3 TJ/day from 24 June (down
from 185 TJ) due to planned maintenance commencing on the Dalby compressor station.
Actual flows on the pipeline reduced to 110 TJ from 140 TJ the day prior.
8
Demand overrides of 21TJ and 35 TJ were applied to the 10am and 2pm scheduling intervals respectively, due to
differences in AEMO and market participant forecast demand levels. This assisted in offsetting the need for additional
supply later in the day. An ad-hoc schedule was developed to manage the Longford outage, but it was not utilised.
Longford ramped up from 2 pm and was supplying well above forecast by the 10 pm scheduling interval.
9
A cancelled outage on the Mortlake to Heywood 500 kV transmission line in the National Electricity Market assisted in
reducing gas powered generation requirements in Victoria and South Australia while the temporary pipeline repairs
took place at Iona. The Iona storage facility was taken offline while the affected section of pipeline was removed, with
blind flanges welded on both ends to seal the leaking segment. Subsequent repairs at the facility were later
scheduled to take place from 26 June – 2 July, however this outage window was extended to 8 July (on 2 July) and
then to 31 July (on 5 July).
6Detailed Market Figures
1. Victorian Declared Wholesale Market
In the Victorian gas market, gas is priced five times daily at 6 am, 10 am, 2 pm, 6 pm and
10 pm. The imbalance weighted price on a gas day tends towards the 6 am price10 which is
the schedule at which most gas is traded.
The main drivers11 of price are demand forecasts and bids to inject or withdraw gas from the
market. Figures 1.1 to 1.4 below show the daily prices, demand forecasts12, and
injection/withdrawal bids for each of the five pricing schedules. Figure 1.5 provides
information on which system injection points were used to deliver gas, in turn indicating the
location and relative quantity of gas injection bids cleared through the market.
Ancillary payments for gas injected above the market price are shown above in figure 3.
Figure 1.1: Prices by schedule ($/GJ)
18
16
14
12
10
8
$/GJ
6
4
2
0
20 Jun 21 Jun 22 Jun 23 Jun 24 Jun 25 Jun 26 Jun
6am 10am 2pm 6pm 10pm Daily Imbalance Weighted Average Price
Figure 1.2: Demand forecasts (TJ)
1300
1200
1100
1000
900
800
700
600
TJ
500
400
300
200
100
0
20 Jun 21 Jun 22 Jun 23 Jun 24 Jun 25 Jun 26 Jun
6am 10am 2pm 6pm 10pm
10
Prices for subsequent schedules are applied only to the differences in scheduled quantities (imbalances) to calculate
the weighted price. The 6 am price applies to the entire scheduled quantity in the initial schedule.
11
The price might also be affected by transmission or production (contractual) constraints limiting how much gas can be
delivered from a locale or System Injection Point (SIP) from time to time.
12
These are Market Participants’ aggregate demand forecasts adjusted for any override as applied by AEMO from time
to time. These forecasts must be scheduled and cannot respond to price like withdrawal bids.
7Figure 1.3: Injection bids by price bands (TJ)
2500
2000
1500
TJ
1000
500
0
6am
6pm
6am
6pm
2pm
6pm
2pm
6pm
2pm
6am
2pm
6am
2pm
2pm
6am
6am
6am
6pm
6pm
2pm
6pm
10pm
10pm
10am
10am
10am
10pm
10am
10am
10am
10pm
10am
10pm
10pm
10pm
20 Jun 21 Jun 22 Jun 23 Jun 24 Jun 25 Jun 26 Jun
$02. Sydney STTM
In each STTM hub, a daily gas price is calculated before the gas day (the ex ante price) and
after the gas day (the ex post price). The main drivers of these prices are participant demand
forecasts, and offers to inject or bids to withdraw gas traded at the hub.13 Divergences in
ex ante and ex post prices for a gas day may occur due to differences in scheduled
(forecast) and allocated (actual) quantities. Pipeline acronyms are defined in the user guide.
Market Operator Service balancing gas (MOS) payments arise because the amount of gas
nominated on pipelines for delivery on a gas day will either exceed or fall short, by some
amount, of the amount of gas consumed in the hub. In such circumstances, MOS payments
are made to participants for providing a service to park gas on a pipeline or to loan gas from
a pipeline to the hub.14
Figures 2.1 and 2.2 show daily prices, demand, offers and bids. Figures 2.3 and 2.4 show
gas scheduled and allocated on pipelines to supply the hub, indicating the location and
relative quantity of gas offers across pipelines and also the amount of MOS allocated for
each pipeline.
Figure 2.1: SYD STTM daily ex ante and ex post prices and quantities
Sun Mon Tue Wed Thu Fri Sat
Ex ante price ($/GJ) 11.09 12.00 14.51 14.85 13.88 12.50 10.95
Ex ante quantity (TJ) 283 328 338 337 305 301 280
Ex post price ($/GJ) 11.99 12.50 14.53 14.61 13.88 12.49 10.49
Ex post quantity (TJ) 307 346 342 333 300 294 274
Figure 2.2: SYD daily hub offers and daily hub bids in price bands ($/GJ)
900 600
800
500
700
600 400
Bids (TJ)
Offers (TJ)
500
300
400
300 200
200
100
100
0 0
20 Jun 21 Jun 22 Jun 23 Jun 24 Jun 25 Jun 26 Jun 20 Jun 21 Jun 22 Jun 23 Jun 24 Jun 25 Jun 26 Jun
Pricetaker 0Figure 2.3: SYD net scheduled and allocated gas hub supply (excluding MOS)
Figure 2.3 shows the daily scheduled and allocated quantities sorted by facility for Sydney
this week. For a more detailed description of this figure, please refer to the user guide.
350
300
250
200
150
TJ
100
50
0
Sched Alloc Sched Alloc Sched Alloc Sched Alloc Sched Alloc Sched Alloc Sched Alloc
20 Jun 21 Jun 22 Jun 23 Jun 24 Jun 25 Jun 26 Jun
EGP MSP ROS NGS
Figure 2.4: SYD MOS allocations (TJ), service payments and commodity
payments/charges ($000)15
80 $300
60 $200
40
$100
20
$0
TJ
0
-$100
-20
-$200
-40
-60 -$300
-80 -$400
20 Jun 21 Jun 22 Jun 23 Jun 24 Jun 25 Jun 26 Jun 20 Jun 21 Jun 22 Jun 23 Jun 24 Jun 25 Jun 26 Jun
EGP - Allocation MSP - Allocation
EGP - Decrease MSP - Decrease MOS Service Payment MOS Commodity Payment MOS Commodity Charge
EGP - Increase MSP - Increase
15
The commodity cost of MOS illustrated on the right of the figure represents the commodity quantity at the D+2
ex ante price. Commodity payments and charges for a given gas day relate to quantities traded two days earlier. That
is, the commodity cost for services provided on Sunday will appear in the chart for Tuesday, when the D+2 price is
set. In contrast, service payments are shown alongside the day they occurred.
103. Adelaide STTM
The Adelaide STTM hub functions in the same way as the Sydney STTM hub. The same
data that was presented for the Sydney hub is presented for the Adelaide hub in the figures
below.
Figure 3.1: ADL STTM daily ex ante and ex post prices and quantities
Sun Mon Tue Wed Thu Fri Sat
Ex ante price ($/GJ) 12.74 13.31 13.30 14.10 14.00 14.70 13.30
Ex ante quantity (TJ) 70 80 82 79 86 88 77
Ex post price ($/GJ) 12.50 13.31 13.28 14.21 14.00 14.08 12.85
Ex post quantity (TJ) 66 79 79 82 84 85 74
Figure 3.2: ADL daily hub offers and daily hub bids in price bands ($/GJ)
300 180
160
250
140
200 120
Bids (TJ)
Offers (TJ)
100
150
80
100 60
40
50
20
0 0
20 Jun 21 Jun 22 Jun 23 Jun 24 Jun 25 Jun 26 Jun 20 Jun 21 Jun 22 Jun 23 Jun 24 Jun 25 Jun 26 Jun
Pricetaker 04. Brisbane STTM
The Brisbane STTM hub functions in the same way as the Sydney STTM hub. The same
data that was presented for the Sydney hub is presented for the Brisbane hub in the figures
below.
Figure 4.1: BRI STTM daily ex ante and ex post prices and quantities
Sun Mon Tue Wed Thu Fri Sat
Ex ante price ($/GJ) 11.97 11.50 12.21 11.80 10.99 9.50 11.26
Ex ante quantity (TJ) 114 132 134 132 107 97 87
Ex post price ($/GJ) 11.23 11.50 11.97 11.99 11.25 9.49 10.90
Ex post quantity (TJ) 110 132 130 135 110 94 85
Figure 4.2: BRI daily hub offers and daily hub bids in price bands ($/GJ)
300 250
250 200
200
150
Bids (TJ)
Offers (TJ)
150
100
100
50
50
0 0
20 Jun 21 Jun 22 Jun 23 Jun 24 Jun 25 Jun 26 Jun 20 Jun 21 Jun 22 Jun 23 Jun 24 Jun 25 Jun 26 Jun
Pricetaker 05. National Gas Bulletin Board
Figure 5.1 shows average daily actual flows for the current week16 from the Bulletin Board
(changes from the previous week’s average are shown in brackets). Average daily prices17
are provided for gas markets and gas supply hubs. Average daily quantities are provided for
gas powered generation for each region.
Figure 5.1: Gas market data ($/GJ, TJ); Bulletin Board flows (TJ)18
16 Domestic gas flows are calculated as the total of: SA = MAP + SEAGAS; VIC = SWP + LMP + (flows towards
Victoria on the ‘NSW-VIC interconnect’); NSW/ACT = EGP + MSP; TAS = TGP; QLD (Brisbane) = RBP;
QLD (Mt Isa) = CGP; and QLD (Gladstone) = QGP.
Export gas flows are calculated as the total of: the APLNG pipeline; the GLNG pipeline; and the Wallumbilla to
Gladstone pipeline.
GPG volumes may include gas usage that does not show up on Bulletin Board pipeline flows.
17 GSH supply is the average daily volume of gas ‘traded’, while price is a volume weighted average. Optional hub
services (for compression and redirection) are shown separately from commodity trades.
18 Net flows are shown for Bulletin Board facilities, as outlined in the user guide.
136. Gas Supply Hub
The gas supply hub was established at Wallumbilla in March 2014 to facilitate the voluntary
trading of gas between participants, with products listed for sale and purchase at delivery
points on three major connecting pipelines. There are separate products for each trading
location and delivery period (daily, day-ahead, balance-of-day, weekly and monthly
products).19
The Moomba hub commenced operation from June 2016 to further facilitate trading on the
MAP and MSP, with trading between the two hubs on the SWQP via a spread product
(representing the price differential between the hubs). From October 2016, the addition of a
Wallumbilla Compression Product was introduced to facilitate the supply hub’s transition
from three different trading locations into one. From March 2017, Wallumbilla transitioned
into an optional hub services model, replacing the three trading locations (QGP, SWQP and
RBP) with a single product at Wallumbilla (WAL) and an in-pipe RBP trading location at
South East Queensland (SEQ). On 28 January 2021, trading locations at Wilton (Sydney)
and Culcairn (Victoria) were introduced.
This week there were 76 trades for 602.5 TJ of gas at a volume weighted price of $10.59/GJ.
These consisted of 50 trades at WAL (482.5 TJ at $10.42/GJ) and 26 trades at SEQ (120 TJ
at $11.27/GJ). There were 9 spread trades this week between SEQ and WAL.
Figure 6.1 shows the quantity of gas traded by product type for each trading day on pipeline
trading locations in the Wallumbilla and Moomba Gas Supply Hubs.20
Figure 6.1: GSH traded quantities
300
250
200
Volume Traded (TJ)
150
100
50
0
WAL*
SEQ
WAL*
SEQ
WAL*
SEQ
WAL*
SEQ
WAL*
SEQ
WAL*
SEQ
WAL*
SEQ
20 Jun 21 Jun 22 Jun 23 Jun 24 Jun 25 Jun 26 Jun
Balance of day Daily Day ahead Monthly Weekly
19 Additional information on trading locations and available products is detailed in the user guide.
20 Non-netted (off-market) trades, allowing the selection of specific delivery point at a trading location, are included with
other Wallumbilla trades (WAL*). Non-netted trades at Moomba are shown separately (MOO) from MAP and MSP.
147. Day Ahead Auction
The DAA is a centralised auction platform providing the release of contracted but un-
nominated transportation capacity on designated pipelines and compression facilities across
eastern Australia. The auction, enables transportation facility users to procure residual
capacity on a day-ahead basis after nomination cut-off, with a zero reserve price and
compressor fuel provided.
Participants may bid in to the DAA in order to procure the following services:
park services;
forward haul pipeline services with products offered in both directions on bi-
directional pipelines;
interruptible backhaul services; and
stand-alone compression services.
This week, 16 participants took part in the DAA, winning 1800 TJ of capacity across 10
different facilities.
Figure 7.1 shows the quantities of gas and auction legs won through the DAA by gas date,
with gas deliverable up to the level of capacity procured. Auction legs reflect each individual
facility transaction.21
Figure 7.1: DAA traded quantities and auction legs won
400 40
Capacity quantity won (TJ)
350 35
Auction legs won
300 30
250 25
200 20
150 15
100 10
50 5
0 0
20 Jun 21 Jun 22 Jun 23 Jun 24 Jun 25 Jun 26 Jun
MSP SWQP RBP WCFA WCFB
EGP CGP MCF BWP MAPS
ICF QGP VICHUB Auction legs
Australian Energy Regulator
July 2021
21
Additional information is available in the user guide to the AER gas weekly report.
15You can also read