Assessment of Ground Water Quality in Jaipur City (Rajasthan, India)
←
→
Page content transcription
If your browser does not render page correctly, please read the page content below
International Journal of Enhanced Research in Science Technology & Engineering, ISSN: 2319-7463
     Vol. 3 Issue 7, July-2014, pp: (89-101), Impact Factor: 1.252, Available online at: www.erpublications.com

     Assessment of Ground Water Quality in Jaipur
               City (Rajasthan, India)
     Jayshri Kala1, Prof. Gunwant Sharma2, Prof. Sudhir Kumar3, Dr. Satish Pipralia4
                      1
                      Junior Scientific Officer, Rajasthan State Pollution Control Board, Jaipur, India
                23
                 Department of Civil Engineering, Malaviya National Institute of Technology, Jaipur, India
            4
              Department of Architecture and Planning, Malaviya National Institute of Technology, Jaipur, India

Abstract: An attempt has been made in this investigation to ascertain ground water quality in Jaipur city. Hundred
and fifty samples are taken from various parts of the city, and the results are being compared with IS: 10500
standard of the water quality parameter and subsequently computed the water quality index. The samples are
collected in 2010 in the pre-monsoon period (March to June). The results reveal that most of the locations have good
to excellent water quality. However, nitrate contamination is a concern in the study area as two-fifth of the total
number of locations has nitrate levels beyond permissible limits. It signifies poor sanitation condition in the study
area. It follows from the research that augmentation of sewerage infrastructure and its coverage is essential to bring
down pollution levels in the study area.

Keywords: Jaipur City, Ground water quality, Water quality index.

                                                       1. Introduction

Jaipur city is the most populous city of Rajasthan State. Its rapid pace of growth has resulted in severe stress on ground
water resources, both in qualitative and quantitative terms. While over exploitation of ground water resources, lack of
surface water bodies and adverse climatic conditions aggravates the imbalance between the recharge and draft, the available
ground water shall be rendered unfit if pollution levels continue to rise. In the light of the above facts an attempt has been
made in this investigation to study the status of ground water quality in Jaipur city.

                                                        2. Study Area

Jaipur, the capital city of Rajasthan State in India, is the tenth most populous city of the country. It is located at 260 54’N
latitude and 75049’E longitude and experiences a continental type of climate. The city witness extreme temperatures both in
summer as well as in winters and low to moderate relative humidity. The highest mean monthly maximum temperature of
40.6º C is recorded in May and the lowest mean monthly temperature of 8.3º C is recorded in January. The city receives 90
per cent of its rainfall during the monsoon period (June-September) and the average annual rainfall in the city is 567.70
mm. Studies reveal that probability of exceedance of average annual rainfall in Jaipur city is about 25% and normal drought
19.4% whereas probability of severe and most severe drought is almost negligible (CDP,2005).

The ground water resources assume greater significance in Jaipur city due to the absence of perennial surface water sources.
State Ground State Board study (2011) reveals that Jaipur city predominantly depends (86%) on ground water resources for
its potable water supply. The current rate of ground water abstraction (95MCM/Annum) is not sustainable. The water table
throughout the entire city area has fallen dramatically over the past three decades and continues to decline at an alarming
rate, accompanied by increasing concentrations of nitrates in the ground water supply; and that the ground water resources
within many parts of Jaipur city will be substantially exhausted in the near future unless appropriate measures are taken to
significantly reduce the rate of abstraction and pollution.
                                                                                                                      Page | 89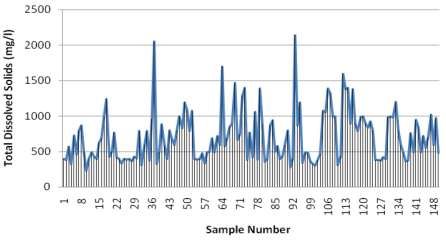
International Journal of Enhanced Research in Science Technology & Engineering, ISSN: 2319-7463
     Vol. 3 Issue 7, July-2014, pp: (89-101), Impact Factor: 1.252, Available online at: www.erpublications.com

                                         Figure 1: Description of the Study Area

                                                3. Materials and Methods

Jaipur water supply system is categorized in four water supply zones of Public Health Engineering Department (PHED);
and the water supply is augmented through 1380 tube wells. A total of 150 tube wells were selected to collect water
samples by employing stratified random sample survey technique such that all parts of Jaipur city are suitably represented.
Water samples were collected in High density poly ethylene (HDPE) plastic bottles and subsequently analyzed parameters
such as pH, total alkalinity, total dissolved solids, chlorides, total hardness, sulphate, nitrate and fluoride as per the
experimental procedures suggested in American Public Health Association (APHA) manual. Further, water quality index
(WQI) has been computed for each sample. The results are presented in subsequent paragraphs, in sequel.

                                                          4. pH

pH is measure of relative acidity or alkalinity of water. It measures the concentration of hydrogen ions in water. If free H+
ions are more than OH- ions, the water will be acidic and vice versa. The pH value is expressed as the negative logarithm of
Hydrogen ion concentration:
pH= -log 10 a H+ ; where H+ = Activity of hydrogen ions
A pH value of 7 indicates natural water; if the pH value is below 7 the water is acidic and if the value is above 7 the water
is considered alkaline. However, pH of natural water is generally over 7 due to presence of sufficient quantities of
carbonates.
pH is one of the most important operational water quality parameters. Its control is necessary at all stages of water
treatment to ensure satisfactory water clarification and disinfection and to minimize the corrosion of water mains and pipes
in household water systems. Failure to minimize corrosion can result in the contamination of drinking-water and in adverse
effects on its taste and appearance. Having the above knowledge, this parameter was studied by a digital pH meter in detail
and results are presented in Table 1 and Figure 2 and Figure 3.

                                                                                                                    Page | 90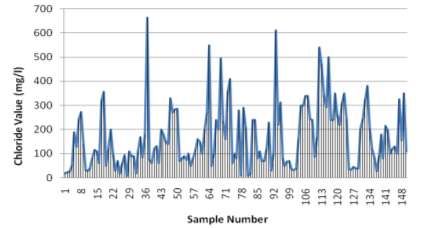
International Journal of Enhanced Research in Science Technology & Engineering, ISSN: 2319-7463
     Vol. 3 Issue 7, July-2014, pp: (89-101), Impact Factor: 1.252, Available online at: www.erpublications.com

                                      Table 1: Distribution of pH Level in Jaipur City

     Serial No.              pH Range                    No. of Samples                       Per cent Distribution

         1                      ≤7.5                            15                                     10
         2                   7.51 - 8.00                        62                                     41
         3                   8.01 - 8.50                        60                                     40
         4                   8.51 - 9.00                        13                                     9
                    Total                                      150                                    100

It is observed from the Table 1 and Figure 2 that the pH values of ground water samples in the study area range between 7.5
to 9.0; and two-fifth (40 per cent) of the total number of samples have pH value 8.00 to 8.50 and almost equal numbers (41
per cent) have the pH value 7.50 to 8.00. Further, it has been observed that one-tenth (10 per cent) of the total number of
samples have pH value less than or equal to 7.5 and less than one-tenth (9 per cent) of the total number of samples have pH
value more than 8.50. As per WHO norms and Indian standard (IS: 10500) the acceptable range of pH value is 6.5 to 8.5.
The analysis of data reveals that nine-tenth (91 per cent) of the total number of samples have pH value within permissible
limits and that only less than one-tenth (9 per cent) of the total number of samples have pH value more than permissible
limit. The distribution of pH values in Jaipur city is presented in Figure 3.

                               Figure 1: pH levels and per cent share of samples in Jaipur City

                                     Figure 2: Distribution of pH Values in Jaipur City
                                                                                                                      Page | 91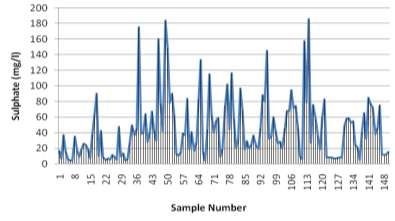
International Journal of Enhanced Research in Science Technology & Engineering, ISSN: 2319-7463
Vol. 3 Issue 7, July-2014, pp: (89-101), Impact Factor: 1.252, Available online at: www.erpublications.com
5. Total dissolved solids (TDS)
Total dissolved solids (TDS) comprise inorganic salts (principally calcium, magnesium, potassium, sodium, bicarbonates,
chlorides and sulfates) and small amounts of organic matter that are dissolved in water. TDS in drinking-water originates
from natural sources, sewage, urban runoff and industrial wastewater. A high content of dissolved solids elevates the
density of water, and reduces solubility of gases and utility of water for drinking, irrigation and industrial purposes. The
concentration of TDS determines the palatability of a water sample. The palatability of water with a total dissolved solids
(TDS) level of less than about 600 mg/l is generally considered to be good; drinking-water becomes significantly and
increasingly unpalatable at TDS levels greater than about 1000 mg/l, and may cause gastro intestinal irritation. On the basis
of above knowledge it was considered important to study this parameter and the results are presented in Table 2 and Figure
4 and Figure 5.
Table 2: Distribution of TDS Level in Jaipur City
Serial No. TDS Range No. of Samples Per cent Distribution
1 ≤ 500 65 44
2 500-1000 62 41
3 1000-1500 19 13
4 1500-2000 2 1
5 2000-2500 2 1
Total 150 100
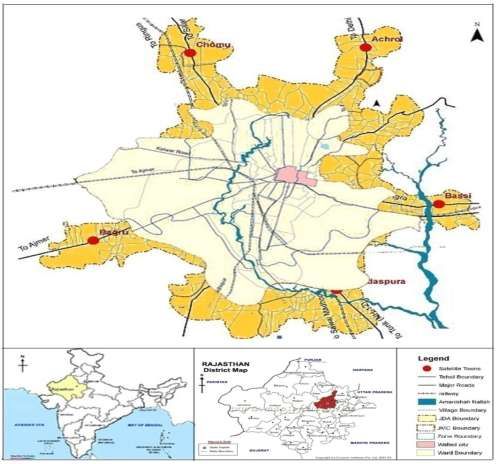
It is evident from the Table 2 and Figure 4 that little more than two-fifth (44 per cent) of the total water samples have TDS
less than or equal to 500 mg/l while another two-fifth (41 per cent) have the values between 500-1000 mg/l whereas almost
one-eighth (13 per cent) of the total number of samples have TDS between 1000-1500 mg/l and only few samples ( 2 per
cent) have TDS more than 1500 mg/l. As per experimental results the TDS of ground water samples ranged between 228-
2140 mg/l. Analyses of results reveal that almost three-fifth (59 per cent) of the total samples are above the desirable limit
of 500 mg/l as spelt in IS: 10500. Further, experimental results reveal maximum concentration of TDS in areas of C-
scheme and 22 Godown , Amer Road, Goner Road, Sanganer and the values are: 1698 mg/l,1595mg/l, 2050mg/l, 2140mg/l,
respectively. The distribution of TDS values in Jaipur city is presented in Figure 5.
Figure 3: TDS levels and per cent share of samples in Jaipur City
Page | 92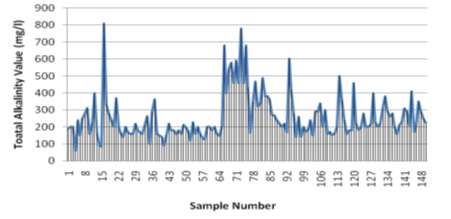
International Journal of Enhanced Research in Science Technology & Engineering, ISSN: 2319-7463
     Vol. 3 Issue 7, July-2014, pp: (89-101), Impact Factor: 1.252, Available online at: www.erpublications.com

                                       Figure 4: Distribution of TDS Level in Jaipur City

                                                        6. Alkalinity

Alkalinity of water is its capacity of combing with hydrogen (H +) ions i.e. its capacity to neutralize a strong acid; therefore,
it affects the palatability of water. A number of bases viz., carbonates, bicarbonates, hydroxides, phosphates, nitrates,
silicates, borates etc. contribute to alkalinity, however, in natural waters, carbonates, bicarbonates and hydroxides are
considered to be the predominant bases. Thus alkalinity may be expresses as total alkalinity or alkalinity due to individual
bases. In this investigation total alkalinity has been computed for the collected samples. Alkalinity in samples was estimates
by titrating it with 0.02N H2SO4 using phenolphthalein and methyl orange as indicators and the results are presented in
Table 3 and Figure 6 and Figure 7.

It is evident from the Table 3 and Figure 6 that one-third (34 per cent) of the total number of samples have total alkalinity
less than 200 mg/l while another two-fifth (40 per cent) have values between 200-300mg/l and about one-tenth (11 per cent)
of the total number of samples have values between 300-400mg/l whereas a little less than one-sixth (15 per cent) of the
total samples have total alkalinity more than 400mg/l. It has been observed that only one-third (34 per cent) of the total
number of samples has total alkalinity within the desirable limit of less than 200 mg/l. The distribution of total alkalinity
values in Jaipur city is presented in Figure 7.

                             Figure 5: Total Alkalinity and per cent share of samples in Jaipur City
                                                                                                                        Page | 93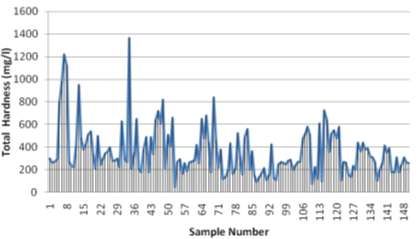
International Journal of Enhanced Research in Science Technology & Engineering, ISSN: 2319-7463
     Vol. 3 Issue 7, July-2014, pp: (89-101), Impact Factor: 1.252, Available online at: www.erpublications.com

                                 Table 3: Distribution of Total Alkalinity Level in Jaipur City

                    Serial     Total Alkalinity as       No. of
                                                                              Per cent Distribution
                     No.         CaCO3, mg/l            Samples

                        1.
International Journal of Enhanced Research in Science Technology & Engineering, ISSN: 2319-7463
     Vol. 3 Issue 7, July-2014, pp: (89-101), Impact Factor: 1.252, Available online at: www.erpublications.com

It is evident from the Table 4 and Figure 8 that half (51 per cent) of the total samples have total hardness of less than 300
mg/l while about three-tenth (29 per cent) have values between 300-500 mg/l and one-fifth of the total samples have total
hardness of more than 500mg/l. It is observed further that total hardness of ground water samples ranged between 48-
1368mg/l and three-tenth (31 per cent) of the total samples have total hardness beyond permissible limit. The distribution of
total hardness in Jaipur city is presented in Figure 8.

                                Figure 7: Distribution of Total Hardness Level in Jaipur City

                            Figure 8: Total Hardness and per cent share of samples in Jaipur City

                                                        8. Chloride

Inland natural water, in general, has low chloride concentration, often less than that of bicarbonates and sulphates. A high
concentration of chlorides may harm metallic pipes and structures, as well as growing plants and causes laxative effects in
humans. In natural fresh water high concentration of chlorides is considered to be an indicator of pollution due to organic
wastes of animal origin or industrial contamination. Chloride content above 250 mg/l makes water salty in taste; however, a
level up to 1000mg/l is safe to human consumption. Chloride in the collected samples was estimated by using AgNO 3
solution as titrant and potassium chromate as an indicator and the results are presented in Table 5 and Figure 10 and Figure
11.
                                                                                                                    Page | 95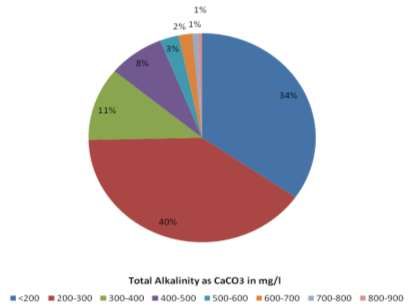
International Journal of Enhanced Research in Science Technology & Engineering, ISSN: 2319-7463
     Vol. 3 Issue 7, July-2014, pp: (89-101), Impact Factor: 1.252, Available online at: www.erpublications.com

It is evident from the Table 5 and Figure 10 that more than three-fourth (77 per cent) of the total samples have chloride less
than 250 mg/l while another one-eighth (13 per cent) have values between 250 – 350 mg/l and only one-tenth (10 per cent)
of the total samples have chloride more than 350 mg/l. Further, it has been observed that all the samples have chloride
concentration within permissible limit, however, about one-fourth (23 per cent) of the total samples has chloride more than
the desirable limit. The distribution of chloride levels in Jaipur city is presented in Figure 11.

                                    Table 5: Distribution of Chloride Level in Jaipur City

 Serial No.          Chloride (mg/l)                No. of Samples                 Per cent Distribution

      1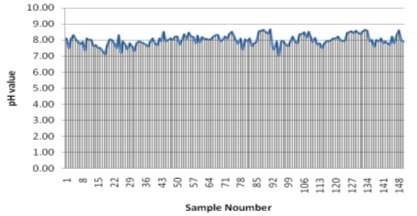
International Journal of Enhanced Research in Science Technology & Engineering, ISSN: 2319-7463
     Vol. 3 Issue 7, July-2014, pp: (89-101), Impact Factor: 1.252, Available online at: www.erpublications.com

                                                         9. Flouride

Fluorides are more common in ground waters than in surface waters. The main sources of fluoride in water are different
fluoride bearing rocks and minerals like fluoride, apatite, amphiboles and micas. The maximum permissible limit for
fluoride in drinking water is recommended to be 1.5 mg/l by W.H.O. When present in higher concentration it causes
mottling of teeth, skeleton fluorosis, forward bending of vertebral column, deformation of knee joints and other parts of the
body, etc. Electrode method was used to estimate fluoride in the collected samples and the results are presented in Table 6
and Figure 12 and Figure 13. It is evident from the Table 6 and Figure 12 that nine-tenth (92 per cent) of the total samples
have fluoride less than 1mg/l while another four per cent have fluoride concentration between 1-1.5mg/l and another four
per cent samples have fluoride concentration beyond 1.5mg/l. It is evident further that only less than one-tenth (8 per cent)
of the total samples has fluoride concentration beyond desirable limits. The distribution of Fluoride values in Jaipur city is
presented in Figure 13.

                                    Table 6: Distribution of Fluoride Level in Jaipur City

         Serial No.        Fluoride mg/l           No. of Samples                    Per cent Distribution
              1                 ≤ 1.00                   138                                      92
              2               1.00-1.50                   6                                       4
              3               1.50-2.00                   3                                       2
              4               2.00-2.50                   2                                       1
              5               2.50-3.00                   1                                       1

                               Figure 11: Fluoride and per cent share of samples in Jaipur City

                                   Figure 12: Distribution of Fluoride Level in Jaipur City

                                                                                                                     Page | 97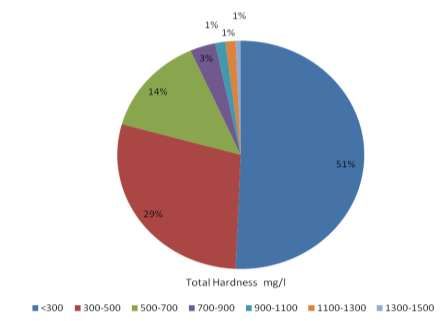
International Journal of Enhanced Research in Science Technology & Engineering, ISSN: 2319-7463
     Vol. 3 Issue 7, July-2014, pp: (89-101), Impact Factor: 1.252, Available online at: www.erpublications.com

                                                     10. Nitrate- Nitrogen

Nitrate (NO3−) is found naturally in the environment and is an important plant nutrient. It is the highest oxidized form of
nitrogen and in water its most important source is biological oxidation of nitrogenous organic matter of both autochthonous
and allochthonous origin. It can reach both surface water and groundwater as a consequence of agricultural activity
(including excess application of inorganic nitrogenous fertilizers and manures), from wastewater disposal and from
oxidation of nitrogenous waste products in human and animal excreta, including septic tanks. High concentration of nitrate
in water is indicative of pollution. In excess, it causes ubiquitous growth of algae. High nitrate content (>40 mg No3-N/L)
may cause blue-baby disease. Nitrate in the collected samples was determined at 220 nm by using spectrophotometer and
the results are presented in Table 7 and Figure 14 and Figure 15.
It is evident from the Table and Figure that almost three-fifth (59 per cent) of the total number of samples have nitrate
concentration less than or equal to 45 mg/l while another three-tenth (30 per cent) have the values between 46 – 100 mg/l
and a little more than one-tenth (11 per cent) of the total samples have nitrate concentration above 100 mg/l. further, it is
evident that while three-fifth of the total number of samples have nitrate concentration within desirable limits; only one-
tenth (11 per cent) of the samples have nitrate beyond permissible limits. The distribution of nitrate level in Jaipur city is
presented in Figure 15.

                                  Table 7: Distribution of Nitrate Level in Jaipur City
         Serial No.        Nitrate as NO3, mg/l                 No. of Samples                   Per cent Distribution
             1                     ≤ 45                                89                                 59
             2                    46-100                               45                                 30
             3                   100-150                               9                                  6
             4                   150-200                               4                                  3
             5                   200-250                               2                                  1
             6                   250-300                               1                                  1

                                Figure 13: Nitrate and per cent share of samples in Jaipur City

                                       Figure 14: Distribution of Nitrate Level in Jaipur City

                                                                                                                         Page | 98
International Journal of Enhanced Research in Science Technology & Engineering, ISSN: 2319-7463
Vol. 3 Issue 7, July-2014, pp: (89-101), Impact Factor: 1.252, Available online at: www.erpublications.com
11. Sulphate
Sulphates are found in appreciable quantity in all natural waters, particularly high in arid and semi-arid regions where
natural water in general have a high salt content. Domestic sewage and industrial effluents, besides biological oxidation of
reduced sulfur species, may add to sulphate content of water. In a region where atmospheric sulfer content is high because
of industrial and automobile emission, the rain water has high sulfer content. Sulphate salts are mostly soluble in water and
impart hardness. Waters with about 500 mg/l sulphate have a better taste and those with 1000mg/l or more sulphate may
cause intestinal disorders. Sulphate in the collected samples was estimated by developing turbidity by BaCl 2 and measuring
its concentration using spectrophotometer at 420nm. Sulphate concentration in all the collected samples has been found
within the desirable limits. The distribution of sulphate level in Jaipur city is presented in Figure 16.
Having done the physico-chemical analysis of the ground water samples, an attempt has further been made to compute
water quality index of various locations in the study area and is presented in the subsequent section.
Figure 15: Distribution of Sulphate Level in Jaipur City
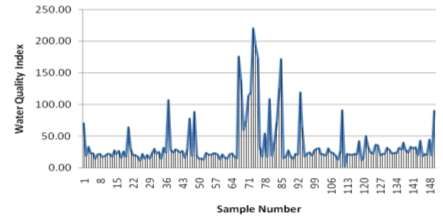
12. Water Quality Index
The Water Quality Index (WQI) is a very useful and efficient method for assessing the quality of water (Pradhan et al.
2001; Asadi et al. 2007). It is an attempt to arrive at a single number to express overall water quality at a certain location in
order to enable easy comprehension of complex water quality data and to arrive at general idea about the possible problems
with the water at the given location. In this investigation, an index value of 0–25 signifies excellent water quality, similarly
26–50 = Good, 51–75 = Poor, 76–100 = Very poor and the index value greater than 100 implies that water is unfit for
drinking. To determine the suitability of the groundwater for drinking purposes, WQI has been computed from the
following formula:
WQI = Anti log [ ∑Wn log 10 qn ]
Where, Wn, is a weighting factor derived from Wn = K/Sn; K, proportionality constant is derived from K = [1/(∑n n =
1 1/Si)]; Sn and Si are the IS: 10500 standard values of the water quality parameter. Quality rating (q) is calculated using
the formula
qni = {[(Vactual − Videal)/(Vstandard − Videal)] x 100}
where, qni, quality rating of ith parameter for a total of n water quality parameters; V actual, value of the water quality
parameter obtained from laboratory analysis; Videal, value of water quality parameter obtained from the standard tables;
Videal for pH = 7 and for other parameters it is equivalent to zero; V standard, IS: 10500 standard of the water quality
parameter. The results are presented in Table and Figure.
It is observed from the table and figure that three-fifth (60 per cent) of the total number of samples have excellent water
quality, followed by about one-fourth (24 per cent) samples have good water quality; whereas eight per cent samples have
poor to very poor water quality and another eight per cent samples have water quality unfit for drinking purposes.
Page | 99International Journal of Enhanced Research in Science Technology & Engineering, ISSN: 2319-7463
Vol. 3 Issue 7, July-2014, pp: (89-101), Impact Factor: 1.252, Available online at: www.erpublications.com
Table 8: Distribution of Ground Water Quality in Jaipur City
S.No. Range Category No. of locations Per cent Distribution
1 0-25 Excellent 91 60
2 26-50 Good 36 24
3 51-75 Poor 7 5
4 76-100 Very poor 4 3
5 >100 Unfit for drinking 12 8
Figure 16: Ground Water Quality and Per cent share of samples in Jaipur City
Figure 17: Distribution of Ground Water Quality in Jaipur City
13. Acknowledgements
1. Central Pollution Control Board, New Delhi, India
2. Dr. D. N. Pandey, Member Secretary; Rajasthan State Pollution Control Board, Jaipur, Rajasthan, India.
Page | 100International Journal of Enhanced Research in Science Technology & Engineering, ISSN: 2319-7463
Vol. 3 Issue 7, July-2014, pp: (89-101), Impact Factor: 1.252, Available online at: www.erpublications.com
14. Conclusion
An attempt has been made in this investigation to ascertain ground water quality in Jaipur city. Hundered and fifty samples
were taken from various parts of the city, and the results are being compared with IS: 10500 standard of the water quality
parameter and subsequently computed the water quality index. The results reveal that most of the locations (84 per cent)
have good to excellent water quality. However, nitrate contamination is a concern in the study area as two-fifth (41 per
cent) of the total number of locations has nitrate levels beyond permissible limits. It signifies poor sanitation condition in
the study area. It follows from the research that augmentation of sewerage infrastructure and its coverage is essential to
bring down pollution levels in the study area.
References
[1]. Jaipur City Development Plan, 2005, Urban Development Department, Government of Rajasthan, Jaipur.
[2]. Annual Report, 2011, Rajasthan State Ground Water Board, Jaipur.
[3]. APHA (1985) Standard methods for the examination of water and waste water (16th ed.), Washington D.C: American Public
Health Association, American Water Work Association, Water Pollution Control Federation.
[4]. Worl Health Organization (WHO), 1996, Guidelines for Drinking Water Quality 2, Geneva, 231.
[5]. Bureau of Indian Standards, 2010, Drinking Water Specification
[6]. Pandit ,M., Bhardwaj K., , Vinay, Pareek, N., 2009. Urbanization impact on hydrogeological regime in Jaipur Urban Block: a
rapidly growing urban center in NW India.Environmentalist (2009) 29:341–347.
[7]. Chatterjee R., Tarafder G., Paul, S., 2010. Groundwater quality assessment of Dhanbad district,Jharkhand, India.Bull Eng Geol
Environ (2010) 69:137–141.
Page | 101You can also read